House Price Index - আরবিআই - Reserve Bank of India
House Price Index
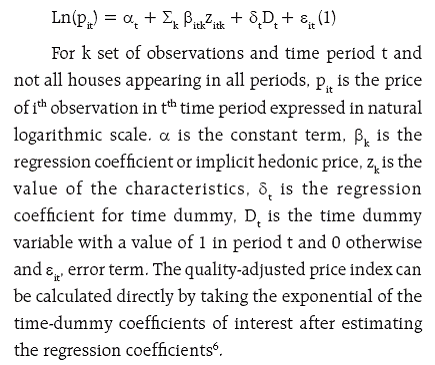
The Reserve Bank is compiling quarterly house price index (HPI) (base Q4:2008-09=100) for nine major cities, viz., Mumbai, Delhi, Chennai, Kolkata, Bengaluru, Lucknow, Ahmedabad, Jaipur and Kanpur. Based on these city indices, an average house price index representing all-India house price movement is also compiled. These indices are based on the official data collected from registration authorities of respective State Governments on property transactions. They are regularly published in the RBI’s Macroeconomic and Monetary Developments. This article presents the trends in price based on HPI in India for the period Q4:2008-09 – Q4:2012-13. Also, in order to control for the quality attributes of house on prices, a hedonic HPI is compiled and its trends are examined. Introduction A house is both an asset and an important determining factor of household’s cost of living. A change in the house price affects housing equity and household debt levels that in turn may influence to the overall economic activity. Many a time consumer spending gets affected by house price changes through the wealth effects. At macroeconomic level, policymakers track house prices to enhance their understanding of real estate and credit markets1. This may help them to realize the impact of real estate prices on economic activity and financial stability2. The movement in house prices are also used as an indicator of households’ borrowing capacity and debt burden and their effects on aggregate consumption3, 4. Further, the trend in house price contains forward looking information and it reflects market’s expectations of the value of the future stream of services derived from the property. Thus, it could potentially play an important role in monetary policy setting for its overall objectives of price stability and sustainable growth. Also shocks to household balance sheets, primarily through the changes in house prices, amplify fluctuations in consumer spending by tightening or relaxing collateral constraints on borrowing. However, lack of transparency in the residential property market transactions pose important challenges for keeping track of real estate price dynamics. Therefore, it is crucial to have a realistic measure of aggregate house price in order to understand its behaviour and influence on the economy. Beginning with Mumbai city, the Reserve Bank initiated the work of compiling a house price index (HPI) in 2007 and brought out a quarterly HPI for Mumbai city (base 2002-03=100) in the Macroeconomic and Monetary Developments 2009-10. Over the time, its coverage has been extended by incorporating 8 more cities, viz., Delhi, Chennai, Kolkata, Bengaluru, Lucknow, Ahmedabad, Jaipur and Kanpur and the base is shifted to Q4:2008-09=100. This index is compiled using the official data on property transactions collected from registration authorities of the respective State Governments. It uses a weighted average Laspeyres index methodology for compilation of the index. This article captures two broad aspects of HPI in India. First, it explains the methodological details related to HPI compilation, particularly that of quality adjustments in measuring aggregate house price. Second, the trends in HPI in India are discussed. In addition, how quality adjustment affects the trends in HPI is also examined. 2. Methodology The measurement of aggregate house price is challenging mainly due to two features, viz. , heterogeneity of houses and low frequency of sales. Since no two houses are same, the observed difference in characteristics (quality) between two houses will be reflected in difference in price. Because transaction on any specific house occur relatively infrequently, it is hard to know the amount at which a specific house will transact today5. Three different approaches are popularly used to control for the quality/attributable changes in real estate properties. They are stratification or mix adjustment, repeat sales methodology and hedonic methodology. 2.1 stratification or Mix-adjustment Mix-adjustment - controlling for changes in the composition or “quality mix”- is an essential part of the index methodology used for compiling the residential property price indices. Mix-adjustment is applied in a number of different ways. Residential property price index for many countries is derived from unit value prices. But considering unit value prices alone does not necessarily adjust for differences in the quality of a house. There can also be compositional changes such as location, physical and environmental amenities, and the general quality of housing. This could be further extended by stratifying the houses by what are generally recognised as important price determining characteristics. Mix-adjustment is thus in essence a form of stratification1. After constructing a measure of relative change in the mean or median price for strata for a particular time period, the aggregate price index is calculated as a weighted average of indices for each stratum. For aggregation, type of weights depends on the target index that the price index is supposed to measure. If the purpose is to track the price change of the housing transactions, then transaction based weights should be used1. Weights can also be based on value or number of transactions. The value weighting provides a better estimate of the investment return, while an index compiled by number weighting is a good estimate of the price appreciation5. 2.2 Repeat Sales Method Popular Case-Shiller House Price Index for the US is based on what we call the ‘repeat sales method’. Here, the price information of the properties are collected which have been sold more than once. For each sale transaction, a search is conducted to find information regarding any previous sale for the same house. If an earlier transaction is found, the two transactions are paired and are considered a “sale pair”. Sale pair provides the price change for the same house, while holding the quality and size of the house constant. This HPI is designed to reflect the average change in market prices for constant-quality homes in a specified geographic market. It does an excellent job in controlling the cross-sectional variation in quality attributes. However, application of this method in country like India has some inherent problems. Being a developing economy, a lot of new construction takes place every quarter/ year and it is not very common for Indians to sell and move from one house to other due to emotional attachments. So the concept of ‘repeat sales’ may lead to small sample bias, where second or higher sales are infrequent. Another obvious problem with this methodology is the stable quality requirement for houses. The qualities may rundown or improve over a period of time resulting in underestimation or overestimation of aggregate house price. For these reasons, Case–Shiller type house price index will have limited use in Indian context. 2.3 Hedonic methodology Hedonic methods are techniques for quality adjustments that are incorporated in the calculations of the price indices for segments like houses. Final objective of this measure is to gauge the price changes after controlling the influence of quality change. These methods utilize information on the property attributes to estimate the quality adjusted price indices. The difficulty for the analyst here is that the price paid by the purchaser for each of the characteristics is not available. To overcome this problem, a multivariate regression technique is used to obtain the implicit prices associated with each of the characteristics. The estimated coefficients of the regression indicate the relative importance of the variables in explaining the variation in the house prices at any time period. There are different approaches for constructing the hedonic price indices. The time dummy variable method has been prominent in the real estate literature1. Time dummy hedonic regression model is specified with the housing characteristics and dummy variable/s corresponding to time as independent variables and the collected prices as the dependent variable. Model specification for the time dummy method look like this: 
2.4 RBI’s House Price Index The house price index compiled by the Reserve Bank uses stratification as an approach to control the property characteristics. It is compiled using Laspeyres weighted average methodology. First, the simple average of price (per square meter) of houses (Pij) in each category, classified by Floor Space Area (FSA) into small, medium and large for each ward/zone in each quarter is calculated. As a method of averaging, median is used. Second, the proportions of number of houses transacted during in three categories of FSA within a ward/zone during the period January 2009-March 2009 is taken as the weights (wi,j). Then, based on an average per square meter price for three FSA category houses in each ward/zone, price-relatives are calculated for each quarter. The price relative is a ratio of current period price to the base period price. Price relative per square meter for the ith FSA, jth Ward/Zone, tth Quarter is given by 
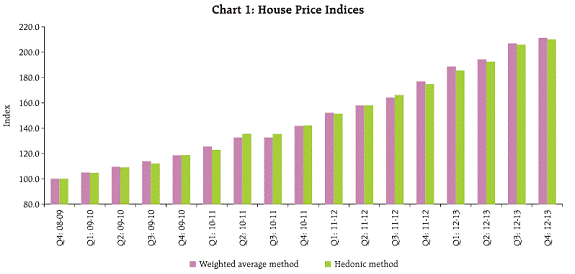
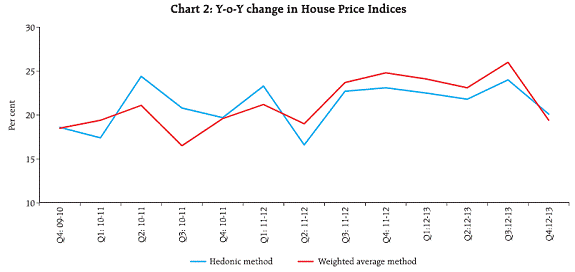
The quarterly ward/zone weighted average price relatives are calculated next. These weighted relative prices are again averaged using proportion of number of houses in each ward to the total number (value) of houses during the period January 2009-March 2009 as the weight (Wj). Then the following formula is used for constructing the ward/zone HPI for the jth ward/zone for tth quarter The city-wise price indices are averaged using the population proportion (based on 2011 census) of the nine cities to total to obtain the all-India index7. 3. Results 3. 1 House Price Index based on Weighted Average Methodology Overall house price index and point-to-point annual inflation rates of average nine city indices are presented in Table 1. It is observed that index of house price, increased annually on an average by 21 per cent during the past four years. City-wise house price indices are presented in Table A1. These indices track variation in house prices in various cities across time. The year-on- year variation in house prices across various cities are presented in Table A2. In the cities like Delhi, Bengaluru, Ahmedabad and Lucknow, house prices grew at relativity lesser pace during 2010-11, which picked up momentum in 2011-12, and then showing some moderation in price increase in 2012-13. Kolkata, Chennai and Jaipur which showed some moderation in price increase in 2011-12 compared to 2010-11, picked up momentum in 2012-13. 3. 2 House Price Index based on hedonic methodology Here, the HPI at city level is based on the time dummy hedonic method as described earlier. This is computed with a semi-logarithmic functional form with dependent variable (per square meter house price) measured in logarithm and with two independent variables viz., ward (attribute corresponding to location) and floor space area categories (based on percentiles). The regression diagnostics of multicollinearty of the regressors is tested for each equation and is found to be satisfactory. The problem of heteroscedasticity in errors is adjusted by taking heteroscedastic consistent standard errors. The compiled indices are presented in Table B1. The year-on-year variation in house prices across various cities are presented in Table 2. Further, an average nine city index is obtained with city and floor space area categories as the independent variables in the regression framework (Table B2). A comparison of HPI and y-o-y change in the house price indices compiled by weighted average and hedonic methods are presented in Chart 1 and Chart 2 respectively. It is observed that hedonic methodology in the present formulation has not produced very different results from that of weighted average methods. Hedonic regression methods adjust for quality changes in the housing prices and thus can in principle provide better index numbers. However, in this study only limited number of attributes are considered because of the non-availability of the detailed data on house characteristics. This may be a reason why hedonic methodology has not produced significantly different results from that of weighted average methods. 4. Limitations House price index compiled by the Reserve Bank uses registration price data. It is often believed that registered prices of houses are in general underestimated due to various reasons like high registration fees and stamp duty, obligations for the payment of property tax, etc. Further, the differences in the time gaps between the actual transactions and registrations also do not always follow the similar pattern across different states. Moreover, registrations of the properties are done taking into account different criterion in different states, some of which are: (i) partial consideration of un-divided share of land, (ii) partial consideration of sale of terrace rights, (iii) consideration of agreement to sale at the time booking for total price, and (iv) sale deed only post completion of property. On the other hand, the registration procedure and records maintenance are not computerized in some states and the records in most states are maintained in the regional languages which necessitates further work with respect to bringing them into common format. Getting segregated transactions on land agreement, whether a land is an agricultural land, sale deed, power of attorney, etc., is another challenge6. The nine-city average HPI compiled using Laspeyres’ approach is a weighted average of city-level HPIs. Ideally, the number of transactions at city level could have been used as weight for the all India index. However, in the existing data collection mechanism, separate information on the type of the property (residential/commercial) of Chennai is not available. As a result, the proportion of population of the city (to the total population of nine cities together) is used as the weight, as a proxy to the number of transactions6. Theoretically, hedonic methodology is superior and provides actual house price trends. The main drawback of this method is that it requires data on house attributes, which are not available easily. The non-availability of the data on host of housing attributes influencing the price poses a serious limitation on the hedonic index. A potentially serious source of bias in hedonic price may also be associated with the functional form misspecification. Another limitation may be due to the fact that many attributes of housing are interlinked. This may lead to a problem of multicollinearity in regression analysis leading to limitations in the compilation of hedonic price indices. 5. Conclusion The article presents various approaches for compiling house price index. Besides the Reserve Bank’s HPI, this article presents a hedonic house price methodology in Indian context using a time dummy approach. Estimated indices, at city level as well as at all-India level, are based on official data received from registration authorities of various State Governments. Recent trends in the house price index reveal that the increase in house prices was steep in the last few years. On an average, the index of house prices increased annually by around 21 per cent during the past four years.
* Prepared in the Statistical Analysis Division of the Department of Statistics and Information and Management. 1 Eurostat (2013), Handbook on Residential Property Prices Indices (RPPIs). 2 Case, B. and S. Wachter (2005), “Residential Real Estate Price Indices as Financial Soundness Indicators: Methodological Issues”, pp. 197-211 in Real Estate Indicators and Financial Stability, BIS Papers No 21, Bank for International Settlements, Washington, DC. 3 Finocchiaro, D. and V. Queijo von Heideken (2007), “Do Central Banks React to House Prices?”, Working Paper Series 217, Sveriges Riksbank (Central Bank of Sweden). 4 Case, K.E., J.M. Quigley, and R.J. Shiller (2001), “Comparing Wealth Effects: The Stock Market Versus the Housing Market.” National Bureau of Economic Research Working Paper Series, No. 8606. 5 Rappaport, J. (2007), "A Guide To Aggregate House Price Measures", Economic Review (2007:Q2): 41 –71. 6 Melser, D., (2005), "The Hedonic Regression Time-Dummy Method And The Monotonicity Axioms", Journal of Business & Economic Statistics, 23(4): 485-492. 7 Reserve Bank of India (2012), “House Price Index”, RBI Monthly Bulletin October 2012 |
||||||||||||||||||||||||||||||||||||||||||||||||||||||||||||||||||||||||||||||||||||||||||||||||||||||||||||||||||||||||||||||||||||||||||||||||||||||||||||||||||||||||||||||||||||||||||||||||||||||||||||||||||||||||||||||||||||||||||||||||||||||||||||||||||||||||||||||||||||||||||||||||||||||||||||||||||||||||||||||||||||||||||||||||||||||||||||||||||||||||||||||||||||||||||||||||||||||||||||||||


