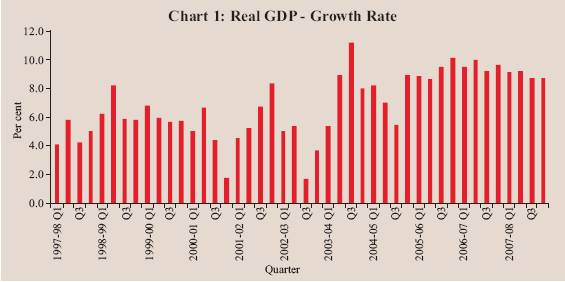
| The Indian economy continued to record robust growth in 2007-08, although marginally lower than the last year. According to the revised estimates released by the Central Statistical Organisation (CSO) in May 2008, the real GDP growth was placed at 9.0 per cent during 2007-08 as compared with 9.6 per cent in 2006-07. The deceleration in growth was on account of industry and services, offset partially by recovery in agriculture. The overall growth momentum moderated particularly during the second half of the year (Table 1 and Chart 1).
Table 1: Growth Rates of Real GDP @ |
(Per cent) |
Sector |
2000-01 to2007-08(Average) |
2005-06 |
2006-07 * |
2007-08 # |
2006-07 |
2007-08 |
Q1 |
Q2 |
Q3 |
Q4 |
Q1 |
Q2 |
Q3 |
Q4 |
1 |
|
2 |
3 |
4 |
5 |
6 |
7 |
8 |
9 |
10 |
11 |
12 |
13 |
1. |
Agriculture and |
2.9 |
5.9 |
3.8 |
4.5 |
2.7 |
3.2 |
4.0 |
4.9 |
4.4 |
4.7 |
6.0 |
2.9 |
|
Allied Activities |
(20.9) |
(19.6) |
(18.5) |
(17.8) |
|
|
|
|
|
|
|
|
2. |
Industry |
7.1 |
8.0 |
10.6 |
8.1 |
10.0 |
10.7 |
10.3 |
11.5 |
9.6 |
8.6 |
8.6 |
5.8 |
|
|
(19.6) |
(19.4) |
(19.5) |
(19.4) |
|
|
|
|
|
|
|
|
|
2.1 |
Mining and Quarrying |
4.9 |
4.9 |
5.7 |
4.7 |
4.1 |
3.9 |
6.0 |
8.2 |
1.7 |
5.5 |
5.7 |
5.9 |
|
2.2 |
Manufacturing |
7.8 |
9.0 |
12.0 |
8.8 |
11.7 |
12.2 |
11.3 |
12.8 |
10.9 |
9.2 |
9.6 |
5.8 |
|
2.3 |
Electricity, Gas and |
|
|
|
|
|
|
|
|
|
|
|
|
|
|
Water Supply |
4.8 |
4.7 |
6.0 |
6.3 |
4.3 |
6.6 |
7.6 |
5.4 |
7.9 |
6.9 |
4.8 |
5.6 |
3. |
Services |
9.0 |
11.0 |
11.2 |
10.7 |
11.7 |
11.6 |
11.1 |
10.5 |
10.6 |
10.7 |
10.0 |
11.4 |
|
|
|
(59.6) |
(61.1) |
(61.9) |
(62.9) |
|
|
|
|
|
|
|
|
|
3.1 |
Trade, Hotels, |
|
|
|
|
|
|
|
|
|
|
|
|
|
|
Restaurants, Transport, |
|
|
|
|
|
|
|
|
|
|
|
|
|
|
Storage and |
|
|
|
|
|
|
|
|
|
|
|
|
|
|
Communication |
10.3 |
11.5 |
11.8 |
12.0 |
10.9 |
12.7 |
12.1 |
11.6 |
13.1 |
11.0 |
11.5 |
12.4 |
|
3.2 |
Financing, Insurance, |
|
|
|
|
|
|
|
|
|
|
|
|
|
|
Real Estate and |
|
|
|
|
|
|
|
|
|
|
|
|
|
|
Business Services |
8.8 |
11.4 |
13.9 |
11.8 |
13.6 |
13.9 |
14.7 |
13.4 |
12.6 |
12.4 |
11.9 |
10.5 |
|
3.3 |
Community, Social |
|
|
|
|
|
|
|
|
|
|
|
|
|
|
and Personal services |
5.8 |
7.2 |
6.9 |
7.3 |
10.3 |
7.2 |
5.6 |
5.1 |
5.2 |
7.7 |
6.2 |
9.5 |
|
3.4 |
Construction |
10.6 |
16.5 |
12.0 |
9.8 |
13.1 |
12.0 |
10.8 |
12.2 |
7.7 |
11.8 |
7.1 |
12.6 |
4. |
Real GDP at Factor Cost |
7.3 |
9.4 |
9.6 |
9.0 |
9.6 |
10.1 |
9.3 |
9.7 |
9.2 |
9.3 |
8.8 |
8.8 |
|
|
|
(100) |
(100) |
(100) |
(100) |
|
|
|
|
|
|
|
|
Memo: |
|
|
|
|
|
|
|
|
|
(Amount in Rupees crore) |
a) |
Real GDP at Factor Cost |
26,12,847 |
28,64,310 |
31,22,862 |
|
|
|
|
|
|
|
|
b) |
GDP at Current Market Prices |
35,80,344 |
41,45,810 |
47,13,148 |
|
|
|
|
|
|
|
|
@ : At 1999-2000 prices. * : Quick Estimates. # : Revised Estimates.
Note
: Figures in parentheses indicate shares in real GDP.
Source : Central Statistical Organisation. |
Agricultural Situation
According to the revised forecast of the India Meteorological Department (IMD) released in June 2008, the rainfall during the 2008 South-West monsoon season (June to September) is likely to be 100 per cent of the long period average (LPA) with a model error of (+/-) 4 per cent. Monsoon set in over Kerala on May 31, 2008 coinciding almost with its normal date of arrival (June 1). It advanced rapidly and covered parts of south peninsula and entire north-eastern States by June 2, 2008. Northward advance of monsoon over east and central India also has been near normal. Advance of this year’s monsoon has been smooth and rapid, unlike last year when it was marked by a hiatus of about one week over south peninsula. Rainfall during this year’s monsoon so far (up to July 23) has been less satisfactory, with rainfall over the entire country amounting to 2 per cent below normal as against 4 per cent above normal during corresponding period of the previous year (Table 2). Out of the 36 meteorological sub-pisions, 21 have received excess/normal rainfall this year (up to July 23) as compared with 29 last year. As on July 17, 2008, the total live water storage of 81 important reservoirs accounting for around 72 per cent of the total reservoir capacity of the country was 28 per cent of the full reservoir level (FRL) as compared to 45 per cent recorded during the corresponding period of the previous year. The average live water storage as per cent of FRL for the last ten years has been much lower at 25 per cent. Kharif sowing is progressing with the advent of the South-West monsoon in various States. Area coverage under kharif crops up to July 18, 2008 was higher by 1.3 million hectares over the corresponding period of the previous year. Among food crops, rice exhibited significant increase in sown area along with coarse cereals and oilseeds (Table 3).
Table 2: Cumulative Rainfall |
(Number of Meteorological pisions) |
Year |
South-West Monsoon |
North-East Monsoon |
Cumulative
Rainfall:
Above(+)/
Below (-)
Normal
(per cent) |
Spatial Distribution |
Cumulative
Rainfall:
Above(+)/
Below (-)
Normal
(per cent) |
Spatial Distribution |
Excess
Rainfall |
Normal
Rainfall |
Deficient
Rainfall |
Scanty/
No Rain |
Excess
Rainfall |
Normal
Rainfall |
Deficient
Rainfall |
Scanty/
No Rain |
1 |
2 |
3 |
4 |
5 |
6 |
7 |
8 |
9 |
10 |
11 |
1998 |
6 |
12 |
21 |
3 |
0 |
- |
28 |
6 |
1 |
1 |
1999 |
-4 |
3 |
26 |
7 |
0 |
- |
20 |
7 |
6 |
3 |
2000 |
-8 |
5 |
23 |
8 |
0 |
- |
0 |
4 |
13 |
19 |
2001 |
-8 |
1 |
30 |
5 |
0 |
- |
14 |
10 |
9 |
3 |
2002 |
-19 |
1 |
14 |
19 |
2 |
-33 |
3 |
7 |
12 |
14 |
2003 |
2 |
7 |
26 |
3 |
0 |
9 |
9 |
9 |
6 |
12 |
2004 |
-13 |
0 |
23 |
13 |
0 |
-11 |
8 |
10 |
17 |
1 |
2005 |
-1 |
9 |
23 |
4 |
0 |
10 |
11 |
6 |
5 |
14 |
2006 |
-1 |
6 |
20 |
10 |
0 |
-21 |
3 |
6 |
14 |
13 |
2007 |
5 |
13 |
17 |
6 |
0 |
-32 |
2 |
7 |
9 |
18 |
2008* |
-2 |
9 |
12 |
14 |
1 |
|
|
|
|
|
|
(4) |
(14) |
(15) |
(7) |
(0) |
|
|
|
|
|
* : up to July 23. Excess : +20 per cent or more. Normal : +19 per cent to -19 per cent.
Deficient : -20 per cent to -59 per cent. Scanty : -60 per cent to -99 per cent.
No Rain : -100 per cent.
Note
: Figures in parentheses indicate comparative position during the corresponding period of 2007.
Source: India Meteorological Department. |
Table 3: Progress of Area under Kharif Crops 2008-09 |
(Million hectares) |
Crop |
Normal Area |
Area Coverage (As on July 18, 2008) |
|
|
2007 |
2008 |
Variation |
1 |
2 |
3 |
4 |
5 |
Rice |
39.1 |
12.1 |
14.9 |
2.8 |
Coarse Cereals |
22.7 |
9.6 |
9.9 |
0.3 |
of which: |
|
|
|
|
Bajra |
9.2 |
3.2 |
4.0 |
0.8 |
Jowar |
4.2 |
1.8 |
1.3 |
-0.5 |
Maize |
6.4 |
4.3 |
4.1 |
-0.2 |
Total Pulses |
10.9 |
4.2 |
4.2 |
0.0 |
Total Oilseeds |
15.9 |
9.9 |
10.1 |
0.2 |
of which: |
|
|
|
|
Groundnut |
5.4 |
3.0 |
2.7 |
-0.3 |
Soyabean |
7.3 |
5.5 |
6.5 |
1.0 |
Sugarcane |
4.1 |
5.3 |
4.3 |
-1.0 |
Cotton |
8.4 |
7.0 |
5.8 |
-1.2 |
All Crops |
101.9 |
48.8 |
50.1 |
1.3 |
Source : Ministry of Agriculture, Government of India. |
According to the Fourth Advance Estimates, the foodgrains production during 2007-08 was placed at an all-time high of 230.7 million tonnes, indicating an increase of 6.2 per cent over the previous year predominantly on account of kharif foodgrains production. Barring sugarcane, all foodgrains and non-foodgrains are estimated to reach an all-time record production during 2007-08 (Table 4). Crops witnessing significant increase in production included coarse cereals (20.1 per cent) and oilseeds (18.6 per cent). Food Management
The procurement of foodgrains (rice and wheat) during 2008-09 (up to July 18, 2008) aggregated to 27.3 million tonnes, 78.6 per cent higher than that in the corresponding period of the previous year (Table 5). This was mainly on account of a more than two-fold increase in wheat procurement during the current year as compared with the previous year. The offtake of foodgrains (rice and wheat) during 2007-08 at 37.4 million tonnes was marginally higher by 1.8
Table 4: Agricultural Production |
(Million tonnes) |
Crop |
2003-04 |
2004-05 |
2005-06 |
2006-07 |
2007-08 |
Target |
Achievement @ |
1 |
2 |
3 |
4 |
5 |
6 |
7 |
Rice |
88.5 |
83.1 |
91.8 |
93.4 |
93.0 |
96.4 |
Kharif |
78.6 |
72.2 |
78.3 |
80.2 |
80.0 |
82.8 |
Rabi |
9.9 |
10.9 |
13.5 |
13.2 |
13.0 |
13.6 |
Wheat |
72.2 |
68.6 |
69.4 |
75.8 |
75.5 |
78.4 |
Coarse Cereals |
37.6 |
33.5 |
34.1 |
33.9 |
37.5 |
40.7 |
Kharif |
32.2 |
26.4 |
26.7 |
25.6 |
28.7 |
31.7 |
Rabi |
5.4 |
7.1 |
7.3 |
8.3 |
8.8 |
9.0 |
Pulses |
14.9 |
13.1 |
13.4 |
14.2 |
15.5 |
15.1 |
Kharif |
6.2 |
4.7 |
4.9 |
4.8 |
5.5 |
6.5 |
Rabi |
8.7 |
8.4 |
8.5 |
9.4 |
10.0 |
8.7 |
Total Foodgrains |
213.2 |
198.4 |
208.6 |
217.3 |
221.5 |
230.7 |
Kharif |
117.0 |
103.3 |
109.9 |
110.6 |
114.2 |
121.0 |
Rabi |
96.2 |
95.1 |
98.7 |
106.7 |
107.3 |
109.7 |
Total Oilseeds |
25.2 |
24.4 |
28.0 |
24.3 |
30.0 |
28.8 |
Kharif |
16.7 |
14.1 |
16.8 |
14.0 |
18.5 |
19.8 |
Rabi |
8.5 |
10.2 |
11.2 |
10.3 |
11.5 |
9.0 |
Sugarcane |
233.9 |
237.1 |
281.2 |
355.5 |
310.0 |
340.6 |
Cotton # |
13.7 |
16.4 |
18.5 |
22.6 |
22.0 |
25.8 |
Jute and Mesta ## |
11.2 |
10.3 |
10.8 |
11.3 |
11.0 |
11.2 |
@ : Fourth Advance Estimates as on July 9, 2008.
# : Million bales of 170 kgs each.
## : Million bales of 180 kgs each.
Source : Ministry of Agriculture, Government of India. |
Table 5: Management of Food Stocks |
(Million tonnes) |
Month |
Opening Stock of Foodgrains |
Procurement of Foodgrains |
Foodgrains Offtake |
Closing
Stock |
Norms |
Rice |
Wheat |
Total |
Rice |
Wheat |
Total |
PDS |
OWS |
OMS-
Domestic |
Exports |
Total |
1 |
2 |
3 |
4 |
5 |
6 |
7 |
8 |
9 |
10 |
11 |
12 |
13 |
14 |
|
2004-05 |
13.1 |
6.9 |
20.7 |
24.0 |
16.8 |
40.8 |
29.7 |
10.6 |
0.2 |
1.0 |
41.5 |
18.0 |
|
2005-06 |
13.3 |
4.1 |
18.0 |
26.7 |
14.8 |
41.5 |
31.4 |
9.8 |
1.1 |
0.0 |
42.3 |
16.6 |
|
2006-07 |
13.7 |
2.0 |
16.6 |
26.3 |
9.2 |
35.5 |
31.6 |
5.1 |
0.0 |
0.0 |
36.8 |
17.9 |
|
2007-08 |
13.2 |
4.7 |
17.9 |
26.4 |
11.1 |
37.5 |
33.5 |
3.9 |
0.0 |
0.0 |
37.4 |
19.8 |
|
2008-09 @ |
13.8 |
5.8 |
19.8 |
4.7 |
22.5 |
27.3 |
.. |
.. |
.. |
.. |
.. |
.. |
|
|
|
|
|
(4.2) |
(11.1) |
(15.3) |
|
|
|
|
|
|
|
2007 |
|
|
|
|
|
|
|
|
|
|
|
|
|
January |
12.0 |
5.4 |
17.5 |
4.3 |
0.0 |
4.3 |
2.7 |
0.4 |
0.0 |
0.0 |
3.1 |
18.1 |
20.0 |
February |
12.6 |
5.4 |
18.1 |
2.4 |
0.0 |
2.4 |
2.7 |
0.5 |
0.0 |
0.0 |
3.1 |
19.1 |
|
March |
14.0 |
5.1 |
19.1 |
1.2 |
0.0 |
1.2 |
2.7 |
0.5 |
0.0 |
0.0 |
3.2 |
17.9 |
|
April |
13.2 |
4.7 |
17.9 |
0.9 |
7.9 |
8.7 |
2.6 |
0.2 |
0.0 |
0.0 |
2.8 |
25.1 |
16.2 |
May |
13.5 |
11.6 |
25.1 |
1.5 |
2.6 |
4.0 |
2.8 |
0.2 |
0.0 |
0.0 |
3.0 |
25.9 |
|
June |
12.6 |
13.3 |
25.9 |
1.3 |
0.7 |
2.0 |
2.7 |
0.4 |
0.0 |
0.0 |
3.0 |
23.9 |
|
July |
11.0 |
12.9 |
23.9 |
0.8 |
0.0 |
0.8 |
2.9 |
0.4 |
0.0 |
0.0 |
3.2 |
21.2 |
26.9 |
August |
9.2 |
12.0 |
21.2 |
0.1 |
0.0 |
0.1 |
2.8 |
0.3 |
0.0 |
0.0 |
3.0 |
17.9 |
|
September |
6.9 |
11.0 |
17.9 |
0.1 |
0.0 |
0.1 |
2.7 |
0.3 |
0.0 |
0.0 |
2.9 |
15.6 |
|
October |
5.5 |
10.1 |
15.6 |
7.4 |
0.0 |
7.4 |
2.7 |
0.3 |
0.0 |
0.0 |
2.9 |
19.7 |
16.2 |
November |
10.7 |
9.0 |
19.7 |
1.8 |
0.0 |
1.8 |
2.7 |
0.3 |
0.0 |
0.0 |
2.9 |
18.5 |
|
December |
10.1 |
8.4 |
18.5 |
3.5 |
0.0 |
3.5 |
2.7 |
0.3 |
0.0 |
0.0 |
3.0 |
19.2 |
|
2008 |
|
|
|
|
|
|
|
|
|
|
|
|
|
January |
11.5 |
7.7 |
19.2 |
4.5 |
0.0 |
4.5 |
2.9 |
0.3 |
0.0 |
0.0 |
3.2 |
21.4 |
20.0 |
February |
14.0 |
7.2 |
21.4 |
3.0 |
0.0 |
3.0 |
2.9 |
0.4 |
0.0 |
0.0 |
3.4 |
21.4 |
|
March |
14.7 |
6.5 |
21.4 |
1.6 |
0.0 |
1.6 |
3.1 |
0.5 |
0.0 |
0.0 |
3.5 |
19.8 |
|
April |
13.8 |
5.8 |
19.8 |
1.1 |
12.6 |
13.7 |
.. |
.. |
.. |
.. |
.. |
.. |
16.2 |
May |
.. |
.. |
.. |
2.1 |
8.8 |
10.9 |
.. |
.. |
.. |
.. |
.. |
.. |
|
June |
.. |
.. |
.. |
1.2 |
0.9 |
2.2 |
.. |
.. |
.. |
.. |
.. |
.. |
|
July @ |
.. |
.. |
.. |
0.3 |
0.2 |
0.5 |
.. |
.. |
.. |
.. |
.. |
.. |
26.9 |
PDS : Public Distribution System.
OWS : Other Welfare Schemes. OMS : Open Market Sales. .. : Not Available.
@ : Procurement up to July 18, 2008.
Note : 1. Closing stock figures may differ from those arrived at by adding the opening stocks and procurement and deducting offtake, as stocks include coarse grains also.
2. Figures in parentheses indicate procurement of foodgrains during the corresponding period of 2007-08.
3. Total minimum stocks are to be maintained, as on April 1, July 1, October 1, and January 1, by public agencies under the 'new buffer stocking policy' with effect from March 29, 2005.
Source : Ministry of Consumer Affairs, Food and Public Distribution, Government of India. |
per cent than that of the previous year. The total stocks of foodgrains with the Food Corporation of India (FCI) and other Government agencies were at around 19.8 million tonnes as on April 1, 2008, which was higher by 10.2 per cent than that a year ago. Both, the stocks of rice (13.8 million tonnes) and of wheat (5.8 million tonnes) were higher than their buffer stock norms (12.2 million tonnes and 4.0 million tonnes, respectively). 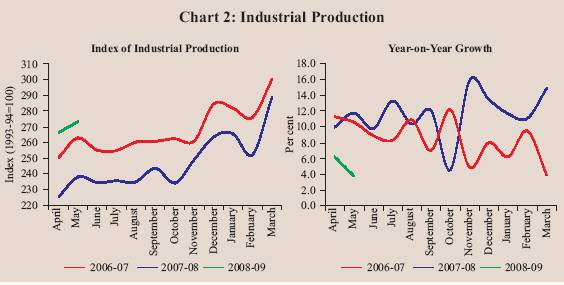
InIndustrial Performance
Industrial production moderated during April-May 2008, recording year-on-year expansion of 5.0 per cent as against 10.9 per cent in April-May 2007 (Chart 2 and Table 6). The industrial deceleration was driven by both the manufacturing and electricity sectors. Manufacturing recorded cumulative growth of 5.3 per cent during April-May 2008 as compared with 11.8 per cent during the corresponding period of the previous year. Electricity sector at 1.7 per cent witnessed a sharp slowdown - the lowest growth since 1994-95 for April-May period on account of decline in electricity generation in all the three segments. The mining sector growth, however, accelerated.
The slowdown in manufacturing activity was driven by 13 industry groups (56.3 per cent weight in the IIP) that recorded decelerated/negative growth in April-May 2008 (Table 7). Industry groups such as 'metal products and parts', 'other manufacturing industries', 'rubber, plastic, petroleum and coal products', 'food products', 'jute and other vegetable fibre textiles' and 'wood and wood products' recorded a decline in production; while 'leather and leather and fur products', 'machinery and equipment', 'basic metal and alloy industries', 'wool, silk and manmade fibre textiles', 'textile products', 'cotton textiles' and 'non-metallic mineral products' recorded decelerated growth. However, the growth in 'chemicals and chemical products', a dominant segment of the manufacturing industry, accelerated reflecting sharp expansion in nitrogenous fertilisers segment and other pharmaceutical drugs.
Table 6: Index of Industrial Production: Sectoral and
Use-Based Classification of Industries |
(Per cent) |
Industry Group |
Weight
in the IIP |
Growth Rate |
Weighted Contribution# |
2007-08 |
2007-08 |
2008-09 P |
2007-08 |
2007-08 |
2008-09 P |
|
|
|
April-May |
|
April-May |
1 |
2 |
3 |
4 |
5 |
6 |
7 |
8 |
Sectoral |
|
|
|
|
|
|
|
Mining |
10.5 |
5.1 |
3.2 |
5.6 |
4.3 |
2.1 |
7.5 |
Manufacturing |
79.4 |
8.8 |
11.8 |
5.3 |
89.4 |
90.6 |
89.2 |
Electricity |
10.2 |
6.3 |
9.0 |
1.7 |
6.4 |
7.3 |
3.0 |
Use-Based |
|
|
|
|
|
|
|
Basic Goods |
35.6 |
7.0 |
9.5 |
3.5 |
25.1 |
26.4 |
21.0 |
Capital Goods |
9.3 |
16.9 |
16.9 |
6.5 |
23.9 |
16.2 |
14.4 |
Intermediate Goods |
26.5 |
8.9 |
9.7 |
2.3 |
27.7 |
23.6 |
12.0 |
Consumer Goods (a+b) |
28.7 |
6.1 |
11.6 |
7.9 |
23.3 |
34.1 |
50.9 |
a) Consumer Durables |
5.4 |
-1.0 |
0.8 |
4.8 |
-1.0 |
0.6 |
7.3 |
b) Consumer Non-durables |
23.3 |
8.5 |
15.4 |
8.8 |
24.4 |
33.5 |
43.6 |
General |
100.0 |
8.3 |
10.9 |
5.0 |
100.0 |
100.0 |
100.0 |
P : Provisional.
# : Figures may not add up to 100 due to rounding off.
Source : Central Statistical Organisation. |
Table 7: Performance of Manufacturing Groups |
(Per cent) |
Industry Group |
Weigh t
in the IIP |
Growth Rate |
Weighted Contribution # |
2007-08 |
2007-08 2008-09 P |
2007-08 |
2007-08 |
2008-09 P |
April-May |
April-May |
1 |
|
2 |
3 |
4 |
5 |
6 |
7 |
8 |
1. |
Food products |
9.08 |
7.1 |
39.3 |
-7.9 |
6.4 |
21.9 |
-12.3 |
2. |
Beverages, tobacco and |
|
|
|
|
|
|
|
|
related products |
2.38 |
11.9 |
8.4 |
30.8 |
6.9 |
3.9 |
30.8 |
3. |
Cotton textiles |
5.52 |
4.3 |
7.4 |
1.5 |
2.0 |
2.7 |
1.2 |
4. |
Wool, silk and man-made |
|
|
|
|
|
|
|
|
fibre textiles |
2.26 |
4.8 |
4.1 |
3.6 |
1.6 |
1.0 |
1.9 |
5. |
Jute and other vegetable |
|
|
|
|
|
|
|
|
fibre textiles (except cotton) |
0.59 |
33.0 |
27.8 |
-10.1 |
1.0 |
0.7 |
-0.6 |
6. |
Textile products (including |
|
|
|
|
|
|
|
|
wearing apparel) |
2.54 |
3.7 |
7.5 |
2.6 |
1.4 |
2.3 |
1.7 |
7. |
Wood and wood products, |
|
|
|
|
|
|
|
|
furniture & fixtures |
2.70 |
39.6 |
87.9 |
-17.4 |
5.3 |
6.9 |
-5.1 |
8. |
Paper and paper products |
|
|
|
|
|
|
|
|
and printing , publishing |
|
|
|
|
|
|
|
|
and allied Industries |
2.65 |
2.7 |
0.8 |
2.5 |
1.0 |
0.2 |
1.4 |
9. |
Leather and leather & fur products |
1.14 |
11.5 |
8.9 |
8.5 |
1.1 |
0.6 |
1.3 |
10. |
Chemicals and chemical |
|
|
|
|
|
|
|
|
products (except products of |
|
|
|
|
|
|
|
|
petroleum & coal) |
14.00 |
10.6 |
6.6 |
12.2 |
22.8 |
11.6 |
45.9 |
11. |
Rubber, plastic, petroleum |
|
|
|
|
|
|
|
|
and coal products |
5.73 |
8.9 |
13.2 |
-5.2 |
6.2 |
7.1 |
-6.4 |
12. |
Non-metallic mineral products |
4.40 |
5.7 |
8.1 |
1.4 |
4.2 |
4.6 |
1.7 |
13. |
Basic metal and alloy industries |
7.45 |
12.1 |
19.6 |
4.6 |
13.7 |
15.7 |
8.8 |
14. |
Metal products and parts |
|
|
|
|
|
|
|
|
(except machinery and equipment) |
2.81 |
-5.6 |
4.2 |
-0.8 |
-1.6 |
0.8 |
-0.3 |
15. |
Machinery and equipment |
|
|
|
|
|
|
|
|
other than transport equipment |
9.57 |
9.5 |
16.1 |
5.7 |
17.6 |
20.6 |
17.0 |
16. |
Transport equipment and parts |
3.98 |
2.9 |
1.8 |
11.6 |
2.3 |
1.1 |
14.0 |
17. |
Other manufacturing industries |
2.56 |
19.8 |
-4.8 |
-1.5 |
8.2 |
-1.6 |
-0.9 |
|
Manufacturing - Total |
79.36 |
8.8 |
11.8 |
5.3 |
100.0 |
100.0 |
100.0 |
P : Provisional. # : Figures may not add up to 100 due to rounding off.
Source : Central Statistical Organisation. |
In terms of use-based classification, the basic goods sector decelerated during April-May 2008, mainly due to decline in production of certain petroleum and steel products. The intermediate goods sector also witnessed deceleration, mainly on account of lower performance of yarn, hessian, sacking and naptha segments. The capital goods sector that performed well during 2007-08, decelerated to 6.5 per cent due to lacklustre performance of printing machinery, material handling equipments, machine tools and computer systems and peripherals during the period. The consumer goods sector recorded decelerated growth due to moderated performance of non-durables. The consumer durable goods industry, which declined in eight months of the last financial year, posted 4.8 per cent growth during April-May 2008 led by the improved performance of two wheeler tyres, window type air conditioners, washing/laundry machines, motor cycles, passenger cars and T.V. receivers, among others. The consumer non-durables segment moderated in April-May 2008 on account of base effect and decline in production of sugar, wheat flour/maida, and certain edible oils.
Infrastructure
The core sector recorded lower growth at 3.5 per cent during April-May 2008 than 6.9 per cent during April-May 2007-08 (Chart 3). Sharp deceleration in electricity and subdued performance of petroleum refinery products impacted the growth of infrastructure during April-May 2008. The coal sector, on the other hand, recovered and posted robust growth. The electricity sector slowed down mainly on account of decline in nuclear and hydro electricity generation along with lower plant load factor in thermal power plants. The cement sector recorded decelerated growth due to base effect. The steel sector recorded moderate growth on account of capacity constraints. Increased production in Oil and Natural Gas Corporation (ONGC) Ltd. and Assam unit of Oil India Ltd. (OIL) contributed to a turnaround in crude oil sector. The petroleum refinery sector decelerated sharply on account of base effect and decline in production in some of the public sector refineries. 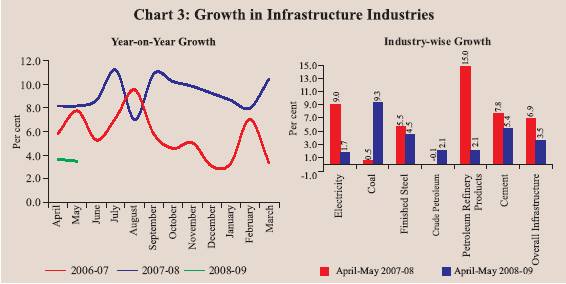
Services Sector
The services sector continued to record double digit growth during 2007-08, although there was some moderation. Accelerated growth in 'trade, hotels, transport, storage and communication' and 'community, social and personal services' was more than offset by deceleration in 'financing, insurance, real estate and business services' and 'construction'. Notwithstanding some moderation, services sector remained the major contributor to the GDP growth (Table 8).
Table 8: Services Sectors – Contribution to Real GDP Growth |
(percentage points) |
Year/Quarter |
Construction |
Trade, Hotels,
Transport and
Communication |
Financing,
Insurance,
Real Estate
and Business
Services |
Community,
Social
and
Personal
Services |
Total
Services |
1 |
|
|
2 |
3 |
4 |
5 |
6 |
2000-01 |
|
|
0.4 |
1.6 |
0.5 |
0.7 |
3.2 |
2001-02 |
|
|
0.2 |
2.0 |
0.9 |
0.6 |
3.8 |
2002-03 |
|
|
0.5 |
2.2 |
1.1 |
0.6 |
4.3 |
2003-04 |
|
|
0.7 |
2.9 |
0.8 |
0.8 |
5.2 |
2004-05 |
|
|
1.0 |
2.7 |
1.2 |
1.0 |
5.8 |
2005-06 |
|
|
1.1 |
3.0 |
1.5 |
1.0 |
6.6 |
2006-07 |
|
|
0.8 |
3.1 |
1.9 |
1.0 |
6.8 |
2007-08 |
|
|
0.7 |
3.2 |
1.7 |
1.0 |
6.6 |
2006-07 |
: |
Q1 |
0.9 |
2.8 |
1.9 |
1.4 |
7.1 |
|
: |
Q2 |
0.9 |
3.4 |
2.0 |
1.1 |
7.4 |
|
: |
Q3 |
0.7 |
3.1 |
1.9 |
0.7 |
6.5 |
|
: |
Q4 |
0.8 |
3.1 |
1.8 |
0.7 |
6.5 |
2007-08 |
: |
Q1 |
0.6 |
3.4 |
1.8 |
0.7 |
6.5 |
|
: |
Q2 |
0.9 |
3.0 |
1.9 |
1.1 |
6.9 |
|
: |
Q3 |
0.5 |
3.0 |
1.6 |
0.8 |
5.9 |
|
: |
Q4 |
0.9 |
3.4 |
1.5 |
1.3 |
7.1 |
Source : Central Statistical Organisation |
The leading indicators of services sector activity for 2008-09 so far suggest acceleration in growth in respect of some indicators such as railway revenue earning freight traffic, tourist arrivals and export cargo handled by civil aviation during April-May 2008 as compared with April-May 2007. On the other hand, growth decelerated in respect of cargo handled at major ports, various indicators of civil aviation excluding export cargo and commercial vehicles production. Some deceleration was also observed in production of cement and steel during April-May 2008, which are among the important indicators of construction industry (Table 9).
Aggregate Demand The Indian economy continued to be driven by domestic demand with consumption accounting for more than two-thirds and investment little less than one-third of real GDP. During 2007-08, the share of final consumption expenditure declined to 67.8 per cent, while that of gross fixed capital formation rose to 31.9 per cent (Table 10). Savings and Investment
Gross Domestic Saving (GDS), as percentage of GDP at current market prices, increased to 34.8 per cent in 2006-07 from 34.3 per cent in 2005-06
Table 9: Indicators of Services Sector Activity |
(Growth rates in per cent) |
Sub-sector |
2006-07 |
2007-08 |
2007-08 |
2008-09 |
April-May |
1 |
|
2 |
3 |
4 |
5 |
1. |
Tourist arrivals |
13.0 |
11.3 |
8.2 * |
10.2 * |
2. |
Commercial vehicles production # |
11.2 |
-0.2 |
10.6 |
4.6 |
3. |
Railway revenue earning freight traffic |
5.1 |
10.9 |
6.2 |
10.2 |
4. |
New cell phone connections |
85.4 |
38.3 |
50.4 |
42.9 |
5. |
Cargo handled at major ports |
22.1 |
14.7 |
17.7 |
10.3 |
6. |
Civil aviation |
|
|
|
|
|
a) Export cargo handled |
3.6 |
7.5 |
1.6 |
7.6 |
|
b) Import cargo handled |
19.4 |
19.7 |
21.7 |
9.3 |
|
c) Passengers handled at international terminals |
12.1 |
11.9 |
13.1 |
9.0 |
|
d) Passengers handled at domestic terminals |
34.0 |
20.6 |
24.4 |
5.9 |
7. |
Cement ** |
5.8 |
6.9 |
7.8 |
5.4 |
8. |
Steel ** |
2.7 |
4.0 |
5.5 |
4.5 |
9. |
Aggregate deposits of SCBs |
23.8 |
22.4 |
4.1 @ |
3.5 @ |
10.Non-food credit of SCBs |
28.5 |
23.0 |
-0.7 @ |
1.7 @ |
* : April-June
# : Leading Indicator for transportation.
** : Leading indicators for construction.
@ : Up to July 4.
SCBs : Scheduled Commercial Banks.
Source : Ministry of Tourism; Ministry of Commerce and Industry;
Ministry of Statistics and Programme Implementation;
Reserve Bank of India; and Centre for Monitoring Indian Economy. |
Table 10: Expenditure Side of GDP (at 1999-2000 Prices) |
(Rates as per cent of GDP) |
Item |
2006-07* |
2007-08# |
2006-07 |
2007-08 |
Q1 |
Q2 |
Q3 |
Q4 |
Q1 |
Q2 |
Q3 |
Q4 |
1 |
|
2 |
3 |
4 |
5 |
6 |
7 |
8 |
9 |
10 |
11 |
1. |
Total Final Consumption |
|
|
|
|
|
|
|
|
|
|
|
Expenditure |
68.4 |
67.8 |
72.2 |
68.9 |
69.3 |
64.2 |
70.1 |
68.2 |
69.0 |
64.6 |
|
(i) Private Final |
|
|
|
|
|
|
|
|
|
|
|
Consumption Expenditure |
58.6 |
58.2 |
60.7 |
60.3 |
60.4 |
53.7 |
59.8 |
59.5 |
60.7 |
53.4 |
|
(ii) Government Final |
|
|
|
|
|
|
|
|
|
|
|
Consumption Expenditure |
9.8 |
9.6 |
11.5 |
8.6 |
8.9 |
10.5 |
10.3 |
8.7 |
8.3 |
11.2 |
2. |
Gross Fixed Capital |
|
|
|
|
|
|
|
|
|
|
|
Formation |
30.6 |
31.9 |
30.8 |
31.2 |
29.6 |
30.9 |
32.0 |
33.4 |
31.0 |
31.6 |
3. |
Change in Stocks |
2.1 |
2.0 |
2.1 |
2.2 |
2.0 |
2.0 |
2.1 |
2.1 |
1.9 |
1.9 |
4. |
Valuables |
1.2 |
1.3 |
1.3 |
1.3 |
1.2 |
1.1 |
1.2 |
1.3 |
1.4 |
1.1 |
5. |
Exports |
20.6 |
20.3 |
24.5 |
18.8 |
17.9 |
21.4 |
23.8 |
16.8 |
19.0 |
21.6 |
6. |
Less: Imports |
24.7 |
24.4 |
25.6 |
27.0 |
24.2 |
22.6 |
24.9 |
24.8 |
25.4 |
22.8 |
7. |
Discrepancies |
1.8 |
1.1 |
-5.3 |
4.6 |
4.3 |
3.0 |
-4.3 |
3.1 |
3.0 |
1.9 |
Memo: |
|
|
|
|
|
|
|
|
(Rupees crore) |
Real GDP at market prices |
31,17,372 |
33,98,767 |
7,04,841 |
7,22,355 |
8,25,401 |
8,64,774 |
7,69,871 |
7,88,514 |
8,99,098 |
9,41,283 |
* : Quick Estimates. # : Revised Estimates. Source : Central Statistical Organisation. |
mainly due to improvement in the saving performance by the private corporate and public sectors. On the other hand, the household saving rate declined marginally in 2006-07 from the previous year on account of decline in the financial saving rate (Table 11). The rate of gross domestic capital formation (GDCF) was estimated to be marginally higher at 35.9 per cent of GDP in 2006-07 than 35.5 per cent in 2005-06. During 2006-07, while the overall saving rate increased by 0.5 percentage point in 2006-07, the overall investment rate increased by 0.4 percentage point, reflecting a marginal narrowing down of current account deficit.
Corporate Performance
The performance of non-government non-financial companies moderated during 2007-08 relative to the previous year (Table 12). Sales growth, which slowed down in the first two quarters of the year, accelerated in the third and fourth quarters. On the whole, sales growth during 2007-08 at 18.5 per cent was lower than 26.2 per cent registered in the previous year. Growth in gross profits and net profits also decelerated during 2007-08. The gross profits to sales ratio, however, improved marginally over the same period. Growth in sales and net profits in the fourth quarter of 2007-08 were at 20.6 per cent and 14.1 per cent, respectively, as compared with 22.5 per cent and 39.6 per cent in the fourth quarter of 2006-07.
Table 11: Rates of Gross Domestic Saving and Investment |
(Per cent of GDP at current market prices) |
Item |
2001-02 |
2002-03 |
2003-04 |
2004-05 |
2005-06 PE |
2006-07 QE |
10th Plan
Average |
1 |
2 |
3 |
4 |
5 |
6 |
7 |
8 |
1. Household Saving |
22.1 |
23.2 |
24.4 |
23.0 |
24.2 |
23.8 |
23.7 |
of which : |
|
|
|
|
|
|
|
a) Financial assets |
10.9 |
10.3 |
11.4 |
10.1 |
11.8 |
11.3 |
11.0 |
b) Physical assets |
11.3 |
12.9 |
13.0 |
12.9 |
12.5 |
12.5 |
12.7 |
2. Private Corporate Saving |
3.4 |
3.9 |
4.4 |
6.6 |
7.5 |
7.8 |
6.0 |
3. Public Sector Saving |
-2.0 |
-0.6 |
1.1 |
2.2 |
2.6 |
3.2 |
1.7 |
4. Gross Domestic Saving |
23.5 |
26.4 |
29.8 |
31.8 |
34.3 |
34.8 |
31.4 |
5. Net capital inflow |
-0.6 |
-1.2 |
-1.6 |
0.4 |
1.2 |
1.1 |
0.0 |
6. Gross Domestic Capital Formation # |
22.8 |
25.2 |
28.2 |
32.2 |
35.5 |
35.9 |
31.4 |
7. Gross Capital Formation |
24.2 |
25.2 |
26.8 |
31.6 |
34.5 |
36.0 |
30.8 |
of which : |
|
|
|
|
|
|
|
a) Public sector |
6.9 |
6.1 |
6.3 |
6.9 |
7.6 |
7.8 |
6.9 |
b) Private corporate sector |
5.4 |
5.7 |
6.6 |
10.5 |
13.3 |
14.5 |
10.1 |
c) Household sector |
11.3 |
12.9 |
13.0 |
12.9 |
12.5 |
12.5 |
12.8 |
d) Valuables |
0.6 |
0.6 |
0.9 |
1.3 |
1.2 |
1.2 |
1.0 |
8. Total Consumption Expenditure (a+b) |
76.7 |
75.1 |
73.0 |
69.2 |
67.8 |
66.1 |
70.2 |
a) Private Final Consumption |
|
|
|
|
|
|
|
Expenditure |
64.4 |
63.2 |
61.7 |
58.4 |
57.4 |
55.8 |
59.3 |
b) Government Final Consumption |
|
|
|
|
|
|
|
Expenditure |
12.4 |
11.9 |
11.3 |
10.7 |
10.4 |
10.3 |
10.9 |
Memo: |
|
|
|
|
|
|
|
Saving-Investment Balance (4-6) |
0.7 |
1.2 |
1.6 |
-0.4 |
-1.2 |
-1.1 |
0.0 |
Public Sector Balance |
-8.9 |
-6.7 |
-5.3 |
-4.7 |
-5.0 |
-4.5 |
-5.3 |
Private Sector Balance |
8.8 |
8.5 |
9.2 |
6.1 |
5.9 |
4.5 |
6.8 |
a) Private Corporate Sector |
-2.1 |
-1.9 |
-2.2 |
-4.0 |
-5.8 |
-6.8 |
-4.1 |
b) Household Sector |
10.9 |
10.3 |
11.4 |
10.1 |
11.8 |
11.3 |
10.9 |
PE : Provisional Estimates. QE : Quick Estimates.
# : Adjusted for errors and omissions.
Note : Figures may not add up to the total due to rounding off.
Source : Central Statistical Organisation. |
Business Expectation Survey
According to the quarterly business expectations survey of the National Council of Applied Economic Research (NCAER) released in April 2008, the overall business confidence index (BCI) for the next six months declined both over the previous round and the previous year (Table 13). A component-wise analysis shows that three out of four components, viz., overall economic conditions, investment climate and financial position of firms declined over the previous round, while the capacity utilisation did not show any variation. The BCI in respect of consumer durables, services and intermediates sectors declined, while modest gains were observed in respect of capital goods and consumer non-durables.
Table 12: Corporate Financial Performance |
(Growth rates in per cent) |
Item |
2005-06 |
2006-07 |
2007-08P |
2006-07 |
2007-08 |
|
Q1 |
Q2 |
Q3 |
Q4 |
Q1 |
Q2 |
Q3 |
Q4 |
1 |
2 |
3 |
4 |
5 |
6 |
7 |
8 |
9 |
10 |
11 |
12 |
Sales |
16.3 |
26.2 |
18.5 |
25.6 |
29.2 |
30.3 |
22.5 |
19.2 |
16.0 |
18.0 |
20.6 |
Other Income |
17.3 |
7.1 |
47.0 |
21.6 |
15.5 |
9.2 |
0.4 |
106.7 |
45.2 |
70.2 |
28.5 |
Expenditure |
16.7 |
23.4 |
18.6 |
24.0 |
27.7 |
25.7 |
20.0 |
18.0 |
15.3 |
18.9 |
23.3 |
Depreciation |
8.1 |
15.4 |
14.8 |
14.9 |
16.4 |
16.8 |
18.1 |
18.1 |
15.8 |
17.9 |
15.4 |
Gross Profits |
24.6 |
41.9 |
23.3 |
32.7 |
46.0 |
52.9 |
35.5 |
31.9 |
22.5 |
20.4 |
16.8 |
Interest Payments |
-2.0 |
17.4 |
28.8 |
19.9 |
18.0 |
11.9 |
32.3 |
4.4 |
18.4 |
45.7 |
35.8 |
Profits After Tax |
32.8 |
45.2 |
27.0 |
34.7 |
49.4 |
59.5 |
39.6 |
33.9 |
22.7 |
29.4 |
14.1 |
|
Select Ratios |
(Per
cent) |
Gross Profits to Sales |
12.2 |
15.5 |
16.3 |
15.2 |
15.6 |
15.8 |
15.4 |
16.7 |
16.3 |
16.2 |
15.0 |
Profits After Tax to Sales |
8.2 |
10.7 |
11.8 |
10.6 |
11.0 |
11.0 |
10.6 |
11.6 |
11.5 |
12.2 |
10.3 |
Interest to Sales |
2.2 |
2.1 |
2.3 |
2.2 |
2.0 |
2.0 |
2.0 |
2.0 |
2.1 |
2.5 |
2.2 |
Interest to Gross Profits |
18.1 |
13.4 |
13.9 |
14.2 |
13.1 |
12.6 |
12.9 |
11.8 |
12.8 |
15.3 |
14.6 |
Interest Coverage (Times) |
5.5 |
7.5 |
7.2 |
7.0 |
7.6 |
7.9 |
7.7 |
8.5 |
7.8 |
6.5 |
6.8 |
Memo: |
(Amount in Rupees crore) |
No of Companies |
2,730 |
2,388 |
2,219 |
2,228 |
2,263 |
2,258 |
2,356 |
2,342 |
2,228 |
2,329 |
2,357 |
Sales |
7,35,216 |
10,41,894 |
10,88,203 |
2,34,610 |
2,51,125 |
2,60,064 |
2,94,223 |
2,80,814 |
2,97,110 |
3,06,238 |
3,50,917 |
Other Income * |
17,088 |
23,895 |
28,798 |
4,304 |
5,282 |
4,927 |
8,466 |
9,151 |
8,057 |
9,221 |
10,082 |
Expenditure # |
6,43,826 |
8,78,645 |
9,12,834 |
2,00,120 |
2,11,043 |
2,17,472 |
2,49,133 |
2,37,698 |
2,49,194 |
2,57,472 |
3,02,105 |
Depreciation |
28,961 |
37,095 |
38,528 |
8,449 |
8,892 |
9,172 |
10,338 |
10,173 |
10,576 |
10,961 |
11,805 |
Gross Profits |
90,179 |
1,61,006 |
1,76,845 |
35,761 |
39,055 |
40,995 |
45,424 |
46,780 |
48,296 |
49,717 |
52,583 |
Interest Payments |
16,302 |
21,500 |
24,551 |
5,083 |
5,121 |
5,162 |
5,862 |
5,504 |
6,194 |
7,609 |
7,703 |
Profits After Tax |
60,236 |
1,11,107 |
1,27,968 |
24,845 |
27,710 |
28,698 |
31,251 |
32,699 |
34,266 |
37,470 |
36,109 |
P : Provisional; data pertain to 2,219 companies available so far.
* : Other income excludes extraordinary income/expenditure if reported explicitly.
# : The increase or decrease in stock in trade is accounted under total income instead of total expenditure as was hitherto done.
Notes : 1. Data for 2005-06 are based on audited annual accounts, while those for 2006-07 and 2007-08 are based on abridged financial results of the select non-Government non-financial public limited companies.
2. Growth rates are percentage changes in the level for the period under reference over the corresponding period of the previous year for common set of companies.
3. The quarterly data may not add up to annual data due to differences in the number and composition of companies covered in each
period. |
The CII business confidence index (CII-BCI) for April-September 2008 declined by 5.3 per cent as compared with the past six months and 2.9 per cent as compared with the corresponding period a year ago (Table 13). The decline was on account of uncertain global economic outlook and concerns about high interest rates. The composite business optimism index for July-September 2008 compiled by Dun and Bradstreet (D&B) declined by 11.2 per cent as compared with the previous quarter and by 18.0 per cent as compared with the previous year. All the six optimism indices - volumes of sales, net profits, selling prices, new orders, inventory levels and employee levels declined as compared with the previous quarter. Optimism was particularly low among respondents in the consumer durables and basic goods sectors.
Table 13: Business Expectations Surveys |
(Per cent) |
Organisation |
Business
Expectations |
Growth over a
year ago |
Growth over
previous round |
Period |
Index |
|
|
1 |
2 |
3 |
4 |
5 |
NCAER |
April-September 2008 |
Business Confidence Index |
-1.7 |
-3.4 |
CII |
April-September 2008 |
Business Confidence Index |
-2.9 |
-5.3 |
Reserve Bank of India |
July-September 2008 |
Business Expectations Index |
0.8 |
-0.9 |
Dun & Bradstreet |
July-September 2008 |
Business Optimism Index |
-18.0 |
-11.2 |
According to the Reserve Bank’s Industrial Outlook Survey of manufacturing companies in the private sector for April-June 2008, the business expectations indices based on assessment for April-June 2008 and on expectations for July-September 2008 declined by 5.4 per cent and 0.9 per cent, respectively, over the corresponding previous quarters. The indices, however, increased by 0.3 per cent and 0.8 per cent, respectively, over the corresponding quarters of the previous year (Chart 4).
The decline in expectations index for July-September 2008 over the previous quarter was due to lower net responses for major parameters of the survey such as overall business situation, overall financial situation, production, order books, cost of raw materials, capacity utilisation, employment, imports and profit margins than in the previous quarter (Table 14). Most of the corporates expect increase in raw material prices and the increased production cost is expected to be adjusted by keeping inventory levels (both raw material and finished goods) at ‘below average’ and by increasing selling prices. 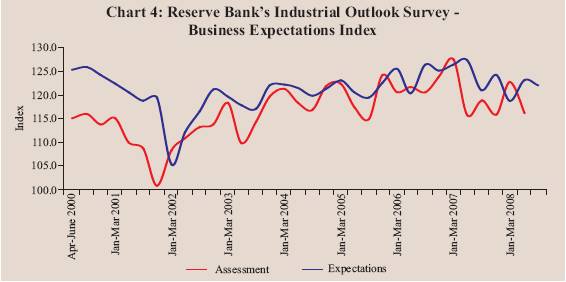
Table 14: Reserve Bank’s Industrial Outlook Survey - Net Response on
'A Quarter Ahead' Expectations About the Industrial Performance |
(Per cent) |
Parameter |
Response |
Apr-June
2007 |
July-Sept
2007 |
Oct-Dec
2007 |
Jan-Mar
2008 |
April-June
2008 |
July-Sept
2008 |
|
1 |
2 |
3 |
4 |
5 |
6 |
7 |
8 |
1. |
Overall business situation |
Better |
51.7 |
49.5 |
50.2 |
47.7 |
46.0 |
41.8 |
|
|
|
(43.3) |
(41.2) |
(42.1) |
(42.9) |
(42.7) |
(42.6) |
2. |
Financial situation |
Better |
43.8 |
41.3 |
40.1 |
40.3 |
36.6 |
32.7 |
|
|
|
(49.8) |
(49.8) |
(51.3) |
(50.3) |
(51.6) |
(53.0) |
3. |
Working capital finance requirement |
Increase |
35.3 |
34.5 |
32.2 |
34.7 |
36.6 |
33.6 |
|
|
|
(59.2) |
(59.2) |
(62.6) |
(60.3) |
(56.5) |
(57.3) |
4. |
Availability of finance |
Improve |
35.2 |
32.1 |
33.8 |
31.1 |
32.3 |
30.2 |
|
|
|
(57.2) |
(58.6) |
(58.8) |
(59.5) |
(58.3) |
(57.9) |
5. |
Production |
Increase |
47.8 |
46.6 |
49.0 |
43.9 |
45.2 |
43.5 |
|
|
|
(41.6) |
(41.1) |
(40.9) |
(42.3) |
(41.0) |
(36.6) |
6. |
Order books |
Increase |
45.7 |
43.6 |
44.1 |
37.1 |
41.5 |
38.5 |
|
|
|
(45.4) |
(46.1) |
(46.0) |
(48.6) |
(44.3) |
(43.5) |
7. |
Pending orders, if applicable |
Below normal |
-2.2 |
-2.2 |
-3.5 |
0.4 |
-4.3 |
2.2 |
|
|
|
(82.8) |
(82.6) |
(82.4) |
(80.2) |
(81.3) |
(80.9) |
8. |
Cost of raw material |
Decrease |
-42.1 |
-46.0 |
-42.4 |
-44.1 |
-48.2 |
-54.7 |
|
|
|
(52.0) |
(49.7) |
(51.0) |
(49.2) |
(46.0) |
(39.1) |
9. |
Inventory of raw material |
Below average |
-7.3 |
-5.4 |
-6.3 |
-7.3 |
-7.0 |
-3.8 |
|
|
|
(85.0) |
(85.0) |
(85.0) |
(84.8) |
(83.2) |
(81.8) |
10. |
Inventory of finished goods |
Below average |
-4.4 |
-2.7 |
-3.5 |
-4.5 |
-5.8 |
-1.5 |
|
|
|
(85.2) |
(87.1) |
(86.4) |
(86.1) |
(84.5) |
(84.5) |
11. |
Capacity utilisation (Main product) |
Increase |
29.4 |
27.0 |
28.4 |
24.2 |
25.6 |
22.2 |
|
|
|
(60.4) |
(61.4) |
(61.5) |
(62.3) |
(59.9) |
(58.8) |
12. |
Level of capacity
utilisation |
Above normal |
11.5 |
9.4 |
10.7 |
6.4 |
9.4 |
3.6 |
|
(Compared to the average in the |
|
(77.1) |
(76.5) |
(77.2) |
(78.3) |
(77.0) |
(74.9) |
|
preceding four quarters) |
|
|
|
|
|
|
|
13. |
Assessment of the production capacity |
More than |
4.0 |
3.0 |
4.2 |
4.7 |
8.0 |
4.6 |
|
(With regard to expected demand in the |
adequate |
(82.2) |
(82.2) |
(83.0) |
(83.8) |
(81.2) |
(81.3) |
|
next six months) |
|
|
|
|
|
|
|
14. |
Employment in the company |
Increase |
18.3 |
17.4 |
16.7 |
14.6 |
20.8 |
15.8 |
|
|
|
(73.3) |
(73.5) |
(74.1) |
(75.6) |
(68.2) |
(71.5) |
15. |
Exports, if applicable |
Increase |
33.4 |
32.6 |
31.4 |
24.3 |
27.7 |
27.7 |
|
|
|
(56.8) |
(55.6) |
(55.9) |
(58.3) |
(53.3) |
(54.9) |
16. |
Imports, if any |
Increase |
21.6 |
23.7 |
20.8 |
20.1 |
25.3 |
21.3 |
|
|
|
(68.4) |
(68.2) |
(68.6) |
(70.5) |
(65.6) |
(66.5) |
17. |
Selling prices are expected to |
Increase |
15.5 |
19.0 |
13.0 |
14.9 |
19.1 |
21.0 |
|
|
|
(68.9) |
(67.1) |
(68.5) |
(67.1) |
(66.0) |
(61.5) |
18. |
If increase expected in selling prices |
Increase at |
12.1 |
10.4 |
3.7 |
13.3 |
9.0 |
3.0 |
|
|
lower rate |
(66.7) |
(65.0) |
(58.9) |
(66.7) |
(64.0) |
(61.3) |
19. |
Profit margin |
Increase |
9.9 |
7.5 |
9.6 |
5.4 |
7.2 |
3.8 |
|
|
|
(62.5) |
(62.6) |
(59.6) |
(60.0) |
(61.0) |
(59.8) |
Notes :
1. 'Net response' is measured as the percentage share differential between the companies reporting 'optimistic'
(positive) and 'pessimistic' (negative) responses; responses indicating status quo (no change) are not reckoned.
Higher 'net response' indicates higher level of confidence and vice versa.
2. Figures in parentheses are the percentages of respondents with 'no change over the preceding quarter' as
responses. |
The recent projections for growth rate of industrial production in 2008-09 by the Centre for Monitoring Indian Economy (CMIE) present an optimistic view in the light of large capital investments scheduled for commissioning during the year. The CMIE expects the industrial growth to accelerate from the estimated 8.5 per cent in 2007-08 to 11.4 per cent in 2008-09. Growth rates in the manufacturing, mining and electricity sectors are projected at 10.8 per cent, 8.0 per cent and 6.3 per cent, respectively. As per CMIE, the industrial rebound is expected to be well spread across all the sectors and would be fuelled by robust growth in capital goods in the wake of large capital goods imports and investments, healthy order-book position and a pick-up in the growth of consumer goods.
The ABN-AMRO Purchasing Managers' Index (PMI)1 for June 2008 rose to its highest reading in four months at 58.6 (57.4 in May 2008), supported by increase in the rate of growth of both output and new orders, indicating strong growth in the manufacturing sector. Manufacturing firms attributed higher new order levels to improvement in market conditions and robust underlying demand. However, on the down side, input price inflation accelerated to its sharpest for nineteen months in June, on account of higher raw material costs.
Survey of Professional Forecasters2
The results of professional forecasters' survey conducted by the Reserve Bank in June 2008 suggested moderation in economic activity for each of the three forthcoming quarters and for 2008-09 on the whole (Table 15). Between the third round of survey conducted in March 2008 and fourth round survey in June 2008 forecast of real GDP growth for 2008-09 was revised downward to 7.9 per cent from 8.1 per cent. The sectoral growth rate forecasts for industry and services sector were also revised downwards. On the other hand,
Table 15: Median Forecasts of Select Macroeconomic Indicators by
Professional Forecasters 2008-09 |
Indicators |
Actual 2007-08 |
2008-09 |
Annual |
Q1 |
Q2 |
Q3 |
Q4 |
|
E |
L |
E |
L |
E |
L |
E |
L |
L |
1 |
|
2 |
3 |
4 |
5 |
6 |
7 |
8 |
9 |
10 |
11 |
1 |
Real GDP growth rate at |
|
|
|
|
|
|
|
|
|
|
|
factor cost (in per cent) |
9.0 |
8.1 |
7.9 |
8.1 |
8.0 |
8.3 |
7.7 |
8.1 |
7.6 |
7.5 |
|
a. Agriculture & Allied |
|
|
|
|
|
|
|
|
|
|
|
Activities |
4.5 |
3.0 |
3.0 |
3.0 |
3.1 |
3.0 |
3.4 |
2.9 |
3.1 |
3.8 |
|
b. Industry |
8.1 |
8.1 |
7.5 |
8.4 |
7.1 |
8.5 |
7.0 |
8.6 |
7.4 |
7.3 |
|
c. Services |
10.7 |
9.7 |
9.5 |
10.0 |
9.9 |
9.6 |
9.6 |
9.8 |
9.6 |
9.5 |
2 |
Gross Domestic Saving |
34.8 * |
35.0 |
35.0 |
- |
- |
- |
- |
- |
- |
- |
|
(per cent of GDP |
|
|
|
|
|
|
|
|
|
|
|
at current market prices) |
|
|
|
|
|
|
|
|
|
|
3 |
Gross Domestic Capital |
|
|
|
|
|
|
|
|
|
|
|
Formation |
35.9 * |
36.0 |
36.3 |
36.2 |
36.6 |
36.0 |
36.0 |
36.0 |
35.8 |
36.1 |
|
(per cent of GDP at |
|
|
|
|
|
|
|
|
|
|
|
current market prices) |
|
|
|
|
|
|
|
|
|
|
4 |
Corporate profit after tax |
27.0 |
24.7 |
16.0 |
21.3 |
20.3 |
22.6 |
17.4 |
23.1 |
16.0 |
19.5 |
|
(growth rate in per cent) |
|
|
|
|
|
|
|
|
|
|
5 |
91-day Treasury Bill Yield |
7.2 |
6.8 |
8.2 |
- |
- |
- |
- |
- |
- |
- |
|
(per cent-end period) |
|
|
|
|
|
|
|
|
|
|
| 6 |
10-year Government Securities |
|
|
|
|
|
|
|
|
|
|
|
Yield |
7.9 |
7.8 |
8.8 |
- |
- |
- |
- |
- |
- |
- |
|
(per cent-end period) |
|
|
|
|
|
|
|
|
|
|
7 |
Export |
23.7 |
15.8 |
20.0 |
- |
- |
- |
- |
- |
- |
- |
|
(growth rate in per cent) |
|
|
|
|
|
|
|
|
|
|
8 |
Import |
29.9 |
20.0 |
29.5 |
- |
- |
- |
- |
- |
- |
- |
|
(Growth rate in per cent) |
|
|
|
|
|
|
|
|
|
|
9 |
Trade Balance |
-90.1 |
-115.5 |
-126.2 |
-28.4 |
-31.1 |
-27.5 |
-32.1 |
-28.1 |
-31.1 |
-29.0 |
|
(US $ billion) |
|
|
|
|
|
|
|
|
|
|
E : Earlier Projection. L : Latest Projection. * : Pertains to 2006-07.
- : Not Available.
Note : The latest round refers to the fourth round for the quarter ended June 2008,
while earlier round refers to third round for the quarter ended March 2008.
Source : Survey of Professional Forecasters, First Quarter 2008-09. |
growth rates in export and import were revised upwards to 20 per cent and 30 per cent, respectively. The trade deficit is expected to increase in 2008-09.
Forecasts by various agencies for real GDP growth in 2008-09 are set out in Table 16.
Table 16: Projections of Real GDP for India by Various Agencies - 2008-09 |
(per cent) |
Agency |
Overall Growth |
Agriculture |
Industry |
Services |
Month of
Projection |
1 |
2 |
3 |
4 |
5 |
6 |
ASSOCHAM # |
7.9 |
2.6 |
7.6 |
9.7 |
Apr-08 |
Confederation of Indian Industries (CII) |
8.0 -8.5 |
- |
- |
- |
Mar-08 |
Citigroup |
7.7 |
3.0 |
7.5 |
9.2 |
Mar-08 |
|
8.3 |
- |
- |
- |
Feb-08 |
Merrill Lynch |
7.9 |
2.5 |
7.4 |
9.6 |
June-08 |
|
8.2 |
3.0 |
7.6 |
9.9 |
Mar-08 |
JP Morgan |
7.0 |
- |
- |
- |
Mar-08 |
|
7.5 |
- |
- |
- |
Dec-07 |
Centre for Monitoring Indian Economy (CMIE) |
9.5 |
3.2 |
11.4 |
10.6 |
July-08 |
|
9.1 |
- |
- |
- |
Feb-08 |
NCAER @ |
8.5-8.8 |
2.5 |
8.9-9.4 |
10.2-10.5 |
May-08 |
Standard & Poor’s, CRISIL |
7.8 |
3.0 |
7.5 |
9.5 |
June-08 |
|
8.1 |
3.0 |
8.3 |
10.3 |
Apr-08 |
|
8.5 |
- |
- |
- |
Feb-08 |
Asian Development Bank |
8.0 |
- |
- |
- |
Apr-08 |
|
8.5 |
- |
- |
- |
Sep-07 |
International Monetary Fund * |
8.0 |
- |
- |
- |
July-08 |
|
7.9 |
- |
- |
- |
Apr-08 |
|
8.4 |
- |
- |
- |
Oct-07 |
United Nations Organisation |
8.2 |
- |
- |
- |
Jan-08 |
Economic Advisory
Council to Prime Minister |
8.5 |
- |
- |
- |
Jan-08 |
Reserve Bank of India |
8.0-8.5 |
- |
- |
- |
Apr-08 |
- : Not Available. : Calendar year. : The Associated Chambers of Commerce and Industry of India.
@ : National Council of Applied Economic Research. |
1 The PMI is a composite indicator designed to provide an overall view of activity in the manufacturing sector. A PMI of 50.0 indicates no change while values above or below this level indicate an expansion or a contraction of manufacturing activity.2 Introduced by the Reserve Bank from the quarter ended September 2007. The forecasts made in the section are that of professional forecasters and not that of the Reserve Bank. |


