Provisional data on India's merchandise trade for April-January, 2007-08 and commodity-wise details for April-November, 2007 have been furnished by the Directorate General of Commercial Intelligence and Statistics (DGCI & S). On the basis of these data, this review has been prepared. HIGHLIGHTS
- Merchandise exports recorded a growth of 20.5 per cent during January 2008, marginally higher than the growth in January 2007 (19.0 per cent). The overall exports during April-January, 2007-08, at US $ 124.1 billion were higher by 21.5 per cent, a modest deceleration from a year ago (24.0 per cent).
- Imports during January 2008 showed sharp increase of 63.6 per cent, as compared with 6.7 per cent a year ago. Imports during April-January, 2007-08 at US $ 191.5 billion were higher by 29.5 per cent than a year ago (25.4 per cent).
- Petroleum, oil and lubricants (POL) imports during April-January 2007-08 decelerated to 19.4 per cent (33.7 per cent). Non-oil imports sharply accelerated to 34.3 per cent (21.9 per cent a year ago) and contributed 79 per cent of the growth in overall imports.
- The average price of Indian basket of crude oil during April-January, 2007-08 was US $ 76.2 per barrel (ranging between US $ 65.5 and US $ 89.5 per barrel), higher by 20.4 per cent than the price during previous year.
- Trade deficit during April-January, 2007-08 touched US $ 67.4 billion and was higher by US $ 21.6 billion than a year ago (US $ 45.7 billion).
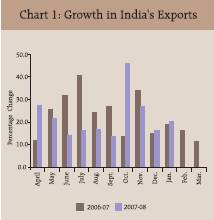
Exports India's merchandise exports during January 2008 at US $ 13.1 billion, were higher by 20.5 per cent than 19.0 per cent during January 2007 (Chart 1, Statement 1). The overall exports during April-January, 2007-08 at US $ 124.1 billion (21.5 per cent) showed some moderation in growth from that during the corresponding period of the previous year (24.0 per cent). The exports during the first ten months of the current financial year (April-January, 2007-08) constituted 78 per cent of the target fixed by the Ministry of Commerce and Industry, Government of India (US $ 160 billion) as compared with 82 per cent a year ago (US $ 125 billion) (Table 1, Statement 2). Commodity-wise exports data available for April-November, 2007 exhibited deceleration in most of the principal product groups, except agricultural and allied products, and gems and jewellery. Agricultural and allied products, engineering goods, gems and jewellery and petroleum products were the drivers of export growth as these products together contributed to about 70 per cent of export growth during April-November, 2007-08 (Chart 2).
Table 1: India's Merchandise Trade : |
April-January |
(US $ million) |
Item |
2006-07 R |
2007-08P |
Exports |
1,02,138 |
1,24,086 |
|
(24.0) |
(21.5) |
Oil exports* |
12,828 |
17,370 |
|
(79.4) |
(35.4) |
Non-Oil exports* |
67,932 |
83,144 |
|
(19.7) |
(22.4) |
Imports |
1,47,867 |
1,91,453 |
|
(25.4) |
(29.5) |
Oil Imports |
47,657 |
56,892 |
|
(33.7) |
(19.4) |
Non-Oil Imports |
1,00,210 |
1,34,560 |
|
(21.9) |
(34.3) |
Trade Balance |
-45,729 |
-67,366 |
Note * Figures pertain to April-November.
Figures in parentheses show percentage change over the previous year.
P : Provisional;
R: Revised.
Source : DGCI & S. |
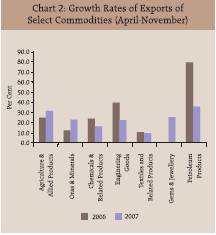
Exports of primary products during April-November, 2007 showed accelerated growth of 28.3 per cent due to pick up in the exports of agricultural and allied products (31.3 per cent ) and iron ore (29.6 per cent). Within agricultural and allied products, exports of rice, tobacco, spices, oil meal and marine products accelerated, while that of tea, coffee and cashew declined.
Manufactured products, in general, showed moderation in export growth due to deceleration in principal components, such as engineering goods, textiles and textile products and chemicals and related products, while gems and jewellery showed accelerated growth. Engineering goods, the main-stay of manufactured exports, moderated to 22.4 per cent from 39.6 per cent on the back of deceleration in machinery and instruments, iron and steel and electronic goods, even while transport equipments and manufactures of metals recorded accelerated growth. Exports of transport equipments registered a sharp increase (41.2 per cent against 9.7 per cent a year ago). Exports of transport equipments and manufactures of metals to main markets, such as, the US, the UAE and the UK showed increase during April-November, 2007-08. Chemicals and related products sharply moderated from 23.8 per cent to 16.4 per cent due to decline in plastic and linoleum and deceleration in basic chemicals, pharmaceuticals and cosmetics. Textiles and textile products maintained a modest growth (9.5 per cent as compared with 10.6 per cent a year ago). The main components of exports were cotton yarn, fabrics, made-ups, man-made yarn, fabrics, made-ups and readymade garments. Gems and jewellery recorded a sharp acceleration in export growth during April-November, 2007-08 (25.5 per cent as against 0.4 per cent a year back). Exports to principal markets like Hong Kong, the UAE and Belgium showed pick up. Exports of petroleum products recorded 35.4 per cent growth during April-November, 2007-08 (79.4 per cent a year ago). The UAE, Singapore and Netherlands were the main markets for petroleum products.
Destination-wise, the US continued to be the single largest market for India, with a share of 13.6 per cent in the overall exports (15.4 per cent a year ago). The other major destinations were the UAE (10.1 per cent), China (5.9 per cent), the UK (4.4 per cent ), Singapore (4.4 per cent), Hong Kong (3.9 per cent) and Germany (3.2 per cent). Region-wise, exports to the EU, Eastern Europe and Asian developing countries accelerated, while exports to North America, Asia and Oceania, OPEC, and African developing countries moderated. Imports India's merchandise imports during January 2008 (US $ 22.5 billion) registered a growth of 63.6 per cent (6.7 per cent in January 2007), the highest growth rate recorded during 2007-08 so far (Chart 3). The overall imports during April-January, 2007-08 at US $ 191.5 billion were higher by 29.5 per cent than a year ago (US $ 147.9 billion). While petroleum, oil and lubricants (POL) imports showed moderation, non-oil imports continued to show accelerated growth. Imports of POL during April-January, 2007-08 at US $ 56.9 billion were higher by 19.4 per cent (33.7 per cent a year ago). The quantity of oil imports during April-November, 2007-08 showed moderation in growth at 7.9 per cent as compared with 22.6 per cent a year ago. The average price of Indian basket of crude oil during April-January, 2007-08 stood at US $ 76.2 per barrel, an increase of 20.4 per cent over the price a year ago (US $ 63.2 per barrel) [Table 2]. Non-oil imports during April-January, 2007-08 were higher by 34.3 per cent than 21.9 per cent a year ago. Capital goods and gold and silver together contributed 49 per cent of the growth in non-oil imports (Chart 4 and Statement 5). During April-November, 2007, capital goods imports increased by 32.7 per cent (38.5 per cent), while gold and silver grew by 40.3 per cent (21.3 per cent). The other major non-oil products which showed accelerated growth in imports during the period were coal, coke and briquettes; pearls, precious and semi-precious stones; chemicals; and iron and steel. 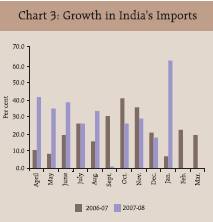
Table 2: Trends in Crude Oil Prices |
(US $/barrel) |
|
Dubai |
UK |
US- |
Indian |
|
|
Brent |
WTI |
basket* |
1995-96 |
16.2 |
17.5 |
18.8 |
16.7 |
2000-01 |
25.9 |
28.1 |
30.3 |
26.8 |
2001-02 |
21.8 |
23.2 |
24.1 |
22.4 |
2002-03 |
25.9 |
27.6 |
29.2 |
26.6 |
2003-04 |
26.9 |
29.0 |
31.4 |
27.8 |
2004-05 |
36.4 |
42.2 |
45.0 |
39.2 |
2005-06 |
53.4 |
58.0 |
59.9 |
55.7 |
2006-07 |
60.9 |
64.4 |
64.7 |
62.4 |
2006-07 |
|
|
|
|
(April-Jan.) |
61.6 |
65.3 |
65.0 |
63.2 |
2007-08 |
|
|
|
|
(April-Jan.) |
74.1 |
79.0 |
78.6 |
76.2 |
Jan. 2007 |
52.0 |
54.3 |
67.5 |
52.6 |
Jan. 2008 |
87.2 |
91.9 |
93.0 |
89.5 |
Note:* The composition of Indian Basket represents average of Oman and Dubai for sour grades and Brent (dated) for sweet grade in the ratio of 61.4:38.6 for 2007-08.
Sources:
(1) International Monetary Fund, International Financial Statistics, World Bank's Commodity Price Pink sheet February 2007,
(2) Ministry of Petroleum and Natural Gas, Government of India. |
Source-wise, China was the principal source of imports, accounting for 11.6 per cent of total imports during April-November, 2007. The other major sources were Saudi Arabia (7.4 per cent), the US (5.9 per cent), the UAE (5.5 per cent), Switzerland (4.8 per cent), Iran (4.4 per cent), Germany (4.0 per cent) and Australia (3.6 per cent) [Statement 6]. 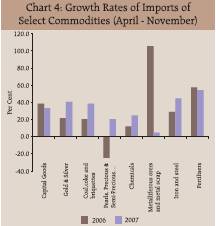
Trade Deficit The trade deficit during April-January, 2007-08 amounted to US $ 67.4 billion, higher by US $ 21.6 billion than a year ago (US $ 45.7 billion). The trade deficit on oil account during April-November, 2007 stood at US $ 30.1 billion, higher by US $ 3.5 billion than a year ago (US $ 26.6 billion). Global Trade According to the IMF, International Financial Statistics, world exports during January-December, 2007 increased by 15.0 per cent, almost maintaining the growth recorded a year ago (15.3 per cent) [Table 3]. Exports from the industrialized countries registered a higher growth at 13.6 per cent (12.4 per cent a year ago). Developing countries showed a moderation in growth during January-December, 2007 (16.8 per cent as against 19.1 per cent) with countries like China, Singapore and Malaysia showing deceleration in export growth.
Table 3: Global Merchandise Trade Growth |
(Per Cent) |
Country/
Region |
Exports
(January-
December) |
Imports
(January-
December) |
|
2006 |
2007 |
2006 |
2007 |
World |
15.3 |
15.0 |
15.0 |
14.5 |
Industrial |
|
|
|
|
Countries |
12.4 |
13.6 |
13.0 |
11.7 |
USA |
14.7 |
12.2 |
10.8 |
5.1 |
EU |
10.5 |
6.5 |
14.8 |
5.0 |
Japan |
9.2 |
9.2 |
12.3 |
8.2 |
France |
9.9 |
12.0 |
10.6 |
14.5 |
Germany |
14.7 |
18.5 |
10.2 |
15.9 |
Switzerland |
12.4 |
16.2 |
18.2 |
14.8 |
Developing |
|
|
|
|
Countries |
19.1 |
16.8 |
18.1 |
18.6 |
China |
27.2 |
25.6 |
19.9 |
20.8 |
Singapore |
18.4 |
10.1 |
19.3 |
10.2 |
Korea |
14.4 |
14.2 |
15.6 |
15.3 |
Hong Kong |
9.4 |
8.8 |
11.6 |
10.0 |
Malaysia |
14.0 |
9.6 |
14.4 |
12.0 |
Sources :
(1) International Financial Statistics, International Monetary fund,
(2) Eurostat |
Statement 1 : India's Foreign Trade - January 2008 |
Year |
Export |
Import |
|
Trade Balance |
|
Total |
Oil |
Non-Oil |
Total |
Oil |
Non-Oil |
Total |
Oil |
Non-Oil |
1 |
2 |
3 |
4 |
5 |
6 |
7 |
8 |
9 |
10 |
Rupees crore |
2005-06 |
40,703 |
5,544 |
35,159 |
57,245 |
18,502 |
38,743 |
-16,542 |
-12,958 |
-3,584 |
|
(13.5) |
(76.3) |
(7.5) |
(18.8) |
(61.2) |
(5.6) |
|
|
|
2006-07 R |
48,357 |
6,334 |
42,022 |
60,992 |
16,659 |
44,333 |
-12,636 |
-10,325 |
-2,311 |
|
(18.8) |
(14.3) |
(19.5) |
(6.5) |
(-10.0) |
(14.4) |
|
|
|
2007-08 P |
51,740 |
.. |
.. |
88,608 |
30,364 |
58,244 |
-36,868 |
|
|
|
(7.0) |
|
|
(45.3) |
(82.3) |
(31.4) |
|
|
|
US dollar million |
2005-06 |
9,168 |
1,249 |
7,919 |
12,894 |
4,167 |
8,727 |
-3,726 |
-2,919 |
-807 |
|
(11.9) |
(73.7) |
(5.9) |
(17.1) |
(58.9) |
(4.1) |
|
|
|
2006-07 R |
10,908 |
1,429 |
9,479 |
13,758 |
3,758 |
10,000 |
-2,850 |
-2,329 |
-521 |
|
(19.0) |
(14.4) |
(19.7) |
(6.7) |
(-9.8) |
(14.6) |
|
|
|
2007-08 P |
13,141 |
.. |
.. |
22,504 |
7,712 |
14,793 |
-9,364 |
|
|
|
(20.5) |
|
|
(63.6) |
(105.2) |
(47.9) |
|
|
|
SDR million |
2005-06 |
6,338 |
863 |
5,474 |
8,913 |
2,881 |
6,032 |
-2,576 |
-2,018 |
-558 |
|
(17.9) |
(83.2) |
(11.7) |
(23.5) |
(67.5) |
(9.7) |
|
|
|
2006-07 R |
7,294 |
955 |
6,338 |
9,200 |
2,513 |
6,687 |
-1,906 |
-1,557 |
-349 |
|
(15.1) |
(10.7) |
(15.8) |
(3.2) |
(-12.8) |
(10.8) |
|
|
|
2007-08 P |
8,296 |
.. |
.. |
14,208 |
4,869 |
9,339 |
-5,912 |
|
|
|
(13.7) |
|
|
(54.4) |
(93.8) |
(39.7) |
|
|
|
P : Provisional. R : Revised. .. : Not available.
Note : Figures in brackets relate to percentage variation over the corresponding previous period.
Source : DGCI & S. |
Statement 2 : India's Foreign Trade |
Year |
Exports |
Imports |
Trade Balance |
|
Total |
Oil |
Non-Oil |
Total |
Oil |
Non-Oil |
Total |
Oil |
Non-Oil |
1 |
2 |
3 |
4 |
5 |
6 |
7 |
8 |
9 |
10 |
April-March |
Rupees crore |
2004-05 |
375,340 |
31,404 |
343,935 |
501,065 |
134,094 |
366,971 |
-125,725 |
-102,690 |
-23,035 |
|
(27.9) |
(91.5) |
(24.2) |
(39.5) |
(41.9) |
(38.7) |
|
|
|
2005-06 R |
456,418 |
51,533 |
404,885 |
660,409 |
194,640 |
465,769 |
-203,991 |
-143,107 |
-60,884 |
|
(21.6) |
(64.1) |
|
(17.7) |
(31.8) |
(45.2) |
(26.9) |
|
|
|
2006-07 P |
571,779 |
84,520 |
487,259 |
840,506 |
258,572 |
581,935 |
-268,727 |
-174,052 |
-94,675 |
|
(25.3) |
(64.0) |
(20.3) |
(27.3) |
(32.8) |
(24.9) |
|
|
|
US dollar million |
2004-05 |
83,536 |
6,989 |
76,547 |
111,517 |
29,844 |
81,673 |
-27,981 |
-22,855 |
-5,127 |
|
(30.8) |
(95.9) |
(27.0) |
(42.7) |
(45.1) |
(41.8) |
|
|
|
2005-06 R |
103,091 |
11,640 |
91,451 |
149,166 |
43,963 |
105,203 |
-46,075 |
-32,323 |
-13,752 |
|
(23.4) |
(66.5) |
(19.5) |
(33.8) |
(47.3) |
(28.8) |
|
|
|
2006-07 P |
126,361 |
18,679 |
107,683 |
185,749 |
57,144 |
128,606 |
-59,388 |
-38,465 |
-20,923 |
|
(22.6) |
(60.5) |
(17.7) |
(24.5) |
(30.0) |
(22.2) |
|
|
|
SDR million |
2004-05 |
56,081 |
4,692 |
51,389 |
74,866 |
20,036 |
54,830 |
-18,785 |
-15,343 |
-3,442 |
|
(25.6) |
(88.0) |
(21.9) |
(36.9) |
(39.2) |
(36.1) |
|
|
|
2005-06 R |
70,774 |
7,991 |
62,783 |
102,405 |
30,182 |
72,224 |
-31,632 |
-22,191 |
-9,441 |
|
(26.2) |
(70.3) |
(22.2) |
(36.8) |
(50.6) |
(31.7) |
|
|
|
2006-07 P |
85,018 |
12,567 |
72,451 |
124,975 |
38,447 |
86,528 |
-39,957 |
-25,880 |
-14,077 |
|
(20.1) |
(57.3) |
(15.4) |
(22.0) |
(27.4) |
(19.8) |
|
|
|
April-January |
Rupees crore |
2005-06 |
364,578 |
41,822 |
322,756 |
521,551 |
157,726 |
363,825 |
-156,972 |
-115,904 |
-41,069 |
|
(25.1) |
(63.3) |
(21.4) |
(32.3) |
(45.2) |
(27.4) |
|
|
|
2006-07 R |
464,532 |
71,663 |
392,870 |
672,514 |
216,749 |
455,765 |
-207,982 |
-145,087 |
-62,895 |
|
(27.4) |
(71.3) |
(21.7) |
(28.9) |
(37.4) |
(25.3) |
|
|
|
2007-08 P |
500,117 |
.. |
.. |
771,629 |
229,298 |
542,331 |
-271,512 |
|
|
|
(7.7) |
|
|
(14.7) |
(5.8) |
(19.0) |
|
|
|
US dollar million |
2005-06 |
82,396 |
9,452 |
72,944 |
117,872 |
35,647 |
82,226 |
-35,476 |
-26,195 |
-9,282 |
|
(27.7) |
(66.8) |
(24.0) |
(35.1) |
(48.3) |
(30.1) |
|
|
|
2006-07 R |
102,138 |
15,757 |
86,381 |
147,867 |
47,657 |
100,210 |
-45,729 |
-31,901 |
-13,829 |
|
(24.0) |
(66.7) |
(18.4) |
(25.4) |
(33.7) |
(21.9) |
|
|
|
2007-08 P |
124,086 |
17370* |
83144* |
191,453 |
56,892 |
134,560 |
-67,366 |
|
|
|
(21.5) |
(35.4) |
(22.4) |
(29.5) |
(19.4) |
(34.3) |
|
|
|
SDR million |
2005-06 |
56,415 |
6,472 |
49,943 |
80,705 |
24,407 |
56,298 |
-24,290 |
-17,935 |
-6,355 |
|
(29.7) |
(69.4) |
(25.9) |
(37.2) |
(50.6) |
(32.1) |
|
|
|
2006-07 R |
68,863 |
10,623 |
58,240 |
99,695 |
32,131 |
67,564 |
-30,832 |
-21,508 |
-9,324 |
|
(22.1) |
(64.2) |
(16.6) |
(23.5) |
(31.7) |
(20.0) |
|
|
|
2007-08 P |
80,289 |
.. |
.. |
123,878 |
36,812 |
87,066 |
-43,589 |
|
|
|
(16.6) |
|
|
(24.3) |
(14.6) |
(28.9) |
|
|
|
P : Provisional. R : Revised. .. : Not available. * : Figures pertain to the period of April-November.
Note :
1. Figures in brackets relate to percentage variation over the corresponding period of the previous year.
2. Data conversion has been done using period average exchange rates.
Source : DGCI & S. |
Statement 3 : India's Exports of Principal Commodities |
(US $ million) |
Commodity Group |
April-November |
Percentage Variation |
|
2005-06 |
2006-07 |
2007-08 P |
(3)/(2) |
(4)/(3) |
(1) |
(2) |
(3) |
(4) |
(5) |
(6) |
I. |
Primary Products |
9,588.3 |
11,521.3 |
14,785.9 |
20.2 |
28.3 |
|
|
|
|
(15.0) |
(14.3) |
(14.7) |
|
|
|
A. |
Agricultural & Allied Products |
6,023.9 |
7,518.1 |
9,874.9 |
24.8 |
31.3 |
|
|
of which : |
(9.4) |
(9.3) |
(9.8) |
|
|
|
|
1. |
Tea |
269.0 |
320.5 |
309.7 |
19.1 |
-3.4 |
|
|
2. |
Coffee |
223.5 |
289.6 |
271.9 |
29.6 |
-6.1 |
|
|
3. |
Rice |
892.9 |
976.9 |
1,582.3 |
9.4 |
62.0 |
|
|
4. |
Wheat |
125.0 |
7.4 |
0.0 |
-94.1 |
-99.3 |
|
|
5. |
Cotton Raw incl. Waste |
210.3 |
493.2 |
630.5 |
134.5 |
27.9 |
|
|
6. |
Tobacco |
188.2 |
242.5 |
320.6 |
28.9 |
32.2 |
|
|
7. |
Cashew incl. CNSL |
401.4 |
366.7 |
352.0 |
-8.7 |
-4.0 |
|
|
8. |
Spices |
307.4 |
428.4 |
669.0 |
39.4 |
56.2 |
|
|
9. |
Oil Meal |
443.2 |
561.2 |
799.7 |
26.6 |
42.5 |
|
|
10. |
Marine Products |
1,012.9 |
1,116.3 |
1,268.4 |
10.2 |
13.6 |
|
|
11. |
Sugar & Mollases |
24.5 |
540.2 |
796.4 |
2100.6 |
47.4 |
|
B. |
Ores & Minerals |
3,564.4 |
4,003.1 |
4,911.0 |
12.3 |
22.7 |
|
|
of which : |
(5.6) |
(5.0) |
(4.9) |
|
|
|
|
1. |
Iron Ore |
2,215.1 |
2,185.2 |
2,832.7 |
-1.3 |
29.6 |
|
|
2. |
Processed Minerals |
690.2 |
848.9 |
796.1 |
23.0 |
-6.2 |
II. |
Manufactured Goods |
45,451.1 |
54,299.9 |
64,449.8 |
19.5 |
18.7 |
|
of which : |
(71.1) |
(67.2) |
(64.1) |
|
|
|
A. |
Leather & Manufactures |
1,734.5 |
1,953.4 |
2,178.8 |
12.6 |
11.5 |
|
B. |
Chemicals & Related Products |
8,977.3 |
11,116.7 |
12,944.9 |
23.8 |
16.4 |
|
|
1. |
Basic Chemicals, Pharmaceuticals & Cosmetics |
5,416.3 |
6,940.5 |
8,359.5 |
28.1 |
20.4 |
|
|
2. |
Plastic & Linoleum |
1,828.8 |
2,161.6 |
2,139.5 |
18.2 |
-1.0 |
|
|
3. |
Rubber, Glass, Paints & Enamels etc., |
1,306.6 |
1,545.7 |
1,830.3 |
18.3 |
18.4 |
|
|
4. |
Residual Chemicals & Allied Products |
425.6 |
468.9 |
615.6 |
10.2 |
31.3 |
|
C. |
Engineering Goods |
13,352.1 |
18,638.3 |
22,819.8 |
39.6 |
22.4 |
|
|
of which : |
|
|
|
|
|
|
|
1. |
Manufactures of metals |
2,625.3 |
3,229.1 |
4,265.9 |
23.0 |
32.1 |
|
|
2. |
Machinery & Instruments |
3,091.5 |
4,317.9 |
5,490.1 |
39.7 |
27.1 |
|
|
3. |
Transport equipments |
2,708.4 |
2,972.4 |
4,196.1 |
9.7 |
41.2 |
|
|
4. |
Iron & steel |
2,264.3 |
3,387.8 |
3,489.4 |
49.6 |
3.0 |
|
|
5. |
Electronic goods |
1,332.3 |
1,863.7 |
2,053.8 |
39.9 |
10.2 |
|
D. |
Textiles and Textile Products |
10,106.7 |
11,182.2 |
12,245.2 |
10.6 |
9.5 |
|
|
1. |
Cotton Yarn, Fabrics, Made-ups, etc., |
2,477.7 |
2,770.6 |
3,013.8 |
11.8 |
8.8 |
|
|
2. |
Natural Silk Yarn, Fabrics Madeups etc. |
|
|
|
|
|
|
|
|
(incl.silk waste) |
289.7 |
294.2 |
250.5 |
1.6 |
-14.9 |
|
|
3. |
Manmade Yarn, Fabrics, Made-ups, etc., |
1,235.6 |
1,411.0 |
1,849.8 |
14.2 |
31.1 |
|
|
4. |
Manmade Staple Fibre |
51.6 |
111.8 |
160.4 |
116.7 |
43.5 |
|
|
5. |
Woolen Yarn, Fabrics, Madeups etc. |
56.3 |
56.2 |
56.1 |
-0.1 |
-0.2 |
|
|
6. |
Readymade Garments |
5,174.1 |
5,640.8 |
6,019.5 |
9.0 |
6.7 |
|
|
7. |
Jute & Jute Manufactures |
197.6 |
198.3 |
206.8 |
0.3 |
4.3 |
|
|
8. |
Coir & Coir Manufactures |
88.4 |
91.1 |
107.1 |
3.0 |
17.6 |
|
|
9. |
Carpets |
535.8 |
608.2 |
581.3 |
13.5 |
-4.4 |
|
|
|
(a) Carpet Handmade |
522.7 |
592.5 |
573.5 |
13.4 |
-3.2 |
|
|
|
(b) Carpet Millmade |
0.0 |
0.0 |
0.0 |
|
|
|
|
|
(c) Silk Carpets |
13.1 |
15.7 |
7.8 |
20.0 |
-50.4 |
|
E. |
Gems & Jewellery |
10,317.5 |
10,358.9 |
12,997.5 |
0.4 |
25.5 |
|
F. |
Handicrafts |
317.0 |
303.6 |
292.1 |
-4.2 |
-3.8 |
III. |
Petroleum Products |
7,150.3 |
12,827.8 |
17,370.1 |
79.4 |
35.4 |
|
|
|
|
(11.2) |
(15.9) |
(17.3) |
|
|
IV. |
Others |
1,692.6 |
2,110.9 |
3,908.5 |
24.7 |
85.2 |
|
|
|
|
(2.6) |
(2.6) |
(3.9) |
|
|
Total Exports |
63,882.3 |
80,759.9 |
100,514.3 |
26.4 |
24.5 |
P - Provisional.
Note
1 - Figures in brackets relate to percentage to total exports for the period.
Source - DGCI & S. |
Statement 4 : Direction of India’s Foreign Trade-Exports |
(US $ million) |
Group / Country |
April-November |
Percentage Variation |
|
2005-06 |
2006-07 |
2007-08 P |
(3)/(2) |
(4)/(3) |
(1) |
(2) |
(3) |
(4) |
(5) |
(6) |
I. |
O E C D
Countries |
28718.7 |
33276.1 |
39873.8 |
15.9 |
19.8 |
|
A. |
E U |
|
13910.0 |
16196.2 |
20785.3 |
16.4 |
28.3 |
|
|
Of which: |
|
|
|
|
|
|
|
1. |
Belgium |
1769.6 |
2138.6 |
2713.1 |
20.9 |
26.9 |
|
|
2. |
France |
1277.7 |
1350.0 |
1598.1 |
5.7 |
18.4 |
|
|
3. |
Germany |
2197.6 |
2495.0 |
3241.2 |
13.5 |
29.9 |
|
|
4. |
Italy |
1484.2 |
2241.6 |
2489.8 |
51.0 |
11.1 |
|
|
5. |
Netherland |
1640.8 |
1553.1 |
3151.5 |
-5.3 |
102.9 |
|
|
6. |
U K |
3226.0 |
3581.6 |
4448.8 |
11.0 |
24.2 |
|
B. |
North America |
11643.8 |
13154.5 |
14445.8 |
13.0 |
9.8 |
|
|
1. |
Canada |
633.6 |
733.5 |
806.6 |
15.8 |
10.0 |
|
|
2. |
U S A |
11010.2 |
12421.1 |
13639.2 |
12.8 |
9.8 |
|
C. |
Asia and Oceania |
2178.3 |
2794.3 |
3011.1 |
28.3 |
7.8 |
|
|
Of which: |
|
|
|
|
|
|
|
1. |
Australia |
546.9 |
595.5 |
762.9 |
8.9 |
28.1 |
|
|
2. |
Japan |
1524.9 |
1739.6 |
2157.3 |
14.1 |
24.0 |
|
D. |
Other O E C D Countries |
986.6 |
1131.2 |
1631.7 |
14.7 |
44.3 |
|
|
Of which: |
|
|
|
|
|
|
|
1. |
Switzerland |
298.2 |
275.1 |
384.5 |
-7.7 |
39.8 |
II. |
OPEC |
|
9095.5 |
13640.9 |
17035.7 |
50.0 |
24.9 |
|
Of which: |
|
|
|
|
|
|
1. |
Indonesia |
811.3 |
1187.3 |
1154.7 |
46.4 |
-2.7 |
|
2. |
Iran |
657.9 |
1094.8 |
1544.1 |
66.4 |
41.0 |
|
3. |
Iraq |
64.2 |
124.8 |
143.7 |
94.6 |
15.1 |
|
4. |
Kuwait |
330.5 |
415.5 |
416.6 |
25.7 |
0.3 |
|
5. |
Saudi Arabia |
1136.4 |
1631.0 |
2178.4 |
43.5 |
33.6 |
|
6. |
U A E |
5095.4 |
8011.7 |
10145.0 |
57.2 |
26.6 |
III. |
Eastern Europe |
1254.1 |
1550.2 |
2106.8 |
23.6 |
35.9 |
|
Of which: |
|
|
|
|
|
|
1. |
Romania |
53.8 |
89.4 |
176.8 |
66.2 |
97.7 |
|
2. |
Russia |
463.2 |
563.3 |
574.8 |
21.6 |
2.1 |
IV. |
Developing Countries |
24638.3 |
32117.9 |
41155.3 |
30.4 |
28.1 |
|
Of which: |
|
|
|
|
|
|
A. |
Asia |
19227.9 |
23769.8 |
29832.6 |
23.6 |
25.5 |
|
|
a) |
S A A R C |
3530.1 |
4202.9 |
5194.0 |
19.1 |
23.6 |
|
|
|
1. Bangladesh |
1015.0 |
1066.5 |
1412.7 |
5.1 |
32.5 |
|
|
|
2. Bhutan |
67.0 |
33.2 |
56.0 |
- |
68.8 |
|
|
|
3. Maldives |
46.0 |
44.1 |
55.9 |
-4.1 |
26.7 |
|
|
|
4. Nepal |
544.3 |
638.8 |
820.6 |
17.4 |
28.4 |
|
|
|
5. Pakistan |
368.1 |
871.0 |
1081.1 |
136.6 |
24.1 |
|
|
|
6. Sri Lanka |
1403.0 |
1440.7 |
1606.6 |
2.7 |
11.5 |
|
|
|
7. Afghanistan |
86.7 |
108.5 |
161.2 |
25.2 |
48.6 |
|
|
b) |
Other Asian Developing Countries |
15697.8 |
19566.9 |
24638.6 |
24.6 |
25.9 |
|
|
|
Of which: |
|
|
|
|
|
|
|
|
1. People's Rep of China |
3875.2 |
4754.2 |
5883.1 |
22.7 |
23.7 |
|
|
|
2. Hong Kong |
2923.6 |
2929.2 |
3946.8 |
0.2 |
34.7 |
|
|
|
3. South Korea |
1029.3 |
1535.6 |
1457.4 |
49.2 |
-5.1 |
|
|
|
4. Malaysia |
697.7 |
848.7 |
1411.1 |
21.6 |
66.3 |
|
|
|
5. Singapore |
3631.9 |
4176.2 |
4461.6 |
15.0 |
6.8 |
|
|
|
6. Thailand |
667.8 |
890.0 |
1136.0 |
33.3 |
27.6 |
|
B. |
Africa |
3441.2 |
5664.6 |
7837.8 |
64.6 |
38.4 |
|
|
Of which: |
|
|
|
|
|
|
|
1. |
Benin |
66.1 |
99.6 |
147.5 |
50.7 |
48.0 |
|
|
2. |
Egypt Arab Republic |
389.1 |
436.9 |
840.9 |
12.3 |
92.5 |
|
|
3. |
Kenya |
292.5 |
958.3 |
805.7 |
227.6 |
-15.9 |
|
|
4. |
South Africa |
989.1 |
1501.2 |
1616.4 |
51.8 |
7.7 |
|
|
5. |
Sudan |
201.9 |
267.9 |
250.3 |
32.7 |
-6.6 |
|
|
6. |
Tanzania |
153.2 |
191.9 |
359.7 |
25.3 |
87.5 |
|
|
7. |
Zambia |
43.5 |
73.9 |
100.1 |
70.0 |
35.6 |
|
C. |
Latin American Countries |
1969.3 |
2683.6 |
3484.8 |
36.3 |
29.9 |
V. |
Others |
|
64.6 |
71.0 |
93.5 |
10.0 |
31.6 |
VI. |
Unspecified |
111.1 |
103.8 |
249.2 |
-6.6 |
140.1 |
Total |
Exports |
63882.3 |
80759.9 |
100514.3 |
26.4 |
24.5 |
P |
- |
Provisional. |
|
|
|
|
|
Source- DGCI & S. |
Statement 5 : India's Imports of Principal Commodities |
(US $ million) |
Commodity Group |
April-November |
Percentage Variation |
|
2005-06 |
2006-07 |
2007-08 P |
(3)/(2) |
(4)/(3) |
(1) |
(2) |
(3) |
(4) |
(5) |
(6) |
I. |
Bulk Imports |
39,399.3 |
56,472.3 |
69,279.2 |
43.3 |
22.7 |
|
|
|
|
(42.2) |
(47.3) |
(45.1) |
|
|
|
A. |
Petroleum, Petroleum Products |
27,751.5 |
39,418.5 |
47,430.5 |
42.0 |
20.3 |
|
|
& Related Material |
(29.7) |
(33.0) |
(30.9) |
|
|
|
B. |
Bulk Consumption Goods |
2,050.7 |
2,336.1 |
2,976.7 |
13.9 |
27.4 |
|
|
1. |
Wheat |
0.0 |
265.3 |
269.1 |
- |
- |
|
|
2. |
Cereals & Cereal Preparations |
19.5 |
23.7 |
23.7 |
21.4 |
0.3 |
|
|
3. |
Edible Oil |
1,475.7 |
1,522.5 |
1,861.5 |
3.2 |
22.3 |
|
|
4. |
Pulses |
408.5 |
523.9 |
821.8 |
28.3 |
56.9 |
|
|
5. |
Sugar |
147.0 |
0.7 |
0.5 |
- |
- |
|
C. |
Other Bulk Items |
9,597.1 |
14,717.7 |
18,872.1 |
53.4 |
28.2 |
|
|
1. |
Fertilisers |
1,486.0 |
2,338.6 |
3,598.4 |
57.4 |
53.9 |
|
|
|
a) Crude |
212.0 |
237.3 |
280.0 |
11.9 |
18.0 |
|
|
|
b) Sulphur & Unroasted Iron Pyrites |
95.8 |
69.2 |
156.4 |
-27.8 |
126.1 |
|
|
|
c) Manufactured |
1,178.2 |
2,032.2 |
3,162.0 |
72.5 |
55.6 |
|
|
2. |
Non-Ferrous Metals |
1,209.3 |
1,696.4 |
2,256.7 |
40.3 |
33.0 |
|
|
3. |
Paper, Paperboard & Mgfd. incl. Newsprint |
641.0 |
857.9 |
949.2 |
33.8 |
10.6 |
|
|
4. |
Crude Rubber, incl. Synthetic & Reclaimed |
297.6 |
390.1 |
498.3 |
31.1 |
27.7 |
|
|
5. |
Pulp & Waste Paper |
394.3 |
413.3 |
508.4 |
4.8 |
23.0 |
|
|
6. |
Metalliferrous Ores & Metal Scrap |
2,412.7 |
4,969.0 |
5,198.3 |
105.9 |
4.6 |
|
|
7. |
Iron & Steel |
3,156.1 |
4,052.5 |
5,862.8 |
28.4 |
44.7 |
II. |
Non-Bulk Imports |
54,060.2 |
63,014.3 |
84,193.4 |
16.6 |
33.6 |
|
|
|
|
(57.8) |
(52.7) |
(54.9) |
|
|
|
A. |
Capital Goods |
19,640.0 |
27,211.2 |
36,097.4 |
38.5 |
32.7 |
|
|
1. |
Manufactures of Metals |
786.9 |
967.7 |
1,518.1 |
23.0 |
56.9 |
|
|
2. |
Machine Tools |
646.8 |
946.0 |
1,369.2 |
46.3 |
44.7 |
|
|
3. |
Machinery except Electrical & Electronics |
6,203.1 |
8,678.0 |
11,809.2 |
39.9 |
36.1 |
|
|
4. |
Electrical Machinery except Electronics |
939.5 |
1,279.6 |
1,830.3 |
36.2 |
43.0 |
|
|
5. |
Electronic Goods incl. Computer Software |
8,682.0 |
11,189.3 |
14,355.1 |
28.9 |
28.3 |
|
|
6. |
Transport Equipments |
1,858.8 |
2,922.6 |
4,103.2 |
57.2 |
40.4 |
|
|
7. |
Project Goods |
523.0 |
1,228.1 |
1,112.3 |
134.8 |
-9.4 |
|
B. |
Mainly Export Related Items |
13,168.2 |
12,025.3 |
14,499.4 |
-8.7 |
20.6 |
|
|
1. |
Pearls, Precious & Semi-Precious Stones |
6,727.9 |
5,007.0 |
6,054.4 |
-25.6 |
20.9 |
|
|
2. |
Chemicals, Organic & Inorganic |
4,677.7 |
5,229.9 |
6,541.5 |
11.8 |
25.1 |
|
|
3. |
Textile Yarn, Fabric, etc. |
1,412.8 |
1,492.4 |
1,630.8 |
5.6 |
9.3 |
|
|
4. |
Cashew Nuts, raw |
349.9 |
296.1 |
272.6 |
-15.4 |
-7.9 |
|
C. |
Others |
21,251.9 |
23,777.8 |
33,596.6 |
11.9 |
41.3 |
|
|
of which : |
|
|
|
|
|
|
|
1. |
Gold & Silver |
7,951.0 |
9,644.3 |
13,532.5 |
21.3 |
40.3 |
|
|
2. |
Artificial Resins & Plastic Materials |
1,569.5 |
1,733.8 |
2,392.2 |
10.5 |
38.0 |
|
|
3. |
Professional Instruments etc. except electrical |
1,271.2 |
1,509.1 |
1,984.0 |
18.7 |
31.5 |
|
|
4. |
Coal, Coke & Briquittes etc. |
2,448.2 |
2,959.7 |
4,095.4 |
20.9 |
38.4 |
|
|
5. |
Medicinal & Pharmaceutical Products |
652.2 |
783.4 |
1,104.5 |
20.1 |
41.0 |
|
|
6. |
Chemical Materials & Products |
713.9 |
925.0 |
1,045.7 |
29.6 |
13.0 |
|
|
7. |
Non-Metallic Mineral Manufactures |
416.7 |
512.5 |
664.2 |
23.0 |
29.6 |
Total Imports |
|
93,459.4 |
119,486.7 |
153,472.6 |
27.8 |
28.4 |
Memo Items |
|
|
|
|
|
|
|
Non-Oil Imports |
65,707.9 |
80,068.1 |
106,042.1 |
21.9 |
32.4 |
|
Non-Oil Imports excl. Gold & Silver |
57,757.0 |
70,423.8 |
92,509.6 |
21.9 |
31.4 |
|
Mainly Industrial Inputs* |
53,256.9 |
64,546.4 |
84,387.0 |
21.2 |
30.7 |
P : Provisional.
Note
1 : Figures in brackets relate to percentage to total imports for the period
* : Non oil imports net of gold and silver,bulk consumption goods, manufactured fertilizers and professional instruments.
Source : DGCI & S. |
Statement 6 : Direction of India’s Foreign Trade-Imports |
(US $ million) |
Group / Country |
April-November |
Percentage Variation |
|
2005-06 |
2006-07 |
2007-08 P |
(3)/(2) |
(4)/(3) |
1 |
2 |
3 |
4 |
5 |
6 |
I. |
O E C D |
Countries |
31003.9 |
38837.7 |
51134.3 |
25.3 |
31.7 |
|
A. |
E U |
|
14623.0 |
17018.4 |
21689.0 |
16.4 |
27.4 |
|
|
Of which: |
|
|
|
|
|
|
|
1. |
Belgium |
3327.4 |
2709.0 |
3429.0 |
-18.6 |
26.6 |
|
|
2. |
France |
1012.1 |
1445.3 |
1711.7 |
42.8 |
18.4 |
|
|
3. |
Germany |
3762.5 |
4860.5 |
6061.7 |
29.2 |
24.7 |
|
|
4. |
Italy |
1163.8 |
1672.1 |
2471.5 |
43.7 |
47.8 |
|
|
5. |
Netherland |
702.0 |
715.3 |
1081.7 |
1.9 |
51.2 |
|
|
6. |
U K |
2672.9 |
2683.1 |
3429.3 |
0.4 |
27.8 |
|
B. |
North America |
5802.7 |
7772.9 |
10383.2 |
34.0 |
33.6 |
|
|
1. |
Canada |
636.7 |
890.1 |
1280.3 |
39.8 |
43.8 |
|
|
2. |
U S A |
5166.0 |
6882.8 |
9103.0 |
33.2 |
32.3 |
|
C. |
Asia and Oceania |
5695.3 |
7684.3 |
9949.6 |
34.9 |
29.5 |
|
|
Of which: |
|
|
|
|
|
|
|
1. |
Australia |
3268.7 |
4630.3 |
5588.4 |
41.7 |
20.7 |
|
|
2. |
Japan |
2289.3 |
2868.4 |
4145.1 |
25.3 |
44.5 |
|
D. |
Other O E C D Countries |
4882.9 |
6362.1 |
9112.6 |
30.3 |
43.2 |
|
|
Of which: |
|
|
|
|
|
|
|
1. |
Switzerland |
4615.1 |
5798.0 |
7435.2 |
25.6 |
28.2 |
II. |
O P E C |
|
7466.2 |
37666.2 |
46046.9 |
404.5 |
22.2 |
|
Of which: |
|
|
|
|
|
|
1. |
Indonesia |
1946.0 |
2355.2 |
3118.2 |
21.0 |
32.4 |
|
2. |
Iran |
|
469.4 |
5011.4 |
6694.6 |
967.6 |
33.6 |
|
3. |
Iraq |
|
1.3 |
3992.8 |
3897.2 |
- |
- |
|
4. |
Kuwait |
283.0 |
3960.2 |
4047.0 |
1299.6 |
2.2 |
|
5. |
Saudi Arabia |
1040.8 |
9393.2 |
11424.7 |
802.5 |
21.6 |
|
6. |
U A E |
3083.0 |
5647.5 |
8371.7 |
83.2 |
48.2 |
III. |
Eastern Europe |
2724.7 |
3011.0 |
3468.9 |
10.5 |
15.2 |
|
Of which: |
|
|
|
|
|
|
1. |
Romania |
203.1 |
160.0 |
281.9 |
-21.2 |
76.2 |
|
2. |
Russia |
1475.5 |
1343.0 |
1638.4 |
-9.0 |
22.0 |
IV. |
Developing Countries |
24308.5 |
39436.4 |
52356.8 |
62.2 |
32.8 |
|
Of which: |
|
|
|
|
|
|
A. |
Asia |
19428.0 |
31541.7 |
41676.1 |
62.4 |
32.1 |
|
|
a) |
S A A R C |
917.3 |
1014.3 |
1123.9 |
10.6 |
10.8 |
|
|
|
1. Bangladesh |
71.5 |
161.5 |
170.7 |
126.0 |
5.7 |
|
|
|
2. Bhutan |
54.8 |
80.2 |
136.9 |
46.4 |
70.7 |
|
|
|
3. Maldives |
1.3 |
2.2 |
2.7 |
- |
- |
|
|
|
4. Nepal |
252.1 |
199.7 |
253.1 |
-20.8 |
26.7 |
|
|
|
5. Pakistan |
123.6 |
211.7 |
194.5 |
71.3 |
-8.1 |
|
|
|
6. Sri Lanka |
379.4 |
328.8 |
305.8 |
-13.3 |
-7.0 |
|
|
|
7. Afghanistan |
34.7 |
30.2 |
60.3 |
-13.1 |
100.0 |
|
|
b) |
Other Asian Developing Countries |
18510.7 |
30527.4 |
40552.2 |
64.9 |
32.8 |
|
|
|
Of which: |
|
|
|
|
|
|
|
|
1. People's Rep of China |
6930.5 |
11152.3 |
17808.4 |
60.9 |
59.7 |
|
|
|
2. Hong Kong |
1416.1 |
1617.5 |
1892.2 |
14.2 |
17.0 |
|
|
|
3. South Korea |
2854.9 |
3234.9 |
3754.0 |
13.3 |
16.0 |
|
|
|
4. Malaysia |
1564.5 |
3610.6 |
3960.8 |
130.8 |
9.7 |
|
|
|
5. Singapore |
2041.6 |
3722.8 |
5101.4 |
82.3 |
37.0 |
|
|
|
6. Thailand |
813.2 |
1111.2 |
1570.6 |
36.6 |
41.3 |
|
B. |
Africa |
3149.1 |
4696.6 |
6931.4 |
49.1 |
47.6 |
|
|
Of which: |
|
|
|
|
|
|
|
1. |
Benin |
70.1 |
68.4 |
61.2 |
-2.4 |
-10.6 |
|
|
2. |
Egypt Arab Republic |
170.6 |
1210.2 |
1308.4 |
609.6 |
8.1 |
|
|
3. |
Kenya |
32.6 |
37.8 |
57.6 |
15.9 |
52.4 |
|
|
4. |
South Africa |
1671.2 |
1784.9 |
2493.1 |
6.8 |
39.7 |
|
|
5. |
Sudan |
21.4 |
51.4 |
198.6 |
139.8 |
286.4 |
|
|
6. |
Tanzania |
53.6 |
38.9 |
58.1 |
-27.4 |
49.4 |
|
|
7. |
Zambia |
23.9 |
73.4 |
65.6 |
- |
-10.7 |
|
C. |
Latin American Countries |
1731.3 |
3198.0 |
3749.2 |
84.7 |
17.2 |
V. |
Others |
|
19.9 |
37.6 |
49.1 |
88.7 |
30.6 |
VI. |
Unspecified |
27936.3 |
497.9 |
416.7 |
-98.2 |
-16.3 |
Total Imports |
93459.4 |
119486.7 |
153472.6 |
27.8 |
28.4 |
P : Provisional.
Note :
1. The figures for 2006-07, which include country-wise distribution of petroleum imports, are not strictly comparable with the data for previous years.
Source : DGCI & S. |
|


