 IST,
IST,


Industrial Revolution 4.0: Will it be different this time for India?
The study explores the likely impact of the fourth industrial revolution (IR-4) on India’s manufacturing sector. Industry 4.0 is integrating new technologies – like Internet of Things (IoT), cloud computing and analytics, artificial intelligence and machine learning - into manufacturing production processes and operations, ushering in a new era of ‘smart manufacturing’. India’s lead in information technology (IT) exports and presence of experienced IT professionals provides an advantage. However, when it comes to the quality of human capital in general and physical infrastructure required to make the great leap forward, India lags behind its competitors. Introduction Technological changes in the last decade have revolutionised the organisation of industrial production influencing supply chains and production processes. Industry 4.0 (IR-4 hereafter) has integrated new technologies – like Internet of Things (IoT), cloud computing and analytics, and artificial intelligence and machine learning into manufacturing production processes and operations, ushering in a new era of ‘smart manufacturing’. The digital technologies used in the manufacturing processes promotes automation and self-optimisation leading to operational efficiency across the value chain. Since the publication of the book “The Fourth Industrial Revolution”, by Klaus Schwab, World Economic Forum Founder and Executive Chairman, it has generated considerable global attention. IR-4 amalgamates the use of digital technologies from the third industrial revolution with the latest biological and physical innovations which has a potential to transform institutions, industries, and individuals (Schwab, 2016). This article explores the likely impact of IR-4 on India’s manufacturing sector. Section 2 presents in brief the unique characteristic features of various Industrial Revolutions with a focus on IR-4. Section 3 analyses the current profile of India’s manufacturing by exploring its share in global value chains and technology intensity of the sector. Section 4 offers an assessment of the potential for India to benefit from IR-4 and corresponding pre-requisites. Section 5 concludes the paper. The term Industrial Revolution, first coined in 1837 by Louis-Auguste Blanqui, a French economist, referred to economic and social changes driving the transition from industrial activity carried at homes with simple instruments to those undertaken in factories with the help of power-driven machinery1. Phases of major industrial revolutions have been differentiated into periods based on the access to and use of new technology – steam engine and railways (late 18th century); electrification enabling division of labour and mass production (late 19th century); electronics, IT, and automation (late 20th century) (Schwab, 2015) (Table 1). The world is currently going through a fourth industrial revolution, as production becomes increasingly automated and new networks of exchange of information between human and machine are formed (Popkova et al., 2019). IR-4 brings in major changes in industrial organisation and potential localisation of activities, altering the market dynamics through which value-added is generated and appropriated (Primi and Toselli, 2020). From the output side, products and services are expected to be highly interconnected making many of the existing industry boundaries obsolete (Table 2). Data science, biotechnology and artificial intelligence will be used intensively as inputs, necessitating upskilling of the labour force. The fourth industrial revolution is fuelled by four major components: widespread internet penetration; hyper-efficient processing technology (chips); artificial intelligence; and machine learning. While the earlier waves of automation due to past industrial revolutions popularised mass-homogeneous production systems, IR-4 brings to the fore more customised industrial production. With IR-4, new production models will emerge, where automated systems, data exchanges, 3-D printers and robots are used effectively in an environment of smart factories, which will make the production processes lean and flexible enabling optimum utilisation of resources. Lean manufacturing helps identification and steady elimination of all kinds of waste in a manufacturing system and flexible manufacturing enables computer-controlled production with customised volume, process and types (Lu, Morris, & Frechette, 2016). The IR-4 technologies have found initial adoption in the manufacturing sector, where sizeable gains in productivity and efficiency can be unlocked in areas such as supply chain management, inventory management, shipping, construction and consumer analytics. The services sector could also face a radical change with services delivery becoming more targeted using digital platforms. Almost all sectors in the economy would be exposed to opportunities and challenges from technologies. For example, construction processes are changing, with off-site planning and assembling of building happening in a location other than the building site which have a dramatic impact on productivity and efficiency in delivery. In the health sector, wearable devices can not only track health vitals but also use information to predict possible risk factors using artificial intelligence. With the use of Internet-of-Things, care givers can track location and health and administer medicines remotely and more intelligently. The transportation sector is expected to face a major transformation with clean energy fuelled cars and driver-less vehicles ushering increased road safety and reduced pollution. This changing nature of manufacturing process calls for a re-look at developing countries’ export-led policies. The factors - like cheap labour and favourable FDI policies - that helped low-income economies to increase their productivity and income earlier, may not be the determining factor in this new era (Lee et al., 2020). Instead, technologically advanced economies with sophisticated labour force capable of spearheading the digital wave will have an edge over others. This may change the global value chains, with production process re-shoring to countries with higher technological capabilities. At present, with much of the technological advances concentrated in the developed economies which are labour scarce, the benefits emerging from these changes could be asymmetrical and skewed against labour rich developing economies and restrict the scope of low-income countries to benefit out of international trade, unless they adapt and enrich themselves to meet the challenges brought about by the technological developments. Traditionally, manufacturing-led growth has yielded high economic growth, through productivity gains and job creation for the unskilled labour force (Hallward-Driemeier & Nayyar, 2018). Export-led manufacturing growth helped the East Asian economies to move up the ladder in the 1970s. More recently, China emerged as a global leader in manufacturing, largely benefitting from the third industrial revolution. The third industrial revolution led automation of routine tasks may however, stifle low income countries’ economic catch-up, leaving them with stagnant productivity and per capita income growth (UNCTAD, 2017). The new technological developments have brought to the forefront the Schumpeterian idea of Creative Destruction. While new technologies can create new jobs, it can also result in job displacements in certain sectors. Hence, it is crucial for labour rich developing countries to frame strategies for adapting to the changing scenario. The success of a country in harnessing the technological developments depends on the current state of industrial technology, the speed and extent of the acquisition of new technology and the demographic profile with focus on quality rather than quantity (WTO, 2020). Accordingly, we assess the current state of industrial development and human capital of India, next. III. Status of India’s Manufacturing Sector The benefits from first and second industrial revolution largely escaped colonial India. The technological developments in the West resulted in de-industrialisation in India, limiting it to a raw material exporter for the factories in England. Accordingly, India’s share went down from one fourth of world income in 1700 to 3.0 per cent in 1950 (Maddison, 2007). The Third Industrial Revolution, which began in the 1980s, coincided with the era of economic reforms in India. Economic liberalisation aided technical collaboration with foreign firms, and also relaxed norms governing technology induction in the Indian manufacturing sector (Bhat, 2020). Cross border production supported by advances in information and communication technology, among others, led to multi-country production networks with value generated across the globe (Seric & Tong, 2019). However, the benefits of third industrial revolution based on information technology was lopsided in India, with services sector taking off through IT and IT-enabled services (ITeS), e-commerce and e-governance while manufacturing sector was unable to benefit as much due to presence of inefficiency and backwardness in the organisation of industrial production (Singh N., 2016). Over the years, India has moved up in terms of its share in world manufacturing GVA. As per UNIDO Competitive Index, India’s rank in terms of World Manufacturing Value Added Index improved from 14 in 2000 to 5 in 2019. However, in terms of Competitive Industrial Performance Index, India ranked low at 38 in 2019 mainly due to low share of manufacturing sector in GDP. In 2019-20, the sector contributed to 17.1 per cent of GVA and 11.2 per cent of total employment. The manufacturing sector in India is capital intensive, with the organised sector contributing to nearly three fourths of manufacturing sector Gross Value Added (GVA). Textiles and leather products and food and beverages had the highest shares in employment as well as a high share in manufacturing GVA. Both these sectors have relatively higher unorganised sector contributions, with households contributing to 33.6 and 14.7 per cent of their respective GVA. On the other hand, transport equipment, chemicals and machinery have high share in manufacturing GVA with lower employment elasticity. Productivity of these sectors are also high compared to labour intensive sectors (Chart 1). 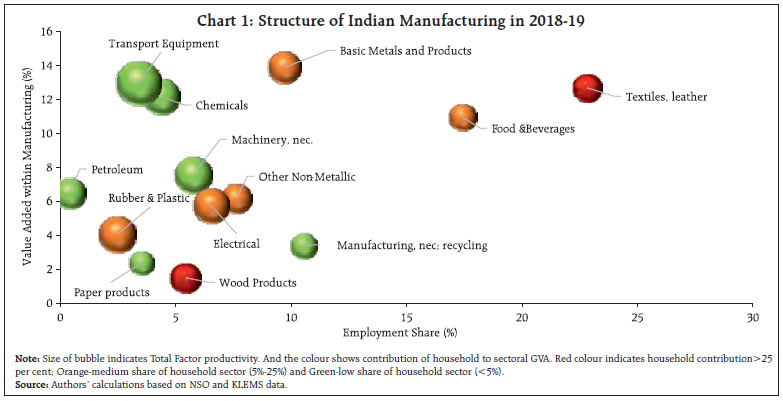 Growth in manufacturing sector has moved in sync with export growth, making global demand an important determinant of manufacturing output growth. Exports accounted for 20.7 per cent of total manufacturing output in 2019-20. Hence, the impact of IR-4 on India’s manufacturing sector could depend a lot on how it can improve its global competitiveness. III.2 Participation in Global Value Chain Industrial production since the 1970’s has been organised in complex multi-country networks with suppliers and consumers spreading across various nodes of the supply chain. While India has made sustained strides in global markets, its share has remained limited in world trade and participation in the global value chain. In line with the global value chain literature, we use two indicators2 to arrive at India’s participation in global value chain. ‘Climbing up the ladder’, where a more than proportional increase of domestic value-added content of foreign exports, measures forward participation in value chain; and ‘Deepening in assembly’, where a more than proportional increase in foreign value-added content in domestic exports, measures backward participation in value chain (Primi & Toselli, 2020). Following Banga (2013), each indicator is then divided by “Global Value Added of Exports”, which is arrived at by summing up the domestic value-added in exports of all countries. Global Value Added of Exports differs from Global Gross Exports as the former nets out double counting in global trade, which is caused by export and re-export of intermediate products in the trade network. Accordingly, countries that specialise in assembling with little value addition end up having a low share in global value added of exports. The value arrived at gives the relative contribution of a country in Global Value Added of Exports (Chart 2a and 2b). 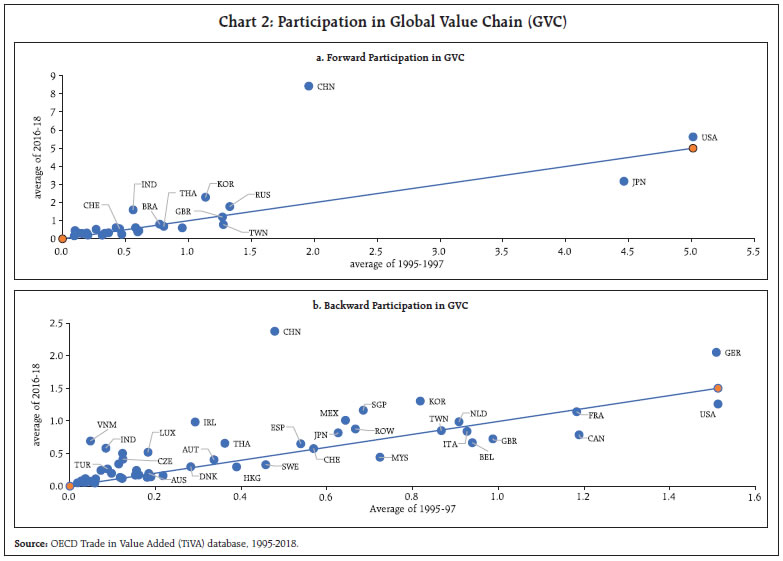 Since the data is available for the period 1995- 2018, the analysis is carried out by taking an average of 1995-97 as the base. While both backward and forward participation of India has improved over period 1995-97, India’ shares in gross exports of other countries have increased at a higher rate than other countries share in India’s gross exports3. Between 1995-97 to 2016-18, India’s forward participation in Global Value Added increased from 0.6 per cent to 1.6 per cent respectively, while backward participation increased by a meagre 0.5 percentage points from 0.1 per cent to 0.6 per cent. China’s forward participation increased from 2.0 per cent to 8.4 per cent between the two-time periods. Backward participation was more spread out with most countries facing an increase in foreign share in their gross exports. Sector wise, compared to manufacturing, India’s participation in services value chain and in particular trade in information industries is higher. Forward participation in information technology increased from 0.4 per cent in 1995 to 2.8 per cent in 2018 (Chart 3a and 3b). India’s advantage in information technology service sector is expected to benefit adoption of IR-4 technologies in India. However, transforming the advantage that India has, in IT as a service to the manufacturing space will depend on technology intensity of India’s manufacturing sector. 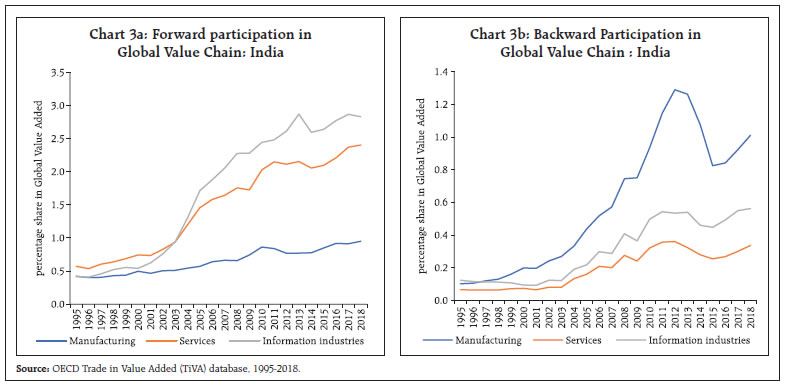 III.3 Technology Intensity of India’s Manufacturing sector Based on OECD classification of economic activities on Research and Development (R&D) intensity4, India’s manufacturing sector is divided into four categories: High R&D Intensive; Medium-High R&D Intensive; Medium R&D intensive; and Medium-low R&D Intensive. As of 2018-195, India’s manufacturing sector is dominated by low-medium R&D industries, though its share has come down over the years. High and Medium R&D intensive industries are increasingly playing an important role in Indian manufacturing sector reflecting India’s scope for benefitting from IR-4 (Chart 4). Despite increasing importance of R&D intensive sectors in India’s manufacturing sector, India’s R&D intensity, measured as expenditure on R&D as a percentage of GDP, remains low. As per the latest available data for 2018, India’s R&D intensity is about 0.7 percent in contrast to advanced nations’ at about 3 per cent (Chart 5). Share of business in R&D expenses is low in India compared to other countries as, in 2018, 63.2 per cent of R&D came from the Government sector (Chart 6). India also has one of the lowest R&D personnel per thousand labour force (Chart 7). 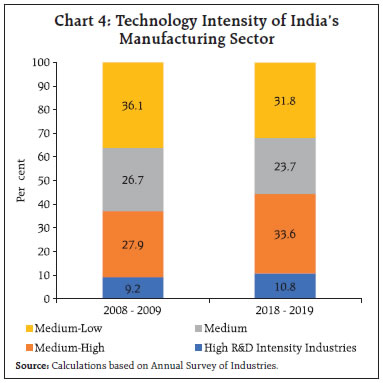 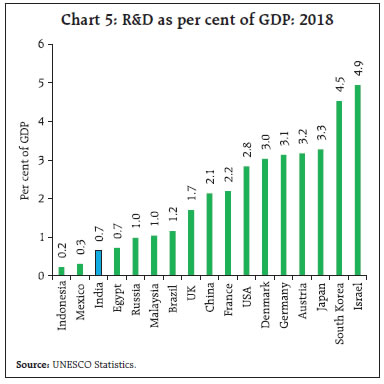 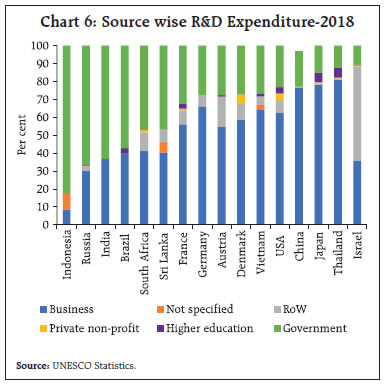 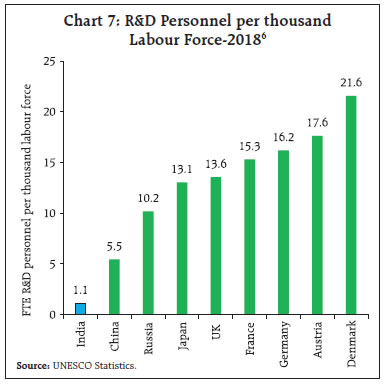 To harness opportunities in IR-4, concerted actions are required to channelize India’s strength in digital technologies to develop smart manufacturing. A pre-requisite for this transition is investment in R&D and strengthening the knowledge base of human capital. To understand the determinants of R&D expenditure in India’s manufacturing sector, a panel data analysis using CMIE Prowess database, is carried out on 1,438 manufacturing enterprises covering 26 manufacturing sub-sectors, for the period 2014-15 to 2018-19 (i.e., pre-COVID period). The explanatory variables used are firm age- based on incorporation year, firm size- based on total assets, growth in net sales, profitability- based on net profits before tax and extraordinary items; debt-equity ratio; and tech to asset ratio. Robust standard errors are used to control heteroscedasticity and serial correlation, whereas two-stage least square (2SLS) is used to control endogeneity by using lags of tech to asset ratio as instrumental variable. Endogeneity exists in a model when the residual of the regression model correlate with the explanatory variables (Gujarati et al., 2012) and instrumental variables are used to control it. Tech to asset ratio is taken as the instrumental variable here as it was the only variable found to be significantly correlated with the residual term. Lag of Tech to Asset is considered as the instrument as lag values prove to be the best instruments to check endogeneity (Mohmed et al., 2020). Given the linear regression, 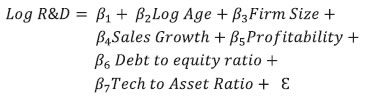 Where, Log R&D: Log research and developments expenses Log Age: Log (1+age) Firm Size: Log total assets Sales Growth: Percentage change in Net Sales i.e., (Net Salest - Net Salest-1/ Net Salest) X 100 Profitability: Percentage change in net profits before tax and extraordinary items i.e., (Net profitst - Net profitst-1/ Net profitst) X 100 Debt to Equity Ratio: Debt/Total equity- directly from prowess Tech to Asset Ratio: presents gross technical know-how including product designs/formulae etc. as a ratio of total assets. Technical know-how means the knowledge and technical/ practical skill, use of specific technology or way of doing something more efficiently and effectively. As for the world of businesses, technical know-how often takes shape of computer software, technology development and related knowledge. However, the meaning is not exhaustive may include product designs, formulae, databases etc. The results show that maturity, size, profitability and technical know-how determine R&D expenditure in India’s manufacturing sector. Older companies, large sized firms, firms with high profitability and technical know-how have higher level of R&D expenses (Table 3). The results suggest that mature companies invest considerably in innovative activities, as they are more experienced and have stability in the market. Since large companies have greater amount of funds available with them and need to develop themselves continuously in order to thrive in the market, the positive coefficient value in the regression depicts a direct influence of firm size on research and development expenses. Profitability and tech to asset ratio have a small yet significant influence on research and development expenses of an organization. Companies earning higher profits and having exposure to technology incur higher research and development expenses. Further, the positive coefficient value of tech to asset ratio depicts that companies with better knowledge regarding the use of specific technology or way of doing something more efficiently and effectively, have higher investment in research and development. As companies with technical know-how are already equipped with basic pre-requisites for research, they may prefer to induce it. The findings are in line with existing literature (Lee, K., 2019). Like past Industrial Revolutions, IR-4 is also expected to bring about far-reaching changes in the labour market with technology shaping the type and nature of work. According to Frey and Osborne (2013), 47 per cent of jobs in the United States are at a high risk of being automated. Similarly, in a cross-country study of 32 countries, close to one in two jobs are likely to be significantly affected by automation, based on the tasks they involve (Nedelkoska, L., & Quintini, G. 2018). About 14 per cent of jobs in OECD countries are highly automatable (i.e., probability of automation of over 70 per cent); another 32 per cent of jobs have a risk of automation between 50 per cent and 70 per cent, pointing to the possibility of significant change in the way these jobs are carried out (Chart 8). 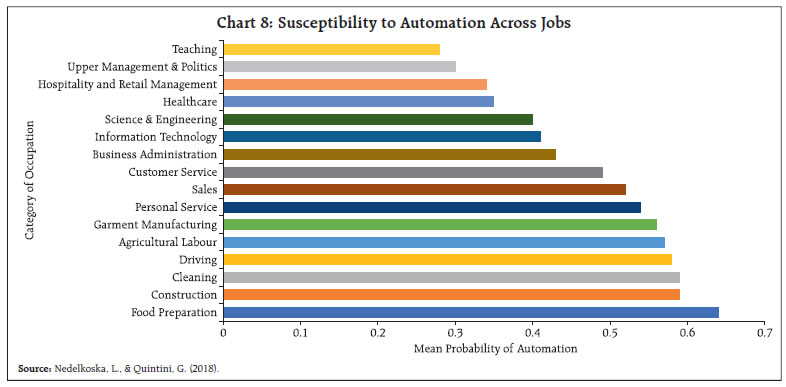 Sectors with higher possibility of increased automation and displacement of significant labour force include transportation, storage, manufacturing and construction (Chart 9). A comparison with India’s employment structure reveals that more than three fourths of India’s workforce outside agriculture is employed in these sectors (Chart 10). Thus, India has a high share of workers employed in sectors with high risk of automation. Manufacturing sector, which is already capital intensive in India may be impacted further by automation as many of the assembly lines can be run by machines and production and distribution processes can be streamlined using advanced technologies, making it even more capital intensive. Further, many of the services that are used in the manufacturing processes would also be impacted by automation, limiting employment potential in manufacturing going ahead.  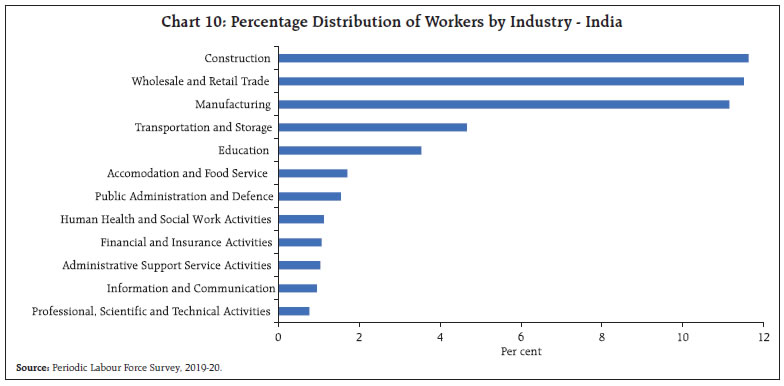 Use of industrial robots in manufacturing is progressing gradually with five major markets accounting for 76 per cent of industrial robots’ installations (Chart 11). India, with a share of 0.8 per cent, is a small player in this segment. In 2020, the world average robot density in the manufacturing sector was 126 robots per 10,000 employees, with Asia having an average robot density of 134 units per 10,000 employees. As per the International Federation of Robotics, World Robotics, 2021, robots’ installation has increased by 0.5 per cent in the pandemic year 2020, making it the third most successful year in robotics industry after 2017 and 2018. The main growth driver was the electronics industry (29 per cent of installations) which surpassed the automotive industry (21 per cent of installations) as the largest customer of industrial robots followed by metals and machinery (11 per cent), plastics and chemical products (5 per cent) and food and beverages (3 per cent). 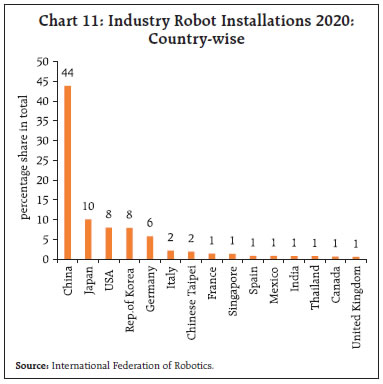 Those jobs which are repetitive, routine cognitive, and manual have high chances of automation (Autor, Levy and Murnane, 2003). While it is highly plausible that occupations involving routine tasks, cognitive or otherwise, are at a higher risk of getting replaced, the tasks having more social requirements are well-placed to survive and thrive. The premium is placed on occupations that deal with managing and improving these technologies and the ones that require human understanding. Therefore, it is important to look at the evolution in skill demand due to these frontier technologies. Like every new technology in the past, IR-4 also brings with it hope of generating new occupations and tasks. Technology has brought higher labour productivity to many sectors by reducing the demand for workers in routine tasks. It also creates proximity to distant markets, facilitating creation of new and more efficient value chains (World Bank, 2019). As the risk of automation is inversely proportional to the skill levels of the workers, the level of human capital development is an important marker of the risks to automation across various countries. Accordingly, the level of educational attainment of the workforce becomes an important variable for deciding the automation potential of the occupations employing the workforce (Ilava rasan, 2017) (Table 4). IV.2 India’s Prospects Successful adaptation to IR-4 require development of skill sets among the working population. While India has made rapid strides in education, three-fourths of the population has educational qualification of only up to secondary level, which are categorised as unskilled to low skilled with high probability of facing the rile of automation. Only 11.8 per cent of the workforce has educational qualifications of graduate and above. India’s tertiary7 enrolment ratio in 2019 was lower than both low-middle income countries and the world average (Chart 12). Further, notwithstanding the fact that employability is high for technically trained personnel, only 3.2 per cent of the workforce have formal vocational/technical training in India (PLFS 2019-20). Many of the task-specific/occupation-specific skills were traditionally transferred either within a family from one generation to another via a family vocation or by learning on the job from veteran skilled workers. In recent years, more institutionalised mechanisms of imparting skills are spreading across India. PLFS (2019-20) reveals that the younger workers (15-29 years) are increasingly getting vocationally/technically trained from formal institutions as compared to the workers in the 15-59 years age cohort (Chart 13). 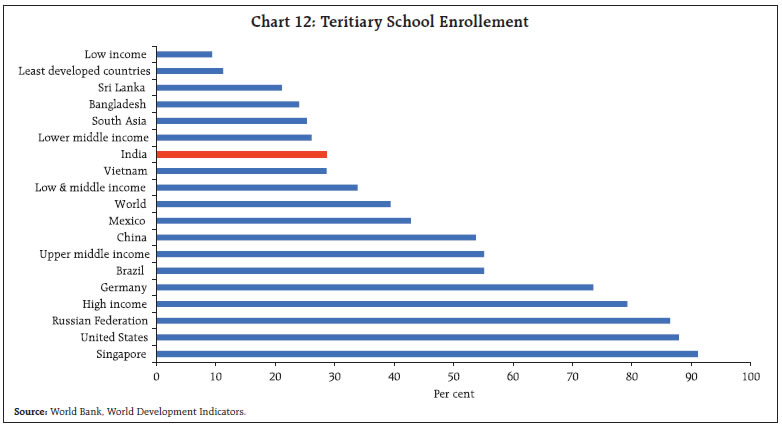  IR-4 technologies demand digital and analytical skills, which make it imperative to expand the spread and scope of technical courses. All-India Survey of Higher Education (AISHE) 2019-20 paints a hopeful picture as enrolment in engineering and technology courses at undergraduate level is the third highest in the country. Similarly, the number of post-graduate and higher degree courses in the engineering and technology domain remains high. However, wide divergence across states in human capital also needs to be addressed. States like Tamil Nadu, Kerala, Karnataka and Punjab have a relatively higher level of human capital development as compared to northern and eastern states of Uttar Pradesh, Bihar, West Bengal and Jharkhand etc. (Chart 14). New technologies would place higher demands on the IT infrastructure – the availability and reliability of ICT services, the data ecosystem, skills, and intellectual property rights become important in this context. India’s density of cellular subscriptions has reached 84 per cent, but it lags major comparable economies on access to digital technology (Chart 15). Similarly, in terms of usage of internet, 41.0 per cent of individuals used internet, lower than the global average of 56.7 per cent [World Development Indicators (World Bank, 2019)]. 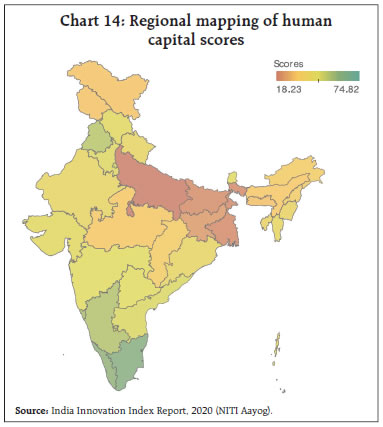 The new age technologies are expected to bring about far-reaching changes in production processes in India’s manufacturing sector. In terms of its participation in global value chain and technology intensity, the sector is assessed to be in a relatively better position to reap the benefits of emerging tech revolution. India’s advantage in technology exports and presence of experienced professionals also provide an added advantage. However, when it comes to the quality of human capital and physical infrastructure required to make the great leap forward, India lags its competitors. Unless the vast labour force is upskilled, the benefits from IR-4 will be more than offset by large scale labour displacement. India has made giant strides in digital space implementing unique, large-scale projects powered by public digital infrastructure, particularly in the payment infrastructure. Efforts are being made in harnessing digital technologies for providing large scale public solutions through the Unified Payments Interface, Aadhar, Cowin, Jan-Dhan Yojna, E-shram portal, eNational Agricultural Market (eNAM), and Direct Benefit Transfer. These open digital platforms being affordable and interoperable are catalysts for innovation and adoption, aiding India’s entrepreneurs to build technologies and provide solutions at scale. India’s start-up landscape has grown exponentially in recent years driven by the underlying infrastructure of increased internet usage and accessibility, providing digital based solutions across sectors. Indian services sector has gained renewed vigour, but large-scale adoption of IR-4 in the manufacturing sector is yet to happen. 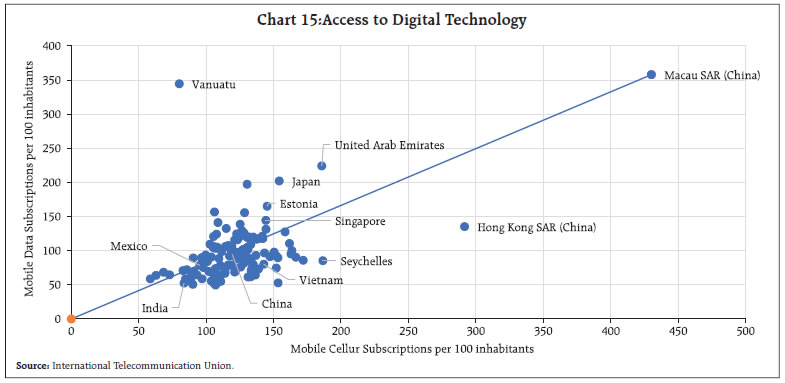 The importance of adopting new technologies is not lost to the Government. Some initiatives undertaken include, setting up of the Centre for the Fourth Industrial Revolution in India in 2018, for elaborating new policy frameworks for emerging technologies. Samarth Udyog Bharat 4.0 (Smart Advanced Manufacturing and Rapid Transformation Hubs) under the Department of Heavy Industries (Ministry of Heavy Industries & Public Enterprises) is another initiative to push for Industry 4.0 implementation with an aim to propagate technological solutions to Indian manufacturing units by 2025 through steps like awareness programme, training, demo centres etc. The new technologies also got a push under the Performance Linked Incentive Scheme (PLI). As new business models challenge incumbents in novel ways and rapidly render skills obsolete, proactive measures are required for faster adaptation of work-force to the new world. This calls for broad and flexible government policies that stay ahead of the curve facilitating smooth transition focusing on developing skill set to the large section of population. While government policies to support digitalisation and improve governance have benefitted the economy, large scale adoption of technology will require extensive knowledge diffusion, higher industry -research collaborations, robust industry infrastructure and inclusive policies for MSMEs. Further, manual, low skill labour displacement will have to be countered by up-skilling labour to reap the advantage of new skilled jobs created. Simultaneously, new avenues of products, services and solutions necessitates prerequisites of local capability and capacity for providing cyber security solutions to protect IR 4.0 applications. Increased funding and incentives to support innovation in manufacturing remain fundamental policy imperatives. An underlying requirement for successful adaptation of fourth IR is an accomplished third IR. Unless the shift to automation and digitization is adequate, the benefits may be partial. While new fields of telemedicine, tele lawyering and edu-tech can ease access to services and create jobs, the job content will become more skill-intensive. These new sectors will not only need resources to develop but also global standard data protection frameworks to thrive. At the state level, innovation hubs need to be developed that are interactive and integrated at the national level. Education system needs to be revamped, to not only include digital education but also improve on the existing quality of education. Future of manufacturing and future of economy depends a lot on how quickly India can improve its human capital and work towards developing a skilled workforce. References: Autor, D. H., Levy, F., & Murnane, R. J. (2003). The skill content of recent technological change: An empirical exploration. The Quarterly journal of economics, 118(4), 1279-1333. Banga, Rashmi (2013), “Measuring Value in Global Value Chains”, Background paper No. RVC-8, UNCTAD. Frey, C.B. & Osborne, M. (2013). The future of employment: How susceptible are jobs to computerization. Oxford Martin School, University of Oxford Working Paper, 47-48. Galindo-Rueda, Fernando and Verger F, (2016), “OECD Taxonomy of Economic Activities Based on R&D Intensity”, OECD Science, Technology and Industry Working Papers 2016/04. Government of India (GoI) (2021). ‘Chapter 3: Summary of Findings’, Periodic Labour Force Survey 2019-20. Hallward-Driemeier , M., & Nayyar, G. (2018). Trouble in the Making? : The Future of Manufacturing-Led Development. Washington DC: World Bank. Hallward-Driemier, M., & Nayyar, G. (2018). Trouble in the Making? The future of Manufacturing-Led Development. World bank. IBM. (n.d.). What is Industry 4.0. Retrieved from ibm.com: https://www.ibm.com/topics/industry-4-0 Ilavarasan, P. V. (2017). Automation and workforce in India: Terrible consequences or impossible? Chapter in: Galperin, H and Alarcon, A. (Eds.). The future of work in the global south (16-21), Ottawa: International Development Research Centre. Lee,Keun, Malerba,F & Primi,A(2020), “The Fourth Industrial Revolution, Changing Global Value Chains and Industrial Upgrading in Emerging Economies”, Journal of Economic Policy Reform, Vol.23, No.4, pp 359-370. Maddison, Angus (2007). Contours of the World Economy 1–2030 AD: Essays in Macro-Economic History. Oxford University Press. Mohmed, A., Flynn, A. and Grey, C. (2020). The link between CSR and earnings quality: evidence from Egypt, Journal of Accounting in Emerging Economies, 10(1), 1-20. doi: 10.1108/JAEE-10-2018-0109. Nedelkoska, L., & Quintini, G. (2018). Automation, skills use and training. OECD Social, Employment and Migration Working Paper No. 202, 8-10. NITI Aayog (2020), ‘Chapter 6: India Innovation Index: Key Findings’, India Innovation Index 2020, 55-85. OECD. (2017). The Next Production Revolution: Implications for Governments and Business. Paris: OECD. Nedelkoska, L., & Quintini, G. (2018). Automation, skills use and training. OECD Social, Employment and Migration Working Paper No. 202, 8-10. Popkova, E. G., Ragulina, Y. V., & Bogoviz, A. V. (2019). Industry 4.0: Industrial Revolution of the 21 st Century. Cham: Springer International Publishing. Porter, M. E., & Heppelmann, J. E. (2014, November). How Smart, Connected Products Are Transforming Competition. Retrieved from Harvard Business Review: https://hbr.org/2014/11/how-smart-connected-products-are-transforming-competition Pricewaterhouse Coopers (2018), ‘Chapter 4: Which industry sectors could see the highest rates of automation?’, Will robots really steal our jobs? An international analysis of the potential long term impact of automation. 18-19. Primi, A., & Toselli, M. (2020). A global perspective on industry 4.0 and development: new gaps or opportunities to leapfrog? Journal of Economic Policy Reform , 371-389. Schwab, K. (2015, December 15). Retrieved from https://www.foreignaffairs.com: https://www.foreignaffairs.com/articles/2015-12-12/fourth-industrial-revolution Schwab, K. (2016, Jan 14). https://www.weforum.org/. Retrieved April 07, 2022, from https://www.weforum.org/agenda/2016/01/the-fourth-industrial-revolution-what-it-means-and-how-to-respond/. Singh, N. (2016). Information Technology and Its Role in India’s Economic Development: A Review. In: Dev, S., Babu, P. (eds) Development in India. India Studies in Business and Economics. Springer, New Delhi. UNCTAD (2017), “Beyond Austerity: Towards a Global New Deal”, Trade and Development Report, New York, and Geneva. World Bank (2019). ‘Chapter 1: The changing nature of work’, World Development Report 2019, 17-34. WTO(2020), “Government policies to promote innovation in the digital age”, World Trade Report, Geneva. Yan Lu, K. C. (2016). Current Standards Landscape for Smart Manufacturing Systems. NIST Interagency/ Internal Report (NISTIR), National Institute of Standards and Technology. * This article is prepared by V. Dhanya, Rigzen Yangdol, Satyarth Singh of Department of Economic and Policy Research, and Mamta Dhanda (Research Intern), Reserve Bank of India. The views expressed in this article are those of the authors and do not represent the views of Reserve Bank of India. 1 The Oxford Companion to British History, 2ed., 2015. 2 Analysis is carried out using OECD Trade in Value Added (TiVA) database. The data is available for the period 1995- 2018. 3 Full country names against the codes are given in Annex 1 4 Detailed OECD (2016) classification given in Annex 2 5 Classification based on Annual Survey of Industries data, latest data available is 2018-19. 6 The Full-time equivalent (FTE) of R&D personnel is defined as the ratio of working hours actually spent on R&D during a specific reference period (usually a calendar year) divided by the total number of hours conventionally worked in the same period by an individual or by a group. |

এই পেজটি শেয়ার করুন:


রিজার্ভ ব্যাঙ্ক অফ ইন্ডিয়া মোবাইল অ্যাপ্লিকেশন ইনস্টল করুন এবং সাম্প্রতিক সংবাদগুলিতে দ্রুত অ্যাক্সেস পান!
আমাদের অ্যাপটি ইনস্টল করতে QR কোডটি স্ক্যান করুন


পেজের শেষ আপডেট করা তারিখ:


