The Central Statistical Organisation (CSO) has released the ‘Quick Estimates of National Income, Consumption Expenditure, Saving and Capital Formation, 2005-06’ on January 31, 2007. These estimates provide the data on various macro-economic aggregates for the years 1999-2000 to 2005-06. Subsequently, the CSO has also released the ‘Revised Estimates of National Income, 2006-07’ on May 31, 2007 providing the estimate of the rate of growth of Gross Domestic Product for the year 2006-07. This article reviews the trends in various macroeconomic aggregates as given in the Quick and Revised Estimates.
It may be mentioned that the CSO, on January 31, 2006, changed the base year of National Accounts Statistics from 1993-94 to 1999-2000. This is the fifth time that the CSO has changed the base year to factor in the structural changes that have been taking place in the economy in order to reflect a more realistic picture of the economy. Apart from changing the base year, improvements were also made in terms of coverage following the recommendations of the United Nations System of National Accounts, 1993 (UNSNA, 1993).
* Prepared in the pision of National Income, Savings and Flow of Funds of Department of Economic Analysis and Policy, Reserve Bank of India, Mumbai. 1. Gross Domestic Product
As per the Quick Estimates of National Income, the real Gross Domestic Product (GDP) at factor cost, the most important indicator of economic growth, registered a growth of 9.0 per cent in 2005-06 as compared to 7.5 per cent in 2004-05 (Table 1, Chart 1). Subsequently, in the Revised Estimates for the year 2006-07, the rate of growth of GDP is estimated at 9.4 per cent on the top of 9.0 per cent in 2005-06.
Table 1: Sectoral Growth Rates of Gross Domestic Product at Factor Cost |
(at 1999-2000 Prices) |
( Per cent) |
Sector |
1999-00 |
2000-01 |
2001-02 |
2002-03 |
2003-04 |
2004-05@ |
2005-06* |
2006-07# |
1 |
2 |
3 |
4 |
5 |
6 |
7 |
8 |
9 |
I. |
Agriculture and Allied Activities |
2.7 |
–0.2 |
6.3 |
–7.2 |
10.0 |
0.0 |
6.0 |
2.7 |
II. |
Industry |
3.5 |
6.4 |
2.4 |
6.8 |
6.0 |
8.4 |
8.0 |
11.0 |
|
a) |
Mining and quarrying |
3.2 |
2.4 |
1.8 |
8.8 |
3.1 |
7.5 |
3.6 |
5.1 |
|
b) |
Manufacturing |
3.2 |
7.7 |
2.5 |
6.8 |
6.6 |
8.7 |
9.1 |
12.3 |
|
c) |
Electricity, gas
and water supply |
5.5 |
2.1 |
1.7 |
4.7 |
4.8 |
7.5 |
5.3 |
7.4 |
III. |
Services |
9.3 |
5.7 |
6.8 |
7.4 |
8.9 |
10.0 |
10.3 |
11.0 |
|
a) |
Construction |
8.4 |
6.2 |
4.0 |
7.9 |
12.0 |
14.1 |
14.2 |
10.7 |
|
b) |
Trade, hotels and restaurants |
7.3 |
5.2 |
9.6 |
6.9 |
10.3 |
8.4 |
8.2 |
13.0^ |
|
c) |
Transport, storage |
|
|
|
|
|
|
|
|
|
|
and communication |
10.2 |
11.2 |
8.2 |
13.6 |
15.1 |
15.2 |
13.9 |
.. |
|
d) |
Financing, insurance, real |
|
|
|
|
|
|
|
|
|
|
estate and business services |
9.2 |
4.1 |
7.3 |
8.0 |
5.6 |
8.7 |
10.9 |
10.6 |
|
e) |
Community, social and personal |
|
|
|
|
|
|
|
|
|
|
services |
11.5 |
4.8 |
4.1 |
3.9 |
5.4 |
7.9 |
7.7 |
7.8 |
IV. |
Gross Domestic Product (I+II+III) |
6.4 |
4.4 |
5.8 |
3.8 |
8.5 |
7.5 |
9.0 |
9.4 |
@ : Provisional Estimates. * : Quick Estimates. # : Revised Estimates.
.. : N.A.
^ : Includes ‘Transport, storage and communication’. |
1.1 Sectoral Growth and Composition of Real Gross Domestic Product
The growth rate of 9.4 per cent in real GDP during 2006-07 has been mainly driven by sub-sectors viz., manufacturing, ‘electricity, gas and water supply’, ‘trade, hotels, restaurants, transport and communication’ and ‘community, social and personal services’.
At sectoral level, growth in agricultural sector is placed lower at 2.7 per cent in 2006-07 than 6.0 per cent in 2005-06. The growth rate of GDP originating from industry is estimated to rise significantly to 11.0 per cent in 2006-07 from 8.0 per cent in 2005-06 (Chart 1) reflecting improvement in the growth of its sub-sectors viz., ‘manufacturing’ (12.3 per cent in 2006-07 from 9.1 per cent in 2005-06), ‘electricity, gas and water supply’ (7.4 per cent in 2006-07 from 5.3 per cent in 2005-06) and ‘mining and quarrying’ (5.1 per cent in 2006-07 from 3.6 per cent in 2005-06) (Table 1). The services sector is estimated to register an impressive growth of 11.0 per cent in 2006-07 as compared with 10.3 per cent in 2005-06, due to improved performance of sub-sectors, namely, ‘trade, hotels, restaurants, transport, storage and communication’. The sub-sector, ‘community, social and personal services’ has marginally improved its growth performance, while the sub-sector, ‘construction’ has recorded a deceleration in its growth. 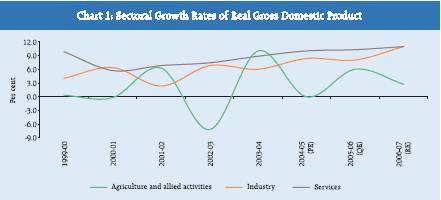
As per the Revised Estimates, the share of ‘agriculture and allied activities’ in real GDP at factor cost is estimated to decline from 19.7 per cent in 2005-06 to 18.5 per cent in 2006-07. The share of industry which had declined from 19.6 per cent in the year 2004-05 to 19.4 in 2005-06 has increased to 19.7 per cent in 2006-07. The share of services in real GDP is estimated to rise from 60.2 per cent in 2005-06 to 61.8 per cent in 2006-07. The rise in the share of services is mainly reflective of increase in the share of ‘trade, hotels, restaurants, transport, storage and communication’, (from 26.1 per cent in 2005-06 to 27.0 per cent in 2006-07) and ‘financing, insurance, real estate and business services’ (from 13.8 per cent in 2005-06 to 13.9 per cent in 2006-07). The share of industry in GDP has increased, mainly due to rise in the share of manufacturing sector from 15.1 per cent in 2005-06 to 15.5 per cent in 2006-07. However, the share of mining and quarrying has declined from 2.1 per cent in 2005-06 to 2.0 per cent in 2006-07 (Table 2).
The continuing structural change in the Indian economy can be evidenced from the changing sectoral composition of GDP. The
Table 2: Sectoral Composition of Gross Domestic Product at Factor Cost |
(at 1999-2000 Prices) |
( Per cent) |
Sector |
1999-00 |
2000-01 |
2001-02 |
2002-03 |
2003-04 |
2004-05@ |
2005-06* |
2006-07# |
1 |
2 |
3 |
4 |
5 |
6 |
7 |
8 |
9 |
I. |
Agriculture and Allied Activities |
25.0 |
23.9 |
24.0 |
21.5 |
21.7 |
20.2 |
19.7 |
18.5 |
II. |
Industry |
19.6 |
20.0 |
19.3 |
19.9 |
19.4 |
19.6 |
19.4 |
19.7 |
|
a) |
Mining and quarrying |
2.3 |
2.3 |
2.2 |
2.3 |
2.2 |
2.2 |
2.1 |
2.0 |
|
b) |
Manufacturing |
14.8 |
15.3 |
14.8 |
15.2 |
15.0 |
15.1 |
15.1 |
15.5 |
|
c) |
Electricity, gas and water supply |
2.5 |
2.4 |
2.3 |
2.4 |
2.3 |
2.3 |
2.2 |
2.2 |
III. |
Services |
55.4 |
56.1 |
56.7 |
58.7 |
58.8 |
60.2 |
60.9 |
61.8 |
|
a) |
Construction |
5.7 |
5.8 |
5.7 |
5.9 |
6.1 |
6.5 |
6.8 |
6.9 |
|
b) |
Trade, hotels and restaurants |
14.2 |
14.3 |
14.9 |
15.3 |
15.5 |
15.7 |
15.5 |
27.0^ |
|
c) |
Transport, storage and |
|
|
|
|
|
|
|
|
|
|
communication |
7.5 |
8.0 |
8.1 |
8.9 |
9.4 |
10.1 |
10.6 |
.. |
|
d) |
Financing, insurance, real |
|
|
|
|
|
|
|
|
|
|
estate and business services |
13.1 |
13.0 |
13.2 |
13.8 |
13.4 |
13.5 |
13.8 |
13.9 |
|
e) |
Community, social and |
|
|
|
|
|
|
|
|
|
|
personal services |
14.9 |
15.0 |
14.7 |
14.8 |
14.3 |
14.4 |
14.2 |
14.0 |
IV. |
Gross Domestic Product (I+II+III) |
100 |
100 |
100 |
100 |
100 |
100 |
100 |
100 |
@ : Provisional Estimates.
* : Quick Estimates.
# : Revised Estimates.
.. : N.A.
^ : Includes ‘Transport, storage and communication’. |
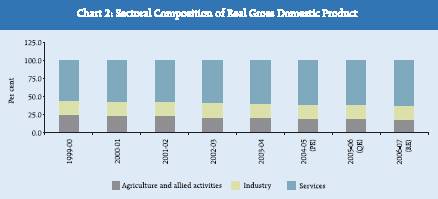
share of ‘agriculture and allied activities’ has been showing a continuous decline from 25.0 per cent in 1999-2000 to 18.5 per cent in 2006-07,while that of services sector has witnessed a continuous rise from 55.4 per cent in 1999-2000 to 61.8 per cent in 2006-07. The share of industry, however, remained in the range of 19.3 to 20.0 per cent during the same period (Chart 2). 1.2 Sectoral Contribution to the Growth of Real Gross Domestic Product
The rate of growth of real GDP at 9.4 per cent in 2006-07 was the sum of weighted growth rates of 'agriculture and allied activities' at 0.5 per cent, industry at 2.1 per cent and services sector at 6.7 per cent (Table 3). These weighted growth rates were
Table 3: Sectoral Contribution to the Growth of Gross Domestic Product at Factor Cost |
(at 1999-2000 Prices) |
( Per cent) |
Sector |
1999-00 |
2000-01 |
2001-02 2002-03 |
2003-04 |
2004-05@ |
2005-06* 2006-07# |
1 |
2 |
3 |
4 |
5 |
6 |
7 |
8 |
9 |
I. |
Agriculture and Allied Activities |
0.7 |
–0.1 |
1.5 |
–1.7 |
2.1 |
0.0 |
1.2 |
0.5 |
II. |
Industry |
0.7 |
1.3 |
0.5 |
1.3 |
1.2 |
1.6 |
1.6 |
2.1 |
|
a) |
Mining and quarrying |
0.1 |
0.1 |
0.0 |
0.2 |
0.1 |
0.2 |
0.1 |
0.1 |
|
b) |
Manufacturing |
0.5 |
1.1 |
0.4 |
1.0 |
1.0 |
1.3 |
1.4 |
1.9 |
|
c) |
Electrical, gas and water supply |
0.1 |
0.1 |
0.0 |
0.1 |
0.1 |
0.2 |
0.1 |
0.2 |
III. |
Services |
5.0 |
3.2 |
3.8 |
4.2 |
5.2 |
5.9 |
6.2 |
6.7 |
|
a) |
Construction |
0.3 |
0.4 |
0.2 |
0.5 |
0.7 |
0.9 |
0.9 |
0.7 |
|
b) |
Trade, hotels and restaurants |
1.0 |
0.7 |
1.4 |
1.1 |
1.6 |
1.3 |
1.3 |
3.4^ |
|
c) |
Transport, storage and |
|
|
|
|
|
|
|
|
|
|
communication |
0.7 |
0.9 |
0.7 |
1.2 |
1.4 |
1.5 |
1.5 |
.. |
|
d) |
Financing, insurance, real |
|
|
|
|
|
|
|
|
|
|
estate and business services |
1.2 |
0.5 |
0.9 |
1.1 |
0.8 |
1.2 |
1.5 |
1.5 |
|
e) |
Community, social and |
|
|
|
|
|
|
|
|
|
|
personal services |
1.6 |
0.7 |
0.6 |
0.6 |
0.8 |
1.1 |
1.1 |
1.1 |
IV. |
Gross Domestic Product (I+II+III) |
6.4 |
4.4 |
5.8 |
3.8 |
8.5 |
7.5 |
9.0 |
9.4 |
@ : Provisional Estimates.
* : Quick Estimates.
# : Revised Estimates.
.. : N.A.
^ : Includes ‘Transport, storage and communication’.
Note : Sectoral rates may not add up to GDP growth due to rounding off. |

1.2 per cent, 1.6 per cent and 6.2 per cent, respectively in 2005-06. After normalising the growth of GDP to 100 per cent, the sectoral contributions to growth worked out to 5.6 per cent for 'agriculture and allied activities', 22.8 per cent for industry and 71.5 per cent for services sector in 2006-07, as against the contribution of 13.5 per cent for 'agriculture and allied activities', 17.5 per cent for industry and 69.0 per cent for services sector in 2005-06 (Chart 3).
2. Trends in Domestic Saving
As per the Quick Estimates, the Gross Domestic Saving (GDS) (base year: 1999-2000) in India has increased at current market prices from 31.1 per cent in 2004-05 to 32.4 per cent in 2005-06 mainly due to improvement in saving performance by the private corporate and household sectors. More importantly, the public sector saving has witnessed a turn-around since 2003-04. As a result, the rate of saving of public sector increased from (-) 0.8 per cent in 1999-2000 to 2.0 per cent in 2005-06. The Indian economy has witnessed a continuous increase in the rate of GDS, particularly from 2000-01(Chart 4, Table 4). The household sector has been the largest contributor to the GDS in India. An analysis of the composition of GDS shows that the share of household sector increased from 85.2 per cent in 1999-2000 to 92.8 per cent in 2001-02. However, since then the share of household saving declined and remained at 68.9 per cent in 2005-06, whereas the share of private corporate sector increased from 23.0 per cent in 2004-05 to 24.9 per cent in 2005-06. A significant development in the recent years has been the turn-around in public sector saving from dis-saving to a saving generating sector. 
Table 4: Rates of Gross Domestic Saving and Investment |
(Per cent of GDP at Current Market Prices) |
Item |
1999-00 |
2000-01 |
2001-02 |
2002-03 |
2003-04 |
2004-05 |
2005-06 |
|
|
|
|
|
|
(PE) |
(QE) |
1 |
2 |
3 |
4 |
5 |
6 |
7 |
8 |
1. |
Household Saving |
21.1 |
21.0 |
21.8 |
22.7 |
23.8 |
21.6 |
22.3 |
|
a) Financial assets |
10.6 |
10.2 |
10.8 |
10.3 |
11.3 |
10.2 |
11.7 |
|
b) Physical assets |
10.5 |
10.8 |
10.9 |
12.4 |
12.4 |
11.4 |
10.7 |
2. |
Private Corporate Saving |
4.5 |
4.3 |
3.7 |
4.2 |
4.7 |
7.1 |
8.1 |
3. |
Public Sector Saving |
–0.8 |
–1.7 |
–2.0 |
–0.6 |
1.2 |
2.4 |
2.0 |
4. |
Gross Domestic Saving |
24.8 |
23.7 |
23.5 |
26.4 |
29.7 |
31.1 |
32.4 |
5. |
Gross Domestic Capital Formation |
25.9 |
24.3 |
22.9 |
25.2 |
28.0 |
31.5 |
33.8 |
6. |
Gross Capital Formation |
26.1 |
24.1 |
23.8 |
25.0 |
26.6 |
29.7 |
32.2 |
|
a) Public sector |
7.4 |
6.9 |
6.9 |
6.1 |
6.3 |
7.1 |
7.4 |
|
b) Private corporate sector |
7.4 |
5.7 |
5.4 |
5.9 |
6.9 |
9.9 |
12.9 |
|
c) Household sector |
10.5 |
10.8 |
10.9 |
12.4 |
12.4 |
11.4 |
10.7 |
7. |
Saving-Investment Balance(4-5) |
–1.1 |
–0.6 |
0.6 |
1.2 |
1.6 |
–0.4 |
–1.3 |
|
a) Public Sector Balance |
–8.2 |
–8.5 |
–8.9 |
–6.6 |
–5.2 |
–4.7 |
–5.4 |
|
b) Private Corporate Sector |
–2.9 |
–1.4 |
–1.7 |
–1.7 |
–2.2 |
–2.8 |
–4.8 |
|
c) Household Sector |
10.6 |
10.2 |
10.8 |
10.3 |
11.3 |
10.2 |
11.7 |
|
|
|
|
|
|
|
|
|
PE : Provisional Estimates.
QE : Quick Estimates.
Note : 1. Figures may not add up to the totals due to rounding off.
2. Sectoral saving-investment balances are calculated as the difference between saving and gross capital formation
at sectoral level.
Source : Central Statistical Organisation. |
3. Trends in Domestic Capital Formation
The rate of Gross Domestic Capital Formation (GDCF) rose from 31.5 per cent in 2004-05 to 33.8 per cent in 2005-06. The saving-investment gap (i.e., rate of GDS less rate of GDCF) increased from (-) 0.4 per cent in 2004-05 to (-) 1.3 per cent in 2005-06. The rate of capital formation in the household sector, a corollary of household sector saving in physical assets, recorded decrease from 11.4 per cent in 2004-05 to 10.7 per cent in 2005-06. The rate of capital formation in private corporate sector increased from 9.9 per cent in 2004-05 to 12.9 per cent in 2005-06, while that in public
sector increased from 7.1 per cent to 7.4 per cent during the same period. The saving-investment gap at the institutional level is indicated in Table 4.
The composition of Gross Capital Formation (GCF) by type of institution reveals that the share of public sector in gross capital formation marginally decreased from 23.9 per cent in 2004-05 to 23.0 per cent in 2005-06. The share of private corporate sector in gross capital formation rose significantly from 33.3 per cent in 2004-05 to 40.1 per cent in 2005-06 and that of household sector share decreased from 38.4 per cent to 33.2 per cent during the same period (Chart 5). 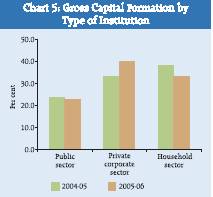
The breakup of GCF by industry indicates that the share of industrial sector in the capital formation was the highest. It increased from 32.0 per cent in 2001-02 to 52.2 per cent in 2005-06. The share of the services sector in capital formation decreased from 56.4 per cent in 2001-02 to 40.2 per cent in 2005-06. The share of ‘agriculture and allied activities’ in the capital formation was the lowest among all three sectors. It decreased from 11.6 per cent in 2001-02 to 7.7 per cent in 2005-06 (Chart 6, Statement 4). 4. Other Macro-economic Aggregates
In its 'Revised Estimates of National Income, 2006-07' released on May 31, 2007, the CSO has also released for the first time the estimates of expenditure of the GDP at current and constant (1999-2000) prices along with the Revised Estimates of GDP by economic activity. These are consumption expenditure, capital formation and net exports (i.e., exports less imports) and are presented in Statement 5 (5a and 5b) both at constant and current prices, respectively. As a share of GDP at current market prices, total final consumption expenditure has declined from 69.2 per cent in 2005-06 to 67.7 per cent in 2006-07 reflecting mainly a decline in the share of private final consumption expenditure (PFCE) from 57.9 per cent in 2005-06 to 56.4 per cent in 2006-07. Gross fixed capital formation as a proportion of GDP increased from 28.1 per cent in 2005-06 to 29.5 per cent in 2006-07, while 'change in stock' remained at 2.9 per cent for both the years and that of 'valuables' increased from 1.2 per cent in 2005-06 to 1.5 per cent in 2006-07. The share of exports in GDP increased from 20.3 per cent in 2005-06 to 23.0 per cent in 2006-07 while that of imports increased from 23.3 per cent in 2005-06 to 25.8 per cent in 2006-07. As a result, net exports as a proportion of GDP at current market prices improved from (-) 3.0 per cent in 2005-06 to (-) 2.8 per cent in 2006-07.
It may be mentioned that some 'Discrepancies' arise due to the difference between the GDP estimated by economic activity marked up by net indirect taxes (indirect taxes less subsidies) to arrive at GDP at market prices and the GDP estimated from the expenditure side. Discrepancies during 2006-07 are estimated at 1.2 per cent of GDP at current market prices as against the corresponding rate of 1.6 per cent in 2005-06.
As of certain other important aggregates, the real Net National Product1 at factor cost (1999-2000 prices), which is termed as National Income, is estimated to grow at the rate 9.9 per cent in 2006-07. Accordingly, the per capita income (i.e. per capita Net National Product at factor cost) is estimated to show a growth of 7.4 per cent in 2005-06 to 8.4 per cent in 2006-07 (Statement 5a). 1 Net National Product is obtained after adjusting Gross National Product for depreciation. The depreciation in national accounts statistics (NAS) refers to consumption of fixed capital. 
Statement 1: Trends in Sectoral Growth and Composition of Gross Domestic Product at Factor Cost |
(At 1999-2000 Prices) |
Item |
1999-2000 |
2000-01 |
2001-02 |
2002-03 |
|
Amount |
Growth |
Amount |
Growth |
Amount |
Growth |
Amount |
Growth |
|
(Rs. |
Rate |
(Rs. |
Rate |
(Rs. |
Rate |
(Rs. |
Rate |
|
crore) |
(Per |
crore) |
(Per |
crore) |
(Per |
crore) |
(Per |
|
|
cent) |
|
cent) |
|
cent) |
|
cent) |
1 |
2 |
3 |
4 |
5 |
6 |
7 |
8 |
9 |
|
|
|
|
|
|
|
|
|
I. |
Agriculture, forestry and fishing |
446515 |
2.7 |
445594 |
–0.2 |
473530 |
6.3 |
439321 |
–7.2 |
|
|
(25.0) |
|
(23.9) |
|
(24.0) |
|
(21.5) |
|
|
|
|
|
|
|
|
|
|
|
II. |
Industry |
350233 |
3.5 |
372599 |
6.4 |
381366 |
2.4 |
407276 |
6.8 |
|
|
|
(19.6) |
|
(20.0) |
|
(19.3) |
|
(19.9) |
|
|
a) |
Mining and quarrying |
41594 |
3.2 |
42589 |
2.4 |
43335 |
1.8 |
47168 |
8.8 |
|
|
|
(2.3) |
|
(2.3) |
|
(2.2) |
|
(2.3) |
|
|
b) |
Manufacturing |
264113 |
3.2 |
284571 |
7.7 |
291803 |
2.5 |
311685 |
6.8 |
|
|
|
(14.8) |
|
(15.3) |
|
(14.8) |
|
(15.2) |
|
|
c) |
Electricity, gas and water supply |
44526 |
5.5 |
45439 |
2.1 |
46228 |
1.7 |
48423 |
4.7 |
|
|
|
(2.5) |
|
(2.4) |
|
(2.3) |
|
(2.4) |
|
|
|
|
|
|
|
|
|
|
|
|
III. |
Services |
989778 |
9.3 |
1046578 |
5.7 |
1118016 |
6.8 |
1201136 |
7.4 |
|
|
|
(55.4) |
|
(56.1) |
|
(56.7) |
|
(58.7) |
|
|
a) |
Construction |
102007 |
8.4 |
108362 |
6.2 |
112692 |
4.0 |
121650 |
7.9 |
|
|
|
(5.7) |
|
(5.8) |
|
(5.7) |
|
(5.9) |
|
|
b) |
Trade, hotels and restaurants |
254143 |
7.3 |
267325 |
5.2 |
293075 |
9.6 |
313221 |
6.9 |
|
|
|
(14.2) |
|
(14.3) |
|
(14.9) |
|
(15.3) |
|
|
c) |
Transport, storage and |
133371 |
10.2 |
148339 |
11.2 |
160516 |
8.2 |
182273 |
13.6 |
|
|
communication |
(7.5) |
|
(8.0) |
|
(8.1) |
|
(8.9) |
|
|
d) |
Financing insurance, real estate |
233550 |
9.2 |
243087 |
4.1 |
260791 |
7.3 |
281611 |
8.0 |
|
|
and business services |
(13.1) |
|
(13.0) |
|
(13.2) |
|
(13.8) |
|
|
e) |
Community, social and |
266707 |
11.5 |
279465 |
4.8 |
290942 |
4.1 |
302381 |
3.9 |
|
|
personal services |
(14.9) |
|
(15.0) |
|
(14.7) |
|
(14.8) |
|
|
|
|
|
|
|
|
|
|
|
|
GDP at factor cost (I+II+III) |
1786526 |
6.4 |
1864772 |
4.4 |
1972912 |
5.8 |
2047733 |
3.8 |
|
|
|
(100.0) |
|
(100.0) |
|
(100.0) |
|
(100.0) |
|
Statement 1: Trends in Sectoral Growth and Composition of Gross Domestic Product at Factor Cost |
(At 1999-2000 Prices) (Concld.) |
Item |
2003-04 |
2004-05@ |
2005-06* |
2006-07# |
|
Amount |
Growth |
Amount |
Growth |
Amount |
Growth |
Amount |
Growth |
|
(Rs. |
Rate |
(Rs. |
Rate |
(Rs. |
Rate |
(Rs. |
Rate |
|
crore) |
(Per |
crore) |
(Per |
crore) |
(Per |
crore) |
(Per |
|
|
cent) |
|
cent) |
|
cent) |
|
cent) |
1 |
10 |
11 |
12 |
13 |
14 |
15 |
16 |
17 |
|
|
|
|
|
|
|
|
|
I. |
Agriculture, forestry and fishing |
483274 |
10.0 |
483080 |
0.0 |
512147 |
6.0 |
525875 |
2.7 |
|
|
(21.7) |
|
(20.2) |
|
(19.7) |
|
(18.5) |
|
|
|
|
|
|
|
|
|
|
|
II. |
Industry |
431724 |
6.0 |
467896 |
8.4 |
505485 |
8.0 |
561086 |
11.0 |
|
|
(19.4) |
|
(19.6) |
|
(19.4) |
|
(19.7) |
|
|
a) |
Mining and quarrying |
48626 |
3.1 |
52250 |
7.5 |
54128 |
3.6 |
56912 |
5.1 |
|
|
|
(2.2) |
|
(2.2) |
|
(2.1) |
|
(2.0) |
|
|
b) |
Manufacturing |
332363 |
6.6 |
361115 |
8.7 |
393956 |
9.1 |
442503 |
12.3 |
|
|
|
(15.0) |
|
(15.1) |
|
(15.1) |
|
(15.5) |
|
|
c) |
Electricity, gas and water supply |
50735 |
4.8 |
54531 |
7.5 |
57401 |
5.3 |
61671 |
7.4 |
|
|
|
(2.3) |
|
(2.3) |
|
(2.2) |
|
(2.2) |
|
|
|
|
|
|
|
|
|
|
|
|
III. |
Services |
1307593 |
8.9 |
1438684 |
10.0 |
1586900 |
10.3 |
1761195 |
11.0 |
|
|
|
(58.8) |
|
(60.2) |
|
(60.9) |
|
(61.8) |
|
|
a) |
Construction |
136225 |
12.0 |
155431 |
14.1 |
177543 |
14.2 |
196555 |
10.7 |
|
|
|
(6.1) |
|
(6.5) |
|
(6.8) |
|
(6.9) |
|
|
b) |
Trade, hotels and restaurants |
345424 |
10.3 |
374312 |
8.4 |
404919 |
8.2 |
768578 |
13.0 ^ |
|
|
|
(15.5) |
|
(15.7) |
|
(15.5) |
|
(27.0) |
|
|
c) |
Transport, storage and |
209879 |
15.1 |
241711 |
15.2 |
275318 |
13.9 |
.. |
.. |
|
|
communication |
(9.4) |
|
(10.1) |
|
(10.6) |
|
.. |
|
|
d) |
Financing, insurance, real |
297326 |
5.6 |
323187 |
8.7 |
358535 |
10.9 |
396394 |
10.6 |
|
|
estate and business services |
(13.4) |
|
(13.5) |
|
(13.8) |
|
(13.9) |
|
|
e) |
Community, social and |
318739 |
5.4 |
344042 |
7.9 |
370584 |
7.7 |
399668 |
7.8 |
|
|
personal services |
(14.3) |
|
(14.4) |
|
(14.2) |
|
(14.0) |
|
|
|
|
|
|
|
|
|
|
|
|
|
GDP at factor cost (I+II+III) |
2222592 |
8.5 |
2389660 |
7.5 |
2604532 |
9.0 |
2848157 |
9.4 |
|
|
|
(100.0) |
|
(100.0) |
|
(100.0) |
|
(100.0) |
|
@ : Provisional Estimates.
* : Quick Estimates.
# : Revised Estimates.
.. : Not Available.
^ : Includes ‘Transport, storage and communication’.
Note : Figures in the parentheses are share as a per cent of GDP.
Source : Central Statistical Organisation. |
Statement 2 : Domestic Saving by Type of Institution |
(At Current Prices) |
Item |
1999-00 |
2000-01 |
2001-02 |
2002-03 |
2003-04 |
2004-05@ |
2005-06* |
1 |
2 |
3 |
4 |
5 |
6 |
7 |
8 |
I. |
Gross Domestic Saving |
484256 |
497218 |
535583 |
648982 |
820504 |
973028 |
1156809 |
|
(II+III+IV) |
(24.8) |
(23.7) |
(23.5) |
(26.4) |
(29.7) |
(31.1) |
(32.4) |
|
|
|
|
|
|
|
|
|
II. |
Household Sector |
412516 |
442136 |
496958 |
559074 |
657327 |
674834 |
797117 |
|
(1+2) |
(21.1) |
(21.0) |
(21.8) |
(22.7) |
(23.8) |
(21.6) |
(22.3) |
|
1. |
Finacial Saving |
206602 |
215219 |
247476 |
253255 |
313260 |
318791 |
416462 |
|
|
|
(10.6) |
(10.2) |
(10.8) |
(10.3) |
(11.3) |
(10.2) |
(11.7) |
|
2. |
Physical Saving |
205914 |
226917 |
249482 |
305819 |
344067 |
356043 |
380655 |
|
|
|
(10.5) |
(10.8) |
(10.9) |
(12.4) |
(12.4) |
(11.4) |
(10.7) |
|
|
|
|
|
|
|
|
|
|
III. |
Private Corporate Sector 87234 |
90143 |
85203 |
103965 |
131355 |
223512 |
288430 |
|
|
|
(4.5) |
(4.3) |
(3.7) |
(4.2) |
(4.7) |
(7.1) |
(8.1) |
|
|
|
|
|
|
|
|
|
|
IV. |
Public Sector |
–15494 |
–35061 |
–46578 |
–14057 |
31822 |
74682 |
71262 |
|
|
|
(–0.8) |
(–1.7) |
(–2.0) |
(–0.6) |
(1.2) |
(2.4) |
(2.0) |
|
|
|
|
|
|
|
|
|
|
@ : Provisional Estimates. * : Quick Estimates.
Note : The rates of GDS and its components are computed with respect to GDP at current market prices and
presented in parentheses.
Source : Central Statistical Organisation. |
Statement 3: Capital Formation by Type of Institution |
Item |
1999-00 |
2000-01 |
2001-02 |
2002-03 |
|
Amount |
Rate |
Amount |
Rate |
Amount |
Rate |
Amount |
Rate |
|
(Rs. crore) |
(Per cent) |
(Rs. crore) |
(Per cent) |
(Rs. crore) |
(Per cent) |
(Rs. crore) |
(Per cent) |
1 |
2 |
3 |
4 |
5 |
6 |
7 |
8 |
9 |
At Current Prices |
1. |
Gross Capital Formation |
|
|
|
|
|
|
|
|
|
(GCF) |
509518 |
26.1 |
506181 |
24.1 |
543562 |
23.8 |
614679 |
25.0 |
|
(a) Public Sector |
144610 |
7.4 |
144639 |
6.9 |
156544 |
6.9 |
149324 |
6.1 |
|
(b) Private Corporate Sector |
143475 |
7.4 |
119901 |
5.7 |
123349 |
5.4 |
145579 |
5.9 |
|
(c) Household Sector |
205914 |
10.5 |
226917 |
10.8 |
249482 |
10.9 |
305819 |
12.4 |
|
|
|
|
|
|
|
|
|
|
2. |
Gross Fixed Capital |
|
|
|
|
|
|
|
|
|
Formation |
456416 |
23.4 |
478317 |
22.8 |
525452 |
23.0 |
584366 |
23.8 |
|
|
|
|
|
|
|
|
|
|
3. |
Change in Stock |
37583 |
1.9 |
13140 |
0.6 |
3923 |
0.2 |
16356 |
0.7 |
|
|
|
|
|
|
|
|
|
|
4. |
Errors and Omissions |
–3274 |
–0.2 |
3791 |
0.2 |
-22208 |
–1.0 |
5816 |
0.2 |
|
|
|
|
|
|
|
|
|
|
5. |
Gross Domestic capital |
|
|
|
|
|
|
|
|
|
Formation (GDCF) |
506244 |
25.9 |
509972 |
24.3 |
521355 |
22.9 |
620496 |
25.2 |
|
|
|
|
|
|
|
|
|
|
|
|
|
At 1999-2000 Prices |
|
|
|
|
|
|
|
|
|
|
|
|
|
|
1. |
Gross Capital Formation |
|
|
|
|
|
|
|
|
|
(GCF) |
509518 |
26.1 |
484951 |
23.9 |
495113 |
23.2 |
548554 |
24.8 |
|
(a) Public Sector |
144610 |
7.4 |
140239 |
6.9 |
144322 |
6.8 |
134108 |
6.1 |
|
(b) Private Corporate Sector |
143475 |
7.4 |
114481 |
5.6 |
111735 |
5.2 |
128669 |
5.8 |
|
(c) Household Sector |
205914 |
10.5 |
215975 |
10.6 |
225567 |
10.6 |
272847 |
12.3 |
|
|
|
|
|
|
|
|
|
|
2. |
Gross Fixed Capital |
|
|
|
|
|
|
|
|
|
Formation |
456416 |
23.4 |
457888 |
22.5 |
478587 |
22.4 |
520164 |
23.5 |
|
|
|
|
|
|
|
|
|
|
3. |
Change in Stock |
37583 |
1.9 |
12807 |
0.6 |
3037 |
0.1 |
15460 |
0.7 |
|
|
|
|
|
|
|
|
|
|
4. |
Errors and Omissions |
–3724 |
–0.2 |
3629 |
0.2 |
–20228 |
–0.9 |
5177 |
0.2 |
|
|
|
|
|
|
|
|
|
|
5. |
Gross Domestic Capital |
|
|
|
|
|
|
|
|
|
Formation (GDCF) |
506244 |
25.9 |
488579 |
24.1 |
474885 |
22.2 |
553731 |
25.0 |
Statement 3: Capital Formation by Type of Institution (Concld.) |
Item |
2003-04 |
2004-05@ |
2005-06* |
|
Amount |
Rate |
Amount |
Rate |
Amount |
Rate |
|
(Rs. crore) |
(Per cent) |
(Rs. crore) |
(Per cent) |
(Rs. crore) |
(Per cent) |
1 |
10 |
11 |
12 |
13 |
14 |
15 |
At Current Prices |
1. |
Gross Capital Formation |
|
|
|
|
|
|
|
(GCF) |
734585 |
26.6 |
927629 |
29.7 |
1147253 |
32.2 |
|
(a) Public Sector |
174597 |
6.3 |
220487 |
7.1 |
264426 |
7.4 |
|
(b) Private Corporate Sector |
191349 |
6.9 |
310045 |
9.9 |
459715 |
12.9 |
|
(c) Household Sector |
344067 |
12.4 |
356043 |
11.4 |
380655 |
10.7 |
|
|
|
|
|
|
|
|
2. |
Gross Fixed Capital |
|
|
|
|
|
|
|
Formation |
687150 |
24.8 |
822786 |
26.3 |
1000760 |
28.1 |
|
|
|
|
|
|
|
|
3. |
Change in Stock |
22863 |
0.8 |
63789 |
2.0 |
104036 |
2.9 |
|
|
|
|
|
|
|
|
4. |
Errors and Omissions |
40538 |
1.5 |
58737 |
1.9 |
57220 |
1.6 |
|
|
|
|
|
|
|
|
5. |
Gross Domestic capital |
|
|
|
|
|
|
|
Formation (GDCF) |
775124 |
28.0 |
986366 |
31.5 |
1204474 |
33.8 |
|
|
|
|
|
|
|
|
|
|
|
At 1999-2000 Prices |
|
|
|
|
|
|
|
|
|
|
|
1. |
Gross Capital Formation |
|
|
|
|
|
|
|
(GCF) |
624680 |
26.0 |
737823 |
28.4 |
870619 |
30.6 |
|
(a) Public Sector |
145240 |
6.0 |
169134 |
6.5 |
195484 |
6.9 |
|
(b) Private Corporate Sector |
160778 |
6.7 |
246348 |
9.5 |
347698 |
12.2 |
|
(c) Household Sector |
297121 |
12.4 |
288468 |
11.1 |
293445 |
10.3 |
|
|
|
|
|
|
|
|
2. |
Gross Fixed Capital |
|
|
|
|
|
|
|
Formation |
588088 |
24.5 |
657317 |
25.3 |
757806 |
26.7 |
|
|
|
|
|
|
|
|
3. |
Change in Stock |
15051 |
0.6 |
46633 |
1.8 |
78821 |
2.8 |
|
|
|
|
|
|
|
|
4. |
Errors and Omissions |
34695 |
1.4 |
46924 |
1.8 |
43329 |
1.5 |
|
|
|
|
|
|
|
|
5. |
Gross Domestic Capital |
|
|
|
|
|
|
|
Formation (GDCF) |
659375 |
27.4 |
784747 |
30.2 |
913948 |
32.2 |
@ : Provisional Estimates. * : Quick Estimates.
Notes :
1. The rates of GCF and its components are computed with respect to GDP at current/constant market prices.
2. GDCF is GCF adjusted for errors and omissions.
Source : Central Statistical Organisation. |
Statement 4: Sectoral Composition of Gross Capital Formation |
(At 1999-2000 Prices) |
Item |
2000-01 |
2001-02 |
2002-03 |
|
Amount(Rs. crore) |
Rate
(Per cent) |
Amount
(Rs. crore) |
Rate
(Per cent) |
Amount
(Rs. crore) |
Rate(Per cent) |
1 |
2 |
3 |
4 |
5 |
6 |
7 |
I. |
Agriculture, forestry and |
45186 |
2.2 |
55806 |
2.6 |
55668 |
2.5 |
|
fishing |
(9.6) |
|
(11.6) |
|
(10.4) |
|
|
a) |
Agriculture |
38735 |
1.9 |
47043 |
2.2 |
46823 |
2.1 |
|
|
|
(8.2) |
|
(9.8) |
|
(8.7) |
|
|
|
|
|
|
|
|
|
|
II. |
Industry |
183077 |
9.0 |
154315 |
7.2 |
204638 |
9.2 |
|
|
|
(38.9) |
|
(32.0) |
|
(38.2) |
|
|
a) |
Mining and quarrying |
5804 |
0.3 |
8366 |
0.4 |
8383 |
0.4 |
|
|
|
(1.2) |
|
(1.7) |
|
(1.6) |
|
|
b) |
Manufacturing |
138330 |
6.8 |
103683 |
4.9 |
157018 |
7.1 |
|
|
|
(29.4) |
|
(21.5) |
|
(29.3) |
|
|
c) |
Electricity, gas and water |
38943 |
1.9 |
42266 |
2.0 |
39237 |
1.8 |
|
|
supply |
(8.3) |
|
(8.8) |
|
(7.3) |
|
|
|
|
|
|
|
|
|
|
III. |
Services |
242431 |
11.9 |
271504 |
12.7 |
275319 |
12.4 |
|
|
|
(51.5) |
|
(56.4) |
|
(51.4) |
|
|
a) |
Trade, hotels and |
20073 |
1.0 |
22967 |
1.1 |
5413 |
0.2 |
|
|
restaurants |
(4.3) |
|
(4.8) |
|
(1.0) |
|
|
b) |
Transport, storage and |
75806 |
3.7 |
58838 |
2.8 |
72609 |
3.3 |
|
|
communication |
(16.1) |
|
(12.2) |
|
(13.6) |
|
|
c) |
Financing, insurance, real |
80089 |
3.9 |
103516 |
4.8 |
101882 |
4.6 |
|
|
estate and business services |
(17.0) |
|
(21.5) |
|
(19.0) |
|
|
d) |
Community, social and |
57366 |
2.8 |
70831 |
3.3 |
78710 |
3.6 |
|
|
personal services |
(12.2) |
|
(14.7) |
|
(14.7) |
|
|
e) |
Construction |
9097 |
0.4 |
15352 |
0.7 |
16705 |
0.8 |
|
|
|
(1.9) |
|
(3.2) |
|
(3.1) |
|
IV. |
Gross Capital Formation |
470694 |
23.2 |
481625 |
22.5 |
535624 |
24.2 |
|
(I+II+III) |
(100.0) |
|
(100.0) |
|
(100.0) |
|
Statement 4: Sectoral Composition of Gross Capital Formation |
(At 1999-2000 Prices) (Concld.) |
Item |
2003-04 |
2004-05@ |
2005-06* |
|
Amount
(Rs. crore) |
Rate
(Per cent) |
Amount
(Rs. crore) |
Rate
(Per cent) |
Amount
(Rs. crore) |
Rate
(Per cent) |
1 |
8 |
9 |
10 |
11 |
12 |
13 |
I. |
Agriculture, forestry and |
53840 |
2.2 |
57253 |
2.2 |
64131 |
2.3 |
|
fishing |
(8.9) |
|
(8.1) |
|
(7.7) |
|
|
a) |
Agriculture |
45132 |
1.9 |
48576 |
1.9 |
54539 |
1.9 |
|
|
|
(7.5) |
|
(6.9) |
|
(6.5) |
|
|
|
|
|
|
|
|
|
|
II. |
Industry |
257785 |
10.7 |
349402 |
13.4 |
436475 |
15.4 |
|
|
|
(42.7) |
|
(49.6) |
|
(52.2) |
|
|
a) |
Mining and quarrying |
13990 |
0.6 |
13348 |
0.5 |
15230 |
0.5 |
|
|
|
(2.3) |
|
(1.9) |
|
(1.8) |
|
|
b) |
Manufacturing |
196008 |
8.2 |
290137 |
11.1 |
373616 |
13.1 |
|
|
|
(32.5) |
|
(41.2) |
|
(44.7) |
|
|
c) |
Electricity, gas and water |
47787 |
2.0 |
45917 |
1.8 |
47629 |
1.7 |
|
|
supply |
(7.9) |
|
(6.5) |
|
(5.7) |
|
|
|
|
|
|
|
|
|
|
III. |
Services |
291515 |
12.1 |
297294 |
11.4 |
336024 |
11.8 |
|
|
|
(48.3) |
|
(42.2) |
|
(40.2) |
|
|
a) |
Trade, hotels and |
19295 |
0.8 |
20302 |
0.8 |
22092 |
0.8 |
|
|
restaurants |
(3.2) |
|
(2.9) |
|
(2.6) |
|
|
b) |
Transport, storage and |
70383 |
2.9 |
80122 |
3.1 |
78595 |
2.8 |
|
|
communication |
(11.7) |
|
(11.4) |
|
(9.4) |
|
|
c) |
Financing, insurance, real |
101587 |
4.2 |
80363 |
3.1 |
90442 |
3.2 |
|
|
estate and business services |
(16.8) |
|
(11.4) |
|
(10.8) |
|
|
d) |
Community, social and |
81754 |
3.4 |
100335 |
3.9 |
128026 |
4.5 |
|
|
personal services |
(13.6) |
|
(14.3) |
|
(15.3) |
|
|
e) |
Construction |
18496 |
0.8 |
16172 |
0.6 |
16869 |
0.6 |
|
|
|
(3.1) |
|
(2.3) |
|
(2.0) |
|
IV. |
Gross Capital Formation |
603140 |
25.1 |
703949 |
27.1 |
836629 |
29.4 |
|
(I+II+III) |
(100.0) |
|
(100.0) |
|
(100.0) |
|
@ : Provisional Estimates. * : Quick Estimates.
Notes
: 1. The rates of GCF and its components are computed with respect to GDP at constant market prices.
2. Figures in parentheses are share of Gross Capital Formation.
Source
: Central Statistical Organisation. |
Statement 5a: Trends in Select Macro-Economic Aggregates |
(At 1999-2000 prices) |
Item |
1999-00 |
2000-01 |
2001-02 |
2002-03 |
|
Amount |
Rate |
Amount |
Rate |
Amount |
Rate |
Amount |
Rate |
|
(Rs. crore) |
(Per cent) |
(Rs. crore) |
(Per cent) |
(Rs. crore) |
(Per cent) (Rs. crore) |
(Per cent) |
1 |
2 |
3 |
4 |
5 |
6 |
7 |
8 |
9 |
I. |
Product Aggregates |
|
|
|
|
|
|
|
|
1. |
GDP at factor cost |
1786525 |
6.4 |
1864773 |
4.4 |
1972911 |
5.8 |
2047732 |
3.8 |
2. |
NDP factor cost |
1600933 |
6.2 |
1666543 |
4.1 |
1760547 |
5.6 |
1820235 |
3.4 |
3. |
GDP at market prices |
1952035 |
7.4 |
2030867 |
4.0 |
2136635 |
5.2 |
2216260 |
3.7 |
4. |
NDP at market prices |
1766442 |
7.3 |
1832637 |
3.7 |
1924270 |
5.0 |
1988762 |
3.4 |
5. |
GNP at factor cost |
1771094 |
6.4 |
1842228 |
4.0 |
1952241 |
6.0 |
2028928 |
3.9 |
6. |
NNP at factor cost |
1585501 |
6.2 |
1643998 |
3.7 |
1739876 |
5.8 |
1801430 |
3.5 |
7. |
GNP at market prices |
1936604 |
7.4 |
2008322 |
3.7 |
2115964 |
5.4 |
2197455 |
3.9 |
8. |
NNP at market prices |
1751011 |
7.3 |
1810092 |
3.4 |
1903599 |
5.2 |
1969957 |
3.5 |
9. |
Per capita NNP at factor cost |
15839 |
4.3 |
16133 |
1.9 |
16762 |
3.9 |
17075 |
1.9 |
II. |
Demand Aggregates |
|
|
|
|
|
|
|
|
1. |
Total Final Consumption |
1506387 |
6.8 |
1540266 |
2.2 |
1622740 |
5.4 |
1651465 |
1.8 |
|
Expenditure |
(77.2) |
|
(75.8) |
|
(75.9) |
|
(74.5) |
|
2. |
Private Final Consumption |
1253643 |
5.7 |
1286314 |
2.6 |
1363797 |
6.0 |
1393435 |
2.2 |
|
Expenditure |
(64.2) |
|
(63.3) |
|
(63.8) |
|
(62.9) |
|
3. |
Government Final |
252744 |
5.3 |
253952 |
0.5 |
258943 |
2.0 |
258030 |
–0.4 |
|
Consumption Expenditure |
(12.9) |
|
(12.0) |
|
(12.1) |
|
(11.6) |
|
4. |
Exports |
227697 |
18.0 |
269241 |
18.2 |
284498 |
5.7 |
346546 |
21.8 |
|
|
(11.7) |
|
(13.3) |
|
(13.3) |
|
(15.6) |
|
5. |
Less: Imports |
265702 |
7.0 |
274975 |
3.5 |
284324 |
3.4 |
313775 |
10.4 |
|
|
(13.6) |
|
(13.5) |
|
(13.3) |
|
(14.2) |
|
6. |
Gross Fixed Capital |
456416 |
7.0 |
457888 |
0.3 |
478587 |
4.5 |
520164 |
8.7 |
|
Formation |
(23.4) |
|
(22.5) |
|
(22.4) |
|
(23.5) |
|
7. |
Change in Stock |
37583 |
|
12807 |
|
3037 |
|
15460 |
|
|
|
(1.9) |
|
(0.6) |
|
(0.1) |
|
(0.7) |
|
8. |
Valuables |
15519 |
|
14256 |
|
13489 |
|
12930 |
|
|
|
(0.8) |
|
(0.7) |
|
(0.6) |
|
(0.6) |
|
9. |
Discrepancies |
–25865 |
|
11384 |
|
18608 |
|
–16530 |
|
|
|
(–1.3) |
|
(0.6) |
|
(0.9) |
|
(–0.7) |
|
Statement 5a: Trends in Select Macro-Economic Aggregates |
(At 1999-2000 prices) (Concld.) |
Item |
2003-04 |
2004-05@ |
2005-06* |
2006-07# |
|
Amount |
Rate |
Amount |
Rate |
Amount |
Rate |
Amount |
Rate |
|
(Rs. crore) |
(Per cent) |
(Rs. crore) (Per cent) (Rs. crore) |
(Per cent) (Rs. crore) |
(Per cent) |
1 |
10 |
11 |
12 |
13 |
14 |
15 |
16 |
17 |
I. |
Product Aggregates |
|
|
|
|
|
|
|
|
1. |
GDP at factor cost |
2222591 |
8.5 |
2389660 |
7.5 |
2604532 |
9.0 |
2848157 |
9.4 |
2. |
NDP factor cost |
1977444 |
8.6 |
2125299 |
7.5 |
2319014 |
9.1 |
2541384 |
9.6 |
3. |
GDP at market prices |
2402247 |
8.4 |
2602235 |
8.3 |
2842478 |
9.2 |
3108360 |
9.4 |
4. |
NDP at market prices |
2157100 |
8.5 |
2337874 |
8.4 |
2556960 |
9.4 |
.. |
.. |
5. |
GNP at factor cost |
2204746 |
8.7 |
2367711 |
7.4 |
2580761 |
9.0 |
2829349 |
9.6 |
6. |
NNP at factor cost |
1959599 |
8.8 |
2103350 |
7.3 |
2295243 |
9.1 |
2522576 |
9.9 |
7. |
GNP at market prices |
2384402 |
8.5 |
2580286 |
8.2 |
2818707 |
9.2 |
.. |
.. |
8. |
NNP at market prices |
2139255 |
8.6 |
2315925 |
|
2533189 |
9.4 |
.. |
.. |
9. |
Per capita NNP at factor cost |
18263 |
7.0 |
19297 |
5.7 |
20734 |
7.4 |
22483 |
8.4 |
II. |
Demand Aggregates |
|
|
|
|
|
|
|
|
1. |
Total Final Consumption |
1753507 |
6.2 |
1847887 |
5.4 |
1981112 |
7.2 |
2112410 |
6.6 |
|
Expenditure |
(73.0) |
|
(71.0) |
|
(69.7) |
|
(68.0) |
|
2. |
Private Final |
1489043 |
6.9 |
1569130 |
5.4 |
1675025 |
6.7 |
1778697 |
6.2 |
|
Consumption Expenditure |
(62.0) |
|
(60.3) |
|
(58.9) |
|
(57.2) |
|
3. |
Government Final |
264464 |
2.5 |
278757 |
5.4 |
306087 |
9.8 |
333713 |
9.0 |
|
Consumption Expenditure |
(11.0) |
|
(10.7) |
|
(10.8) |
|
(10.7) |
|
4. |
Exports |
366729 |
5.8 |
469902 |
28.1 |
497683 |
5.9 |
540721 |
8.6 |
|
|
(15.3) |
|
(18.1) |
|
(17.5) |
|
(17.4) |
|
5. |
Less: Imports |
366445 |
16.8 |
411535 |
12.3 |
453922 |
10.3 |
505871 |
11.4 |
|
|
(15.3) |
|
(15.8) |
|
(16.0) |
|
(16.3) |
|
6. |
Gross Fixed Capital Formation |
588088 |
13.1 |
657317 |
11.8 |
757806 |
15.3 |
868618 |
14.6 |
|
|
(24.5) |
|
(25.3) |
|
(26.7) |
|
(27.9) |
|
7. |
Change in Stock |
15051 |
|
46633 |
|
78821 |
|
86840 |
|
|
|
(0.6) |
|
(1.8) |
|
(2.8) |
|
(2.8) |
|
8. |
Valuables |
21541 |
|
33873 |
|
33992 |
|
46921 |
|
|
|
(0.9) |
|
(1.3) |
|
(1.2) |
|
(1.5) |
|
9. |
Discrepancies |
23776 |
|
–41842 |
|
–53014 |
|
–41279 |
|
|
|
(1.0) |
|
(–1.6) |
|
(–1.9) |
|
(–1.3) |
|
@ : Provisional Estimates. * : Quick Estimates. # : Revised Estimates.
.. : Not Available.
Valuables : Expenditure made on acquisition of valuables, excluding work of art and antiques.
Note : Figures in parentheses are percentage of GDP at constant market prices.
Source : Central Statistical Organisation. |
Statement 5b: Trends in Select Macro-Economic Aggregates |
(At current prices) |
Item |
1999-00 |
2000-01 |
2001-02 |
2002-03 |
|
Amount
(Rs. crore) |
Rate
(Per cent) |
Amount
(Rs. crore) |
Rate
(Per cent) |
Amount
(Rs. crore) |
Rate
(Per cent) |
Amount
(Rs. crore) |
Rate
(Per cent) |
1 |
2 |
3 |
4 |
5 |
6 |
7 |
8 |
9 |
I. |
Product Aggregates |
|
|
|
|
|
|
|
|
1. |
GDP at factor cost |
1786525 |
10.5 |
1925415 |
7.8 |
2100187 |
9.1 |
2265304 |
7.9 |
2. |
NDP at factor cost |
1600932 |
15.6 |
1719120 |
7.4 |
1867735 |
8.6 |
2010536 |
7.6 |
3. |
GDP at market prices |
1952035 |
11.5 |
2102375 |
7.7 |
2281058 |
8.5 |
2458084 |
7.8 |
4. |
NDP at market prices |
1766442 |
11.5 |
1896080 |
7.3 |
2048606 |
8.0 |
2203316 |
7.6 |
5. |
GNP at factor cost |
1771094 |
10.6 |
1902682 |
7.4 |
2080119 |
9.3 |
2248614 |
8.1 |
6. |
NNP at factor cost |
1585501 |
10.5 |
1696388 |
7.0 |
1847667 |
8.9 |
1993846 |
7.9 |
7. |
GNP at market prices |
1936604 |
11.5 |
2079642 |
7.4 |
2260990 |
8.7 |
2441394 |
8.0 |
8. |
NNP at market prices |
1751011 |
11.5 |
1873347 |
7.0 |
2028538 |
8.3 |
2186626 |
7.8 |
9. |
Per capita NNP at factor cost |
15839 |
8.5 |
16648 |
5.1 |
17800 |
6.9 |
18899 |
6.2 |
II. |
Demand Aggregates |
|
|
|
|
|
|
|
|
1. |
Total Final Consumption |
1506387 |
12.7 |
1605510 |
6.6 |
1745370 |
8.7 |
1835193 |
5.1 |
|
Expenditure |
(77.2) |
|
(76.4) |
|
(76.5) |
|
(74.7) |
|
2. |
Private Final Consumption |
1253643 |
11.8 |
1340109 |
6.9 |
1463247 |
9.2 |
1543873 |
5.5 |
|
Expenditure |
(64.2) |
|
(63.7) |
|
(64.1) |
|
(62.8) |
|
3. |
Government Final |
252744 |
17.3 |
265401 |
5.0 |
282123 |
6.3 |
291320 |
3.3 |
|
Consumption Expenditure |
(12.9) |
|
(12.6) |
|
(12.4) |
|
(11.9) |
|
4. |
Exports |
227697 |
16.6 |
278126 |
22.1 |
290757 |
4.5 |
355556 |
22.3 |
|
|
(11.7) |
|
(13.2) |
|
(12.7) |
|
(14.5) |
|
5. |
Less: Imports |
265702 |
18.2 |
297523 |
12.0 |
311050 |
4.5 |
379981 |
22.2 |
|
|
(13.6) |
|
(14.2) |
|
(13.6) |
|
(15.5) |
|
6. |
Gross Fixed Capital |
456416 |
|
478317 |
|
525452 |
|
584366 |
|
|
Formation |
(23.4) |
|
(22.8) |
|
(23.0) |
|
(23.8) |
|
|
|
|
|
|
|
|
|
|
|
7. |
Change in Stock |
37583 |
|
13140 |
|
3923 |
|
16356 |
|
|
|
(1.9) |
|
(0.6) |
|
(0.2) |
|
(0.7) |
|
8. |
Valuables |
15519 |
|
14724 |
|
14187 |
|
13957 |
|
|
|
(0.8) |
|
(0.7) |
|
(0.6) |
|
(0.6) |
|
9. |
Discrepancies |
-25865 |
|
10081 |
|
12419 |
|
32637 |
|
|
|
(-1.3) |
|
(0.5) |
|
(0.5) |
|
(1.3) |
|
Statement 5b: Trends in Select Macro-Economic Aggregates |
(At current prices) (Concld.) |
Item |
2003-04 |
2004-05@ |
2005-06* |
2006-07# |
|
|
Amount |
Rate |
Amount |
Rate |
Amount |
Rate |
Amount |
Rate |
|
|
(Rs. crore) |
(Per cent) |
(Rs. crore) |
(Per cent) |
(Rs. crore) |
(Per cent) |
(Rs. crore) |
(Per cent) |
1 |
|
10 |
11 |
12 |
13 |
14 |
15 |
16 |
17 |
I. |
Product Aggregates |
|
|
|
|
|
|
|
|
1. |
GDP at factor cost |
2549418 |
12.5 |
2855933 |
12.0 |
3250932 |
13.8 |
3743472 |
15.2 |
2. |
NDP at factor cost |
2264715 |
12.6 |
2523442 |
11.4 |
2871731 |
13.8 |
3317442 |
15.5 |
3. |
GDP at market prices |
2765491 |
12.5 |
3126596 |
13.1 |
3567177 |
14.1 |
4125725 |
15.7 |
4. |
NDP at market prices |
2480788 |
12.6 |
2794105 |
12.6 |
3187976 |
14.1 |
.. |
.. |
5. |
GNP at factor cost |
2531168 |
12.6 |
2833558 |
11.9 |
3225963 |
13.8 |
3722669 |
15.4 |
6. |
NNP at factor cost |
2246465 |
12.7 |
2501067 |
11.3 |
2846762 |
13.8 |
3296639 |
15.8 |
7. |
GNP at market prices |
2747241 |
12.5 |
3104221 |
13.0 |
3542208 |
14.1 |
.. |
.. |
8. |
NNP at market prices |
2462538 |
12.6 |
2771730 |
12.6 |
3163007 |
14.1 |
.. |
.. |
9. |
Per capita NNP at factor cost |
20936 |
10.8 |
22946 |
9.6 |
25716 |
12.1 |
29382 |
14.3 |
|
|
|
|
|
|
|
|
|
|
II. |
Demand Aggregates |
|
|
|
|
|
|
|
|
1. |
Total Final Consumption |
2020024 |
10.1 |
2208187 |
9.3 |
2469149 |
11.8 |
2795033 |
13.2 |
|
|
(73.0) |
|
(70.6) |
|
(69.2) |
|
(67.7) |
|
2. |
Private Final Consumption |
1709389 |
10.7 |
1865645 |
9.1 |
2064638 |
10.7 |
2327331 |
12.7 |
|
Expenditure |
(61.8) |
|
(59.7) |
|
(57.9) |
|
(56.4) |
|
3. |
Government Final |
310635 |
6.6 |
342542 |
10.3 |
404511 |
18.1 |
467702 |
15.6 |
|
Consumption Expenditure |
(11.2) |
|
(11.0) |
|
(11.3) |
|
(11.3) |
|
4. |
Exports |
407803 |
14.7 |
569051 |
39.5 |
725124 |
27.4 |
947868 |
30.7 |
|
|
(14.7) |
|
(18.2) |
|
(20.3) |
|
(23.0) |
|
5. |
Less: Imports |
443398 |
16.7 |
625945 |
41.2 |
830678 |
32.7 |
1064606 |
28.2 |
|
|
(16.0) |
|
(20.0) |
|
(23.3) |
|
(25.8) |
|
6. |
Gross Fixed Capital |
687150 |
|
822786 |
|
1000760 |
|
1216552 |
|
|
Formation |
(24.8) |
|
(26.3) |
|
(28.1) |
|
(29.5) |
|
|
|
|
|
|
|
|
|
|
|
7 |
Change in Stock |
22863 |
|
63789 |
|
104036 |
|
120620 |
|
|
|
(0.8) |
|
(2.0) |
|
(2.9) |
|
(2.9) |
|
8. |
Valuables |
24572 |
|
41054 |
|
42457 |
|
61138 |
|
|
|
(0.9) |
|
(1.3) |
|
(1.2) |
|
(1.5) |
|
9 |
Discrepancies |
46477 |
|
47674 |
|
56329 |
|
49120 |
|
|
|
(1.7) |
|
(1.5) |
|
(1.6) |
|
(1.2) |
|
@ : Provisional Estimates. * : Quick Estimates.
# : Revised Estimates. .. : Not Available.
Valuables : Expenditure made on acquisition of valuables, excluding work of art and antiques.
Note : Figures in parentheses are percentage of GDP at current market prices.
Source : Central Statistical Organisation. |
|


