
Small Borrowal Accounts of Scheduled Commercial Banks: 2014 - আরবিআই - Reserve Bank of India


Small Borrowal Accounts of Scheduled Commercial Banks: 2014
The Basic Statistical Returns (BSR) system, from March 2013 survey onwards captures account-wise details of all credit accounts through BSR-1 return. In the earlier years such details were collected for Large Borrowal Accounts and periodic sample surveys were separately conducted to obtain a profile of Small Borrowal Accounts (SBA). The results of last such survey conducted with March 31, 2008 as the reference date were published in the RBI Bulletin, May 2011 issue. With the collection of account-level data for all credit accounts in BSR-1, detailed information on borrowal accounts each with credit limit of ₹0.2 million or less (referred to as Small Borrowal Accounts) is now available. This article presents an analysis of small borrowal accounts based on BSR-1 survey as on March 31, 2014 with comparable position as on March 31, 20131. In March 2014, out of 138.8 million borrowal accounts with scheduled commercial banks (including regional rural banks), 109.2 million accounts had credit limit up to ₹200,000 (SBAs) and accounted for 78.7 per cent of all borrowal accounts. However, in terms of amount outstanding their share was 8.4 per cent in total outstanding credit. Majority of small borrowal accounts pertains to household sector, particularly individuals, and is concentrated in a few sectors such as agriculture, small business, retail trade and personal loans. The article presents features of small borrowal accounts in terms of different classificatory characteristics viz., type of account, sector, organisational category, interest rate, loan quality, borrower-category and population groups. I. Introduction: 1. The Basic Statistical Returns System, in vogue since 1972, captured information on credit of scheduled commercial banks (SCBs) in two parts - detailed account level information through the BSR-1A return in respect of large accounts (accounts with credit limit above a cut-off limit) and branch level credit data consolidated on various parameters through BSR-1B return. The cut-off limit was periodically revised in line with the developments in banking and keeping in view the reporting requirements on banks. The cut-off limit for bifurcation between BSR 1A and 1B, was ₹10,000 up to 1983 and thereafter it was revised to ₹25,000. The cut-off limit was increased to ₹200,000 from 1999 and stood at that level up to 2012. In order to bridge the information gap, periodic surveys of small borrowal accounts were conducted and the salient results were published in the RBI Bulletin. The results of last such survey conducted with March 2008 as the reference date were published in the May 2011 issue of the RBI Bulletin. With the availability of advanced computing facilities, from March 2013 the BSR-1 return captures account level information of all the credit accounts with SCBs, irrespective of the credit limit and consolidated reporting under BSR-1B return has been discontinued. 2. This article is based on detailed account level data for all credit accounts of SCBs as obtained from BSR-1 return for March 2013 and 2014. The Section II presents a general profile of SBA over the years. In Section III, a comparison of salient features of SBA and all credit accounts is made according to different classificatory characteristics. In Section IV, an analysis of position of SBA is presented for March 2013 and March 2014. II. Small Borrowal Accounts: At a glance: 3. BSR data over the past fifteen years show that share of SBA in total credit has fallen significantly in terms of both number of accounts and amount outstanding (Chart 1, Table 1). While the number SBA in March 2014 was little over two times the number in March 1999, the large borrowal accounts (each with credit limit of over ₹0.2 million) grew by over 22 times during the fifteen year period. 4. The share of number of SBA accounts has fallen from 97.5 per cent in 1999 to 78.7 per cent in 2014. The average amount per account has increased from ₹17.3 thousand to ₹48.2 thousand in the case of SBA, whereas for all accounts it has increased from ₹73.1 thousand to ₹452.8 thousand. It shows large loans have increased significantly capturing higher share in total credit. Consequently, the share of SBAs in outstanding amount has fallen from 23.1 per cent in March 1999 to 8.4 per cent in March 2014 (Table 1). III. Comparison of Small Borrowal accounts with all Borrowal accounts: March 2014: III.1. Type of account 5. About 90 per cent of all accounts, in terms of number, in respect of Demand loans (including Kisan credit cards and other credit cards) was for small borrowers in March 2014 (Table 2). On the other hand, in Long term loans and others (Packing credit, bills etc.), the SBAs had relatively lower shares at 55.5 per cent and 41.4 per cent, respectively, which is in alignment with the fact that these are mainly business and corporate loans which are expected to be of large size. 6. In terms of amount, the SBAs had a share of about 60 per cent of outstanding credit in the ‘Kisan Credit cards (KCC)’ and ‘Credit cards other than KCC’ types of accounts, reflecting that majority of the credit cards loans are of low denominations. 33.4 per cent of amount outstanding in demand loans pertained to SBAs. In the case of Cash credits, Overdrafts and Long term loans, the SBAs had a share in the 3-4 per cent range. 7. While long terms loans (41.1 per cent) and cash credit accounts (19.6 per cent) had larger shares in total credit (covering all accounts), in the case of SBAs, Demand loans (56.2 per cent) and Long term loans (20.6 per cent) accounted for a major portion of the outstanding amount (Table 2). III.2: Occupation 8. In the case of credit to agriculture (both direct and indirect), 86.6 per cent of accounts, with 41.2 per cent of amount outstanding were small accounts in March 2014. In the case of personal loans, retail trade and professional services sectors, SBAs predominated in number of accounts with 68 to 78 per cent share, and in the case of personal loans accounted for about one-fourth of the outstanding credit. For housing, SBA had a share of 25 per cent in number of accounts, but 1.9 per cent in amount outstanding indicating that housing loans are mostly in higher denominations (Table 3). 9. Across all SBAs, the share of credit to agriculture (direct and indirect) was highest with 65.8 per cent share, followed distantly by personal loans (22.0 per cent). In contrast, 41.6 per cent of total credit was accounted for by industry sector and only 13.4 per cent by agriculture sector. III.3: Organisation 10. Over four-fifths of the credit accounts of ‘Household-Individuals’ were SBA accounting for nearly one-fourth (24.3 per cent) of the amount outstanding against individuals in March 2014 (Table 4). About 56.8 per cent accounts of co-operative sector were SBA though in terms of amount outstanding their share was negligible (0.7 per cent). In the case of ‘Household- Others’, 36.5 per cent of the accounts belonged to SBA category, while about 27.6 per cent of loan accounts of private corporate sector were in this category. 11. The ‘Household-Individuals’ sector, with 106 million SBAs, had a dominant share in all SBAs and accounted for 96.8 per cent of the credit outstanding of SBAs in March 2014. In contrast, in respect of total credit, ‘Private Corporate sector’ with 37.6 per cent share was the largest segment, followed closely by ‘Household-Individuals’ with a share of 33.4 per cent of the credit outstanding (Table 4). III.4: Interest rate 12. In terms of number of accounts, 94.4 per cent and 90.8 per cent of credit accounts in extreme interest rate categories, i.e., with interest rate ranges ‘below 6 per cent’ and ‘20 per cent and above’, respectively, were SBAs. In terms of amount outstanding, in interest range ‘6 per cent to 9 per cent’ category, 46.0 per cent of credit outstanding pertained to SBAs, and 41.3 per cent of outstanding credit with interest ‘20 per cent and above’ was that of SBAs. The higher rate SBAs mainly pertained to personal credit card segment. In the case of SBAs, while about 30 per cent of the credit outstanding was in the interest rate range of ‘6 per cent to 9 per cent’ and another 37 per cent in ‘10 per cent to 13 per cent’ range, the distribution of total credit indicated that about 60 per cent of total credit outstanding was in ‘10 per cent to 13 per cent’ interest rate range (Table 5). 13. Overall ‘Weighted Average Lending rate (WALR)’ of ‘All accounts’ and SBAs were at same level around 12.00 per cent. However, excluding personal Credit Cards (other than KCC), the WALR of SBAs was lower at 11.13 per cent compared to 11.89 per cent for ‘All accounts’ taken together. III.5: Asset quality 14. The shares of SBAs in all accounts classified as standard assets as at end March 2014 were 77.9 per cent in terms of number of accounts and 8.2 per cent in terms of amount outstanding, which were marginally lower than share of all SBAs in all accounts. In terms of number, higher proportion (86.3 per cent to 90.3 per cent) of all accounts classified as NPAs were SBAs (Table 6). 15. The amount of loans classified as standard assets was 95.9 per cent in the case of all accounts while it was lower at 94.0 per cent in the case of SBAs. Across each of the NPA category, the SBAs had higher share compared to all accounts, both in terms of number and outstanding amount (Table 6). III.6: Category of borrower 16. Accounts of ‘Small/Marginal Farmers/Labors/ Sharecroppers’ and ‘Other farmers/ borrowers in agriculture & allied activities’ categories were predominantly (80-90 per cent) under the SBA group (Table 7). SBAs of ‘Small/Marginal Farmers/Labors/ Sharecroppers’ accounted for 58.0 per cent of credit outstanding against all borrowal accounts under this category, and had a share of about 90 per cent in terms of number of accounts. SBAs of ‘Other farmers/ borrowers in agriculture & allied activities’ category had a share of 31.0 per cent in terms of amount outstanding and 81.2 per cent in number terms in all accounts under this category. 17. In terms of amount outstanding, while one-third share of all accounts pertained to large enterprises, in the case of SBAs identical share was held by ‘Small/ Marginal Farmers/ Labors/Sharecroppers’ category of borrowers, followed by ‘Other farmers/ borrowers in agriculture & allied activities’ category with 27.7 per cent share (Table 7). III.7: Population groups 18. In rural population group centres, 87.2 per cent of all credit accounts were SBAs and shared about 42 per cent of the credit outstanding (Table 8). On the other end, in metropolitan centres, 1.3 per cent of outstanding credit pertained to SBAs, although in terms of number these accounts had 72.3 per cent share. 19. In the case of all credit accounts, 8 -11 per cent of the credit was extended in rural and semi-urban areas, while in the case of SBAs, these areas had a share of 35 - 42 per cent range (Table 8). IV. Comparative picture of March 2014 with March 2013 surveys: 20. In March 2013, Agriculture (direct and indirect) accounted for 57.3 per cent share in amount outastanding in all SBAs, which increased to 65.8 per cent in March 2014. During the same period, the share of ‘Industry’ and ‘housing loan’ in outstanding amount of SBAs declined from 4.8 per cent and 3.8 per cent to 1.4 per cent and 1.9 per cent respectively (Table 9). In March 2014, ‘Term loans’ accounted for 33.9 per cent of outstanding loan amount of SBAs compared to 31.6 per cent a year ago (Table 10). The share of ‘Household- Individuals’ in outstanding loan amount increased to 96.8 per cent in March 2014 from 94.1 per cent in March 2013 (Tables 11). 21. The ‘Weighted Average Lending rate (WALR) of SBAs had increased by 41 basis points to 12.00 per cent in March 2014 compared to 11.59 per cent an year ago. WALR of Personal Credit Cards (other than KCC) had increased by 224 basis points over the year. Excluding credit cards, WALR of SBAs increased by 24 bps to 11.13 per cent in 2014 from 10.89 per cent a year ago (Table 12). 22. The share of standard assets, in terms of outstanding amount, amongst the SBAs increased from 92.7 in March 2013 to per cent to 94.0 per cent in March 2014, indicating improvement in asset quality (Table 13). Two-thirds of the SBAs were in rural and semi-urban centres both in March 2013 and 2014, with a share of 76.4 per cent of credit outstanding in such accounts in March 2014 (compared to70.5 per cent share a year ago) (Table 14). * Prepared in the Banking Statistics Division of the Department of Statistics and Information Management, Reserve Bank of India, Mumbai. 1 Detailed data on BSR-1 surveys for March 2013 and 2014 are available in the annual publication ‘Basic Statistical Returns of Scheduled Commercial Banks in India’, Volume 42 & 43. The Volume also provides select data on SBA. |
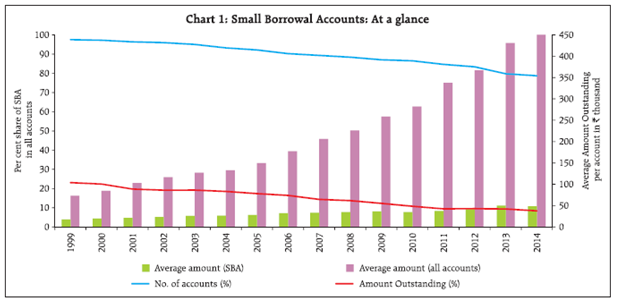

এই পেজটি শেয়ার করুন:


রিজার্ভ ব্যাঙ্ক অফ ইন্ডিয়া মোবাইল অ্যাপ্লিকেশন ইনস্টল করুন এবং সাম্প্রতিক সংবাদগুলিতে দ্রুত অ্যাক্সেস পান!


