 IST,
IST,


RBI WPS (DEPR): 08/2024: Vegetables Inflation in India: A Study of Tomato, Onion and Potato (TOP)
|
Vegetables Inflation in India: A Study of Tomato, Onion and Potato (TOP) Ranjana Roy, Sanchit Gupta, Harsh Wardhan, Suvendu Sarkar, Soumasree Tewari, Rohan Bansal, Shelja Bhatia and Ashok Gulati1 Abstract This paper delves into the price dynamics of tomato, onion and potato (TOP) in India. These commodities, despite a modest weight in the consumer price index (CPI), significantly impact food and headline inflation due to their high price volatility. The paper assesses the value chains associated with these commodities and estimates the farmers’ share in the final consumer price using secondary and primary sources of information. The farmers’ share in the consumer rupee is estimated at around 33 per cent for tomato, 36 per cent for onion and 37 per cent for potato. The paper also presents a novel framework of monthly balance sheets to capture supply-demand dynamics for analysing determinants of prices of TOP. The empirical analysis suggests a significant negative relationship between monthly availability/availability to usage ratio and CPI of the three vegetables while controlling for other factors like input costs, rainfall and wages. Seasonal Autoregressive Integrated Moving Average with Exogenous Variable (SARIMAX) models incorporating the balance sheet variables perform better compared to other models in forecasting TOP inflation over different forecast horizons. JEL Classification: E31, E37, E52, Q11, Q18 Key Words: Balance Sheet, Forecast, Inflation, Vegetables, SARIMAX, Value Chain, Tomato, Onion, Potato Prices Introduction As in many other countries, India experienced high inflation after the onset of the pandemic and the Ukraine war amid overlapping supply shocks. The key factors that have shaped these inflation dynamics in India are high and volatile food price inflation as well as high share of food in the consumer price index (CPI) basket. As the food group constitutes 45.9 per cent of the CPI basket in India, supply shocks, including excess/ deficient rains, can impact agricultural production, impart considerable volatility to headline inflation and make it difficult to achieve the inflation target on a continuous basis. High and volatile food inflation also has potential implications for inflation expectations and wages. A study by Bhattacharya and Sengupta (2015) shows that the bottom three income deciles, spending more than 55 per cent of their expenditure on food - both in rural as well as urban areas - are severely affected by food price inflation. A study by Anand et al. (2015) highlights that in India, elevated food price inflation translates into wage pressure and higher core (CPI excluding food and fuel) inflation rapidly, making it a challenge for policy makers to contain inflation through monetary policy measures. A thorough analysis of the nature, composition and drivers of food price inflation is essential to contain inflation within an acceptable level. A study by Gulati and Saini (2013) shows that expanding fiscal deficit, burgeoning farm wages and spill over of global food inflation are the key factors driving food inflation in India. The study also finds that with increase in income, people divert from cereal-based diet towards protein-based diets, fruits and vegetables. Dua and Goel (2021) empirically show that inflation expectations, output gap, rate of growth of money supply, exchange rate, fiscal deficit, minimum support prices (MSPs), rainfall, and international energy and food prices are the primary determinants of inflation. A study by Sasmal (2015), based on a general equilibrium model, concludes that uneven growth across sectors has led to high food price inflation. A steady increase in per capita income led to increase in demand for food items but a slower growth in agriculture failed to fulfil the growing demand. Nair and Epon (2012) found that commodities like pulses, fruits, vegetables, meat, and spices experienced surge in prices due to supply-side constraints, while cost escalation resulted in increase in prices of milk and eggs. Tomato, onion and potato (TOP) are amongst the largest produced and consumed vegetables in India. They exhibit significant volatility in prices due to short seasonal cropcycles, perishability, and regional concentration of production as well as sensitivity of the crops to the evolving weather conditions. Despite a combined weight of just 4.8 per cent in the CPI food and beverages group and 2.2 per cent in CPI combined (Base: 2012=100), TOP contributes substantially to the variance of food and headline inflation, and hence there is a growing interest in understanding their price dynamics. There are supply side factors which affect the price movement due to agro-climatic risk, drought or flood, level of minimum support prices (MSPs) and fluctuations in key input costs like oil and fertilisers. The demand side factors include rising per capita income, increase in monthly per capita expenditure, relative prices of a substitute or complementary good, etc. The outbreak of COVID-19, followed by the country-wide lockdown in 2020, exposed the bottlenecks in the supply chains and marketing infrastructure in the country for TOP (Estupinan et al., 2020). In the flush season, farmers are often seen discarding their crops or resorting to distress sale when prices drop way below their production costs. On the other hand, in the lean season, consumers face higher price pressures. This boom-and-bust cycle of TOP is due to the inefficient marketing system and lack of well-integrated value chains with a widening gap between what farmers receive and what consumers pay (Gulati and Wardhan, 2019; Chengappa et.al. 2012 and Birthal et.al. 2019). The study by Gulati and Saini (2013) emphasised the need to increase the supply responses and correct the anomalies in the supply chains by allocating large investment in agriculture research and development (R&D) in the areas of high yielding varieties of seeds, irrigation, logistics, processing plants and so on. Another study by Ganguly and Gulati (2013) pointed out that rising price pressures of high value commodities resulting from increasing demand can be corrected by streamlining the supply chains. Against this background, the present study attempts to identify key factors determining prices of tomato, onion and potato, and provide insights into the changing market scenario and the role of supply management measures to contain inflation. Better assessment of TOP inflation assumes greater importance for forecasting food and headline inflation, as they contribute the most to their volatility. Accordingly, the main objectives of the paper are: a) To create a dynamic balance sheet for tomato, onion and potato covering supply and demand on a monthly basis and to evaluate patterns of market responses, particularly the behaviour of farmers, traders, importers, stockists and consumers; b) To empirically estimate determinants of tomato, onion and potato prices, using the balance sheet variable along with macro and commodity specific variables; c) To forecast inflation in TOP for up to 12 months ahead and assess the performance of the different forecasting models; d) To understand the value chains of the three TOP vegetables for stabilising prices as well as raising farmers’ share in the consumer rupee. The paper constructs state-wise monthly balance sheets of major producing states and then an all-India monthly balance sheet using annual production data, monthly arrivals, sales pattern, and post-harvest losses on the supply side, and estimating monthly demand series from the annual consumption expenditure data, available up to 2011-122 and extrapolated by using the behavioural approach of the Working Group Report of NITI Aayog (2018), on the demand side. The balance sheet variables are used in Autoregressive Distributed Lag (ARDL) models for the three vegetables to study their underlying price dynamics controlling for input costs, rainfall and wages. The results show that availability inversely impacts the CPI of onions and potatoes, while the availability to usage ratio negatively influences CPI of tomatoes. Moreover, in case of onion, the rainfall deviation from the long-term average in the major producing region (i.e., Nashik) significantly impacts onion prices. Additionally, an increase in the relative price of other vegetables measured using vegetable price index increases the prices of potatoes and onions. The study further attempts to forecast inflation for TOP using univariate and multivariate time series models, integrating variables which are identified as significant in the ARDL model. The analysis finds that Seasonal Autoregressive Integrated Moving Average with Exogenous Variable (SARIMA-X) models incorporating the balance sheet variables perform better compared to other models in forecasting inflation over different forecast horizons. The value chain analysis of the three vegetables suggests that farmers are getting around one third of the price that a consumer is paying; the rest is apportioned by the wholesalers and retailers. Marketing reforms, storage solutions, enhancing processing capacity, and raising yields through higher R&D investments in developing climate resistant varieties and innovative cultivation techniques would be critical for improving the value chains, increasing farmers’ share in consumer rupee and containing price volatility. The rest of the paper is organised into six sections. Section II discusses the stylised facts related to TOP vegetables including trends in production, consumption, trade, value chains, inflation and seasonality of their prices and an overview of supply management measures adopted by the government over the last decade. Section III presents in detail the extensive literature on TOP inflation in India. To analyse factors that affect prices, there is a need to understand the stakeholders in the value-chain and decipher the way their behaviour impacts market supply and demand. Section IV traces the stakeholders in TOP value-chain and records their activities as well as calculate price mark-ups in the value chain. Section V discusses the data sources used in the analysis. Section VI discusses the methodology used to understand factors which influence TOP prices as well as the methodology to forecast inflation over the 12-month horizon for these commodities. Section VII concludes and provides some policy suggestions to contain TOP price volatility. Food inflation has remained one of the most volatile components of headline inflation making it extremely challenging to forecast the inflation path (Chart 1). Volatility in food inflation, in turn, has often mirrored fluctuations in vegetable prices which has one of the highest contributions in the movement of food inflation in India (Chart 2). II.1. Domestic Production and Consumption of Vegetables Within vegetables, tomato, onion, and potato (TOP) are the three principal crops in terms of production as well as consumption. There has been a dramatic increase in the production of these three crops in the past few years. In 2022-23 the production of tomato, onion, and potato was 20.4 million metric tonne (MMT), 30.2 MMT and 60.1 MMT, respectively (Chart 3). India has now become the second largest producer of tomato and potato in the world, contributing 11 per cent, and 15 per cent of world production in 2022, respectively (FAO, 2024). In 2021, India surpassed China as the largest onion producing country in the world and retained its position in 2022 with a share of 28.6 per cent in global production (FAOSTAT, 2024). The sharpest increase of 63 per cent in production was witnessed in the case of onion from 2013-14 to 2021-22. Consequently, there has been a significant increase in the share of TOP in the gross value of output (GVO) of fruits and vegetables in real terms, underscoring the importance of these three principal crops in India’s output (Chart 4). Production of TOP, however, has been quite diverse across states which often impacts the supply dynamics and overall availability in the market, thus influencing their prices. The major tomato producing states viz. Andhra Pradesh, Madhya Pradesh, Karnataka, Gujarat, Tamil Nadu and West Bengal together account for 57 per cent of total production (Chart 5). The transplanting and harvesting months also vary across states, with major production (67 per cent) coming from rabi months. In states like Andhra Pradesh, Gujarat and Maharashtra, tomato is produced almost round the year. In other producing states like Karnataka and Madhya Pradesh, peak season approaches during the months of August-October and October-December respectively, while in West Bengal and Uttar Pradesh most of the harvesting takes place during the months of November-January. Between 2014-15 and 2022-23, tomato yield increased from 21.3 tonnes per hectare to 24.0 tonnes per hectare. State wise, while yield in Andhra Pradesh increased from 27.3 tonnes per hectare to 43.3 tonnes per hectare, other major producing states witnessed a decline in yield. There has been a sharp increase in the production of onion from 18.9 MMT in 2014-15 to 30.2 MMT in 2022-23. This is the result of expansion in the area under production from 11.7 lakh hectare (ha) in 2014-15 to 17.4 lakh ha in 2022-23. The major onion producing states are Maharashtra [with a share of 41 per cent in the triennium (TE) ending 2022-23], Madhya Pradesh (16 per cent), Karnataka (9 per cent), Gujarat (7 per cent), and Rajasthan (5 per cent), and these states together contribute about 80 per cent of India’s production (Chart 6). Onion has three crop harvesting cycles, March to May (rabi), October to December (kharif) and January to March (late kharif), with major crop (77 per cent) arriving in the rabi season. Potato production in India increased from 48.0 MMT in 2014-15 to 60.1 MMT in 2022-23. The major share of harvest is concentrated in the rabi months with Uttar Pradesh (32 per cent), West Bengal (24 per cent), Bihar (16 per cent) and Gujarat (7 per cent) being the highest producing states, contributing around 80 per cent of total production (Chart 7). There has been an increase in the area under production from 20.7 lakh ha in 2014-15 to 23.3 lakh ha in 2022-23. On the demand side, vegetables are an essential part of household consumption basket and have consistently been a stable source of private consumption expenditure, reflecting steady demand commensurate with changing expenditure pattern over the years (Chart 8). II.2. External Trade in Vegetables and TOP Significant growth in domestic production has also led to increase in vegetable exports with a contribution of 70 per cent from TOP exports, particularly, onion exports of 2.6 MMT in 2022-23 (Charts 9 and 10). Onion exports account for 8.6 per cent of total production, with main export destinations being Bangladesh, Nepal, Sri Lanka and Singapore. However, potato and tomato account for only 2 per cent of global exports, as they mostly cater to domestic demand. II.3. Changing Market Dynamics in TOP and Role of Supply Management Measures Tomato, onion, and potato form the sacred triune of Indian cooking. The volatility in TOP prices has underscored the importance of making the TOP value chain more efficient. In 2018-19, a scheme “Operation Greens” was launched by the Ministry of Food Processing Industries (MoFPI) for TOP with the main objectives of ensuring better value realisation for TOP farmers, minimising post-harvest losses, and reducing price volatility for producers and consumers. The scheme focused on developing Farmer Producers Organisations (FPOs), Agri-logistics and Processing facilities where projects are authorised on the basis of applications received from investors. For both transportation and storage, 50 per cent subsidy is contributed by MoFPI. The long-term measures target to build an integrated value chains for TOP where grants-in-aid of 50 per cent (70 per cent in case of FPOs) is issued to project implementing agencies. The current market scenario of horticulture crops, however, is still plagued by fragmented value chains, price volatility, post-harvest losses and other market inefficiencies. The production of onion has increased steadily since 2002-03 and fluctuations in production have also minimised (Chand and Saxena, 2017), but onion prices have seen extreme volatility across time and space. It has been observed that onion prices spike around the months of September/October almost every year due to production seasonality, with this acceleration observed to be more severe every alternate year. Similar trend has been experienced for tomato and potato as well. During the rabi season of 2022, the Government built a buffer stock of 2.5 lakh MT of onion with the objective of stabilising retail prices during the lean season. Out of this stock, around 54,000 tonnes of onion were distributed in several markets across 14 states/Union Territories till October 2022 (PIB, October 2022). Moreover, onions were supplied to various retail outlets like Mother Dairy, Safal, and Kendriya Bhandar. Other steps include setting up of the Price Stabilisation Fund (PSF) for TOP vegetables with a dual objective of protecting consumers’ and farmers’ interests. The buffer stock helps in moderating prices during the lean season. In contrast to this, in the aftermath of the sharp plunging of the late kharif onion prices owing to the massive production, the Maharashtra government declared ex-gratia of ₹300 a quintal to the onion farmers in March 2023 and bore the burden of ₹340 crore for the procurement of 1.89 million tonnes. The Government has also imposed stocking limits for onion and potato from time-to-time under the Essential Commodities Act, 1955 to address the artificial scarcity in the market and improve availability. The steady increase in production of TOP has helped fight price rise owing to supply shocks. However, production variation alone cannot fully explain inflation in TOP prices. The post-harvest value chain is fragmented with many intermediaries which often gives them the opportunity to exploit supply-induced scarcity. II.4. TOP Price Behaviour and Trend of Inflation Vegetable inflation has been one of the primary drivers of food and beverages inflation with the largest contribution in December 2023, followed by cereals, spices and pulses. In July and August also the sharp increase in food and beverages inflation was primarily driven by vegetables as TOP momentum reached unprecedented peak following extreme weather events (Chart 11). Volatility in vegetable inflation has been primarily driven by fluctuations in the prices of TOP which have experienced frequent inflationary pressures due to seasonal fluctuations, weather related disruptions and demand-supply mismatches (Chart 12). Crop prices follow a typical seasonal3pattern, plummeting during harvest time and rising a few months prior to the arrival of the new crop as can be observed from the seasonality factors. Since, tomato is a short duration crop, supply side shock gets translated to prices very fast causing volatility in retail prices (Chart 13). In case of onion, as 77 per cent of total production is cultivated during the rabi season, prices peak in the months of September-December, right before the onset of late kharif and rabi season (Chart 14). Similarly, retail prices of potato peak during the months of October-November, right before major rabi harvest reaches the market and stocking of potato begins (Chart 15). Tomato prices follow repeated spiral of high and low prices every alternate year. In the months of July, August and September 2021 there was negative inflation in wholesale prices of tomato. In the month of July, average wholesale prices in Kolar mandi (largest wholesale market for tomato) plummeted to ₹ 5.80 per kg with minimum price reaching as low as ₹ 2.60 per kg (Agmarknet, 2023). The fall in prices results in losses for farmers, leading to lower sowing acreage under the crop and a shift towards other crops with better return. As tomato is a short-duration crop, the impact of supply deficiency gets translated into the prices within a short span of time. In 2022, heatwave in northern part of India, and heavy rainfall in Karnataka caused productivity to fall in these leading tomato producing states. CPI tomato inflation spiked to a high of 158.4 per cent in June 2022 and 202.1 per cent in July 2023. In the month of July 2023, average retail price of tomato was ₹ 109.5 at the all-India level and tomato contributed 18.9 per cent to inflation among the 299 commodities in the CPI basket. Similar trend was observed in onion during the months of September 2019 to April 2020, with onion CPI inflation reaching as high as 327 per cent in December 2019 and 246 per cent in January 2020 (Chart 16). A hike in onion prices is observed during the months of September-December almost every year due to seasonality, but the hike is generally very steep every alternate year. Retail prices of onion touched ₹ 60 per kg and ₹ 75 per kg in September and October 2013 respectively, ₹ 70 per kg in September 2014, and ₹ 55 per kg in September 2019 (DES). On the other side, wholesale prices witness sharp drops frequently. For instance, during January-May 2019, the wholesale prices in Lasalgaon market hovered between ₹ 4-10 per kg. Thus, oscillation in prices becomes damaging for both producers and consumers. A similar cyclical phenomenon is also observed in the case of potato. In 2008-09, potato production plummeted in West Bengal due to pest attack. This led to lower stock in the cold storages and by November-December prices picked up sharply. Price oscillations in potato were observed in 2018, 2020 and 2022, with CPI inflation reaching 107 per cent in November 2020 (Chart 16)4. III. Review of Literature and Analytical Framework to Understand TOP Inflation There is a rich literature base attempting to assess the trends and factors driving food inflation in India. The factors ascribing to food inflation are classified into demand and supply-side factors. Studies by Gulati and Saini (2013), Gulati et al. (2013), and Sekhar et al. (2018) highlight the impact of Mahatma Gandhi National Rural Employment Guarantee Act 2005 (MGNREGA) wage on rural wage and per capita income as major factors behind food inflation. Other studies have listed aspects like increase in MSP, diversification to high value food items, expansionary monetary and fiscal policies as the factors behind demand-push inflation (Sonna et al., 2014; Ganguli and Gulati, 2013 and Nair and Eapen, 2012). The supply-side factors impacting food inflation include extreme weather events like flood, drought, unseasonal rainfall, high cost of cultivation owing to energy and fertiliser prices, restrictive trade policies and supply chain disruptions due to pandemic induced lockdown (Mohanty 2014; Sonna et al. 2014; Nair and Eapen 2012 and Narayanan 2022). Nair and Eapen (2015) pointed out that inflationary pressure on high-value products like vegetables, fruits, and livestock are direct outcome of poor supply response to increasing demand. There have been, however, fewer studies specific to vegetables inflation in India. A study by Saxena et al. (2022) tracks the price spread and volatility spillover effects in the major wholesale markets in India. The study determines the degree to which price shocks and volatility are transmitted to other markets and concludes that continuous surveillance in strategic markets can prevent extreme volatility. A recent study by Padhi et al. (2023) investigated the horizontal and vertical volatility transmission for three key vegetables viz., tomato, onion and potato (TOP) and found horizontal price volatility transmission from tomato to onion and potato, in both retail and wholesale markets. Moreover, while the volatility transmission between the wholesale and retail prices was found to be unidirectional from wholesale to retail prices in the case of onion and tomato, it was bi-directional in the case of potato, reflecting the vertical transmission mechanism. Birthal et al. (2019) finds that even in the months with no significant climatic shocks, there exists ambiguity in market arrivals of onion indicating monopolistic trade practices in major markets as a reason for price pressure. The study also finds that change in export policies did not have any cooling effect on inflation. Chand (2010) illustrates that supply shocks owing to weather vagaries were the most crucial factor in explaining food inflation. This research suggested that price stabilisation measures like maintaining buffer stocks and trade policies can help in containing price pressure in highly price sensitive food items. Some studies have analysed supply chain issues and mark-up charged at every stage of the value chain in identifying factors for food inflation and its unpredictability (Bhattacharya 2015 and Bhoi et al., 2019). The study by Bhoi et. al. (2019) based on survey findings suggested that improving storage facilities, trade policies, correct weather forecasts, reduced information asymmetry, and government supply management measures can help contain food inflation. IV. Overview of TOP Value Chains in India The markets for TOP vegetables in India are highly fragmented. Agricultural markets are administered by respective states, which have Agricultural Produce Marketing Committees (APMCs) that fix mandi fees, official commission charges, and user charges, etc. Unlike cereals and dairy products, where procurement and marketing are relatively developed, TOP vegetables lack an efficient value chain system. This is mainly attributed to the perishable nature of the crop, regional and seasonal concentration, lack of adequate storage facilities, and presence of large number of intermediaries (Gulati et al., 2022). An analysis of farmers’ share in consumer rupee for the three TOP vegetables suggests that farmers are getting around only one third of the price that a consumer is paying; the rest is apportioned by the wholesalers and retailers - unlike other sectors like dairy, where farmers are getting around 70 per cent of the final price. This section discusses the value chains of TOP from the producers to the final consumers and estimates the farmers’ share in consumer rupee for the three vegetables. This analysis will help understand the role of different market participants and their contribution to price inflation. A typical value chain for the three TOP vegetables is presented in Chart 17. IV.1. Tomato Value Chain in India In India, tomato is majorly grown in the southern and western region, but many other states also produce tomato for local consumption. In fact, the top 10 tomato producing states account for about 75 per cent of the all-India production. However, only the major tomato producing states have surpluses that are transported to deficit states and metropolitan cities for consumption. Tomato has mainly two seasons: rabi which accounts for 67 per cent of the production and is harvested between December and June, and kharif which accounts for 33 per cent of the production and is harvested between July and November. The major producing clusters of tomato and major consumption centres are listed in Table 1. Tomato value chain consists of several intermediaries between the farmers and consumers. Tomato cultivation mainly involves marginal and small farmers who account for 82.1 per cent of total land holdings (DoA&FW, 2020). With a crop duration of 3 to 4.5 months, tomato is sowed on raised beds. There has been an improvement in yield in the last decade due to introduction of hybrid seeds as well as marketing and processing of tomato. Tomato cultivation in India is predominantly open field cultivation rather than polyhouse cultivation which can help multiply the yield levels by way of vertical farming. The other intermediate costs have been collected through market intelligence and field visits conducted in January 2023. Farmers usually bring their produce to the mandi (APMC). The first level of sorting and grading in three grades is performed by the farmer at farm gate itself. The farmer also has an option of selling to organised retailing such as HOPCOMS (Horticultural Producers’ Co-operative Marketing and Processing Society Ltd), SAFAL Market, and Namdhari Fresh. Processing units either procure tomato from mandis or directly from farmers. In Kolar mandi, which is the largest tomato mandi in India, farmers from Anantapur, Bangalore Rural, Tumkur and Chittoor sell their produce. At APMC mandis, tomato is auctioned in the presence of traders, commission agents and mandi officials. Traders pay mandi fees, commission charges and transportation costs which then passes on from wholesalers to retailers and finally to the end consumer. To study the tomato price discovery from farmers to consumers, a case study of value chain from major supplying regions to Delhi has been considered. While the farmers’ price is the weighted average wholesale price for triennium (TE) 2021-22 taken from Agmarknet, retail price of Delhi was taken from the Department of Consumer Affairs (DoCA). As the biggest consumption center, Delhi receives tomato throughout the year from different parts of the country including Maharashtra, Karnataka, Himachal Pradesh, Madhya Pradesh, besides adjoining regions of Haryana, Rajasthan and Uttar Pradesh. The other costs have been collected through market intelligence and field visits conducted in January 2023 in the Nashik region of Maharashtra. The estimated share of each stakeholder in the tomato value chain shows that tomato farmers on an average receive 33.5 per cent of the consumer’s price in Delhi (Chart 18). This, however, includes overhead costs of labour and transportation over and above his cost of cultivation. Traders’ mark-up of 21.3 per cent also includes transportation cost, mandi fees, commission charges, and loading/unloading charges (i.e., mark-ups include costs plus margin). As per the calculations, traders earn an average of 5.3 per cent margin. The same is true for wholesaler in the secondary market. The highest margin is apportioned by the retailer who bears the maximum risk of perishability and wastage, given that tomatoes are mostly sold in unorganised markets, and they have to incur transportation costs and shop rentals. IV.2. Onion Value Chain in India Onion production is concentrated in the western and southern states of India, particularly, Maharashtra, Madhya Pradesh, Karnataka, Gujarat, and Rajasthan which contribute to about 80 per cent of the total production. Major production and consumption clusters of onion have been presented in Table 2. Onion production is spread across three seasons: rabi which is harvested in March and May and accounts for about 77 per cent of the total production; kharif which is harvested between October and December and accounts for 14 per cent of the production, and late kharif which is harvested between January and March and accounts for 9 per cent of the production as of TE 2021-225. Out of the three seasons, only rabi onion can be stored between March and October in onion storage units. These are scientific storage structures made using bamboo, asbestos, which are three side open and may also have ventilation present at the bottom on a raised platform (Gulati et al., 2022). Most farmers in Nashik region of Maharashtra are using these structures for storing their produce. Storing of onion during this period is key to controlling inflation in India. The government through National Agricultural Cooperative Marketing Federation of India Ltd. (NAFED) also procures onion during the peak harvesting months to maintain a buffer stock to tackle onion inflation. The stock is released during later months when fresh arrivals are low in the market. The duration of onion crop is around 5 months from sowing to harvesting and as per the 2021-22 estimates, the cost of onion cultivation varies widely across states from a minimum of ₹ 341.07 per quintal in Madhya Pradesh to a maximum of ₹ 2305.29 per quintal in Tamil Nadu. Among other states, the A2 +FL6 cost was ₹ 1312.57 per quintal in Karnataka, ₹965.27 per quintal in Andhra Pradesh, ₹ 782.35 per quintal in Rajasthan, ₹ 697.33 per quintal in Gujarat and ₹ 602.67 per quintal in Maharashtra (DES, MoA, 2023). Around 70.4 per cent of onion farmers are small and marginal having an area less than 2 hectares (DoA&FW, 2020). A considerable amount of onion is also exported from India. During 2015-16 and 2018-19, India exported 9 per cent of its production on an average. However, in TE 2021-22, only 5 per cent of onion production was exported as government restricted exports and prescribed a minimum export price (MEP) whenever wholesale prices of onion crossed ₹ 50 per kg mark, but it increased again to 8.5 per cent in 2022-23. About 2-3 per cent of onion production is also processed in dehydrated form such as onion flakes, granules and powder. Most of the onion dehydration plants are located in Mahuva region of Bhavnagar district, Gujarat, a white onion growing region. Due to low demand for dehydrated onion in India, it is mostly exported to other countries. However, there is no contract farming arrangement between white onion growing farmers and the dehydration units. On the other hand, farmers in and around Jalgaon (Maharashtra) have contractual arrangements with dehydration plants for procuring onion for dehydration. Farmers are provided with seeds, drip irrigation, sprinkler and extension services and receive pre-determined procurement price for their crop. In order to provide insurance, farmers are given 60 paise less than the market price in case of any increase in market price (Gulati et al., 2022). In the case of onion, farmers mostly sell their produce in the APMC where prices are determined in an open auction system. Farmers incur overhead costs such as labour charges, and charges for transportation to mandis. Once the auction is successful, it is bought by a trader with the help of commission agents, who pay the mandi fees (1 per cent), commission charges (4 per cent) and loading/unloading charges (₹ 9.02 per quintal). Further they incur packaging charges and costs due to weight loss which is around 10 per cent for kharif and late kharif onion, and 5 per cent for rabi onion. The traders then get into an agreement with traders/wholesalers of secondary APMC mandis such as Azadpur mandi in Delhi and depending on the arrangement, transportation cost of about ₹ 240 per quintal is paid by either the primary trader or the secondary trader/wholesaler. Mandi fees and commission charges are also paid by the seller. After the consignment reaches the secondary mandi, the produce is bought by retailers who then sell it in the neighbourhood markets in urban areas. In order to estimate the share of each stakeholder, Delhi has been considered as the main consumption centre, where onions arrive from different states viz., Maharashtra, Madhya Pradesh, Rajasthan and Gujarat during different times of the year. Farmers’ price is the weighted average wholesale price based on the arrivals from these states during peak harvesting months of TE 2021-22. Delhi wholesale prices reached the maximum among all the markets during this period as the onion reaching Delhi are of ‘A’ grade quality and fetch the highest price. The other costs have been collected through market intelligence and field visits conducted in January 2023 in the Nashik region of Maharashtra. Margins have been estimated by subtracting the cost from the price. Estimated mark-ups show that farmers on an average receive 36.2 per cent of the consumers’ rupee which includes cultivation and overhead costs. Traders’ mark-up of 17.6 per cent and wholesalers’ mark-up of 15.0 per cent also include their costs of transportation, mandi fees, commission charges, packaging, and labour charges. The retailer has the mark-up of 31.3 per cent (Chart 19). IV.3 Potato Value Chain in India Potato is majorly grown in the Indo-Gangetic plains of Northern India stretching from Punjab to West Bengal with rabi crop accounting for around 90 per cent of total production. A small kharif crop is also grown and harvested during September and November in Maharashtra, Karnataka, Uttarakhand, Himachal Pradesh and Tamil Nadu. The major potato belts and the consumption centres are listed in Table 3. Produced mostly by small and marginal farmers who account for 86.7 per cent (DoA&FW, 2020), potato is a three-month crop and requires 4-5 irrigations. The average cost of cultivation for potato farmers in 2019-20 was about ₹ 411.6 per quintal in UP, ₹ 525.5 per quintal in West Bengal and ₹ 434.9 per quintal in Bihar (DES, 2022b). Potato season starts from November, when potato from Punjab (mid-November onwards) starts arriving in the market. Potato arrivals from UP start from February and storage begins from mid-February and goes on till end-March. The storage cycle normally ends in November but often it continues till December. Interestingly, potato stocks at the end of March are one of the important determinants of the pricing pattern in the later part of the year. If the stored crop is less than 70-80 per cent of the normal storage capacity, prices can be expected to rise by the end of September, October and November. Potato trading happens mostly in cold storages and in APMC mandis. Potato farmers generally sell their produce to village level aggregators or traders. They also bring their produce to cold storage and store it between March and November at an average cost of ₹ 250 – 260 per quintal. Farmers generally do the first level of sorting and grading. Based on the size, potato produced in Agra is classified in three categories: Chhatha (Large), Gulla (Medium) and Kirri (Small). Farmers who have contract farming with corporations such as PepsiCo, Balaji, Haldirams sell it directly to the processors. They usually keep a fraction of their produce (about 10 per cent) for self-consumption and for seed purposes (Marketed Surplus Ratio (MSR) for potato: 89.5 per cent in TE 2014-15)7. Alternatively, they can also withdraw potato for seed from storage before next season’s sowing. Cold storages are the most important selling point for farmers in the potato belt of western Uttar Pradesh. Farmers also borrow from cold storage owners at high interest rate. They start releasing their stored produce based on market prices starting April. Open auction is performed at the cold storage with storage owner being a mediator between the farmer and trader. The potato traded at primary APMC mandis are sold to local retailers within the district/states. Traders have to pay mandi fees and development cess (1 per cent and 0.5 per cent, respectively in Sikandra mandi, Agra). In addition to this, loading and unloading charges, commission charges to commission agents, etc., are also added. Transportation cost is shared between the primary trader and wholesaler based on their arrangement. Once the consignment reaches the secondary APMC mandi (For example, Azadpur mandi in Delhi, Vashi mandi in Mumbai), it changes more hands. The produce is bought by traders at secondary mandi with the help of commission agents. Mandi fees and commission charges are paid again for the same produce. The traders in these mandis sell to retailers who then sell it in metropolitan cities and other tier ‘A’ cities in the neighbourhoods. In this supply chain, there are costs and margins of each stakeholder and the final price at which consumer purchases almost doubles or triples. In order to estimate the farmers’ share in consumer rupee for potato, average wholesale prices of Agra between February and June during TE 2022 were used to estimate farmers price (as a proxy for farmgate price). The retail price of a major consumption centre (in this case, Mumbai) was taken as the price paid by the consumer. The wholesale price for secondary mandi was taken from DoCA (Department of Consumer Affairs). Other costs of intermediaries were collected after interactions with different stakeholders during the field visits conducted in Agra, Uttar Pradesh in the month of December 2022. The estimated mark-ups (costs and margins) of each stakeholder show that farmers receive a share of 36.7 per cent of the consumer rupee (Chart 20). This, however, includes transportation costs. The average costs borne by the farmers consist of cost of transportation (₹ 30 per quintal), packaging (₹ 80 per quintal), labour (₹ 100 per quintal) and storage (₹ 250-260 per quintal). In terms of margins, retailers earn the highest margin as their cost is minimal and they deal with smaller volumes. Their costs including rental price for sale point and transportation cost is much lower than their margins. The study uses data from secondary sources that include Central and State government websites and databases of state agriculture departments, and available literature. The period of analysis is from July 2012 to June 2022 for tomato and July 2014 to June 2022 for onion and potato8. The report uses Consumer Price Index (CPI) data released by the National Statistical Office (NSO), Ministry of Statistics and Programme Implementation (MoSPI), Government of India. Monthly data on CPI for tomato, onion and potato is used for analysing the patterns of inflation and volatility. Additionally, the data on Wholesale Price Index (WPI) is collected from the Office of Economic Advisor, Ministry of Commerce and Industry and used wherever needed. In order to compile the balance sheet, information is sourced from several published reports and government data sources such as Ministry of Agriculture (for production related information), Agmarknet (for data on market arrivals), ICAR-CIPHET report on post-harvest loss, and Directorate General of Commercial Intelligence and Statistics (DGCI&S) database of the Ministry of Commerce and Industry for trade related information. The consumption of various items is available in various rounds of National Sample Survey (NSS) Reports on Consumer Expenditure Survey. Here 2011-12 survey is used for consumption data9. Consumption figures for the subsequent years are estimated using the behavioural approach of agricultural commodities for demand predictions. VI. Methodological Framework of Balance Sheet and Estimation In this study monthly balance sheets for each of the three vegetables have been constructed, considering both demand and supply side dynamics. State-wise balance sheets of major producing states together accounting for majority of total production of each of these crops are considered for each of the three vegetables. The availability variable for India is derived by adding state-wise availability. VI.1 Balance Sheet Approach Many international organisations viz. Food and Agricultural Organisation (FAO), and International Grain Council have adopted the balance sheet approach. Within India also some private agencies follow balance sheet approach for monitoring prices of different agri-commodities. Most agricultural balance sheets are prepared at the annual level and therefore do not serve the purpose of short-term forecasting. The monthly balance sheet approach, which is the primary contribution of this study, gives more information which can explain the short run fluctuations in the TOP prices. VI.1.1 Conceptual Framework of Monthly Balance Sheet Since price movements of a commodity especially an agricultural commodity depends on various other market mechanisms as well, this study also tries to identify those factors to provide a structural framework for understanding the price dynamics on a monthly frequency. Creating this availability variable requires an in-depth understanding of the value chain of the commodity and how it moves from the farmer to the retailer to incorporate the entire value-chain mechanisms which consequently determine the availability in the economy and prices in any particular month (Chart 21). To reproduce the complex value chain mechanism of the three vegetables, state-wise (for tomato, onion, potato) and season-wise (for onion and potato) balance sheets have been constructed and finally an all-India level availability variable for each of these vegetables at a monthly frequency is derived. As discussed in the previous section, both secondary as well as primary sources of information have been used for the construction of the balance sheet. There are a few components in the balance sheet for which no secondary information is available and the study had to rely on market intelligence. The monthly figures are impacted by many factors including seasonality, weather change, and demand pattern. Broadly, the monthly balance sheet will help us inspect the following aspects: 1. The supply situation of TOP in India. 2. A monthly supply variable which helps in understanding the price behaviour of TOP. VI.1.2 Rationale for State-Wise Balance Sheets There is spatial distribution in the production of TOP commodities i.e., a major proportion is concentrated in a few states and a small proportion is distributed in the other states. The distribution of production indicates that the variations in the total availability are caused by seasonal variations and/or variation in the production in each state. For instance, in December 2019, WPI inflation in onion was at 456 per cent though the production in 2019-20 had increased by 14 per cent from the previous year with a 30 per cent increase in rabi production. This was because of a 20 per cent reduction in its kharif production and 27 per cent reduction in its late kharif production from previous year, even though the overall production numbers saw an increase. The above arguments set our rationale for building state- and season-wise balance sheets to arrive at economy-wide availability variables for these commodities to capture variations in the availability. For onion, the analysis covers 5 states (Maharashtra, Madhya Pradesh, Karnataka, Gujarat and Rajasthan) accounting for 79 per cent of total production in TE 2022-23. For tomato, the study includes 5 states (Madhya Pradesh, Andhra Pradesh, Karnataka, Odisha and Gujarat) covering 55 per cent of the production. For potato, 3 states (Uttar Pradesh, West Bengal and Bihar) are considered with a share of 70 per cent of the total production. VI.1.3 Components of Monthly Balance Sheet Availability There are four dimensions of food security: physical availability of food, access to food, utilisation of food and, stability of the three dimensions over time. Food availability marks the “supply side” of food security and it is estimated by the level of food production, stock levels, and net trade (FAO, 2022). In this study, monthly availability has been defined as the crop that is sold in the market either from fresh harvest or stored produce during that month adjusted for the import and export of that crop.  To construct monthly balance sheet from the annual production figures, a way to calculate monthly harvest figures was needed. Monthly harvest production pattern was generated for the three crop years 2019-22 and distributed state-wise and season-wise. Applying that to the annual production figures, monthly production series was generated. As monthly harvest data is not available in the public domain, information was gathered through detailed discussion with the officials of Directorate of Economics and Statistics, Ministry of Agriculture. Onion is produced in three seasons, rabi (March-May), kharif (October-December) and late kharif (January-March). The monthly distribution of production is given by:  where Ymki is the production in month m of season k, which can be either rabi, kharif or late kharif in year i (for onion). δ is the percentage of annual harvest in that month and Yi is the annual production. The total production is distributed into two parts: (a) seed, feed, wastage, and (b) marketed surplus. After adjusting production for the seed, feed, and wastages, annual marketed surplus is obtained. The Marketed Surplus Ratio (MSR) for onion is taken as 91 per cent (Agricultural Statistics at a Glance, 2014)10, and the rest is seed, feed and wastage. In the case of both onion and potato, the harvest is stored for a few months depending upon the shelf life of the harvest and the infrastructure capacity in a state and in the country. A certain percentage of the harvest in some states gets stored for sale in later months till the new harvest arrives. This percentage of storage out of rabi harvest in both the commodities have been verified with the market players through interviews. For onion, 65 per cent of rabi harvest in Maharashtra, the largest onion producing state, gets stored for sale in the months from July to December. However, onion storage starts from April and release starts from June depending upon the prevailing market prices. Kharif and late kharif harvest of onion do not get stored significantly as they don’t have as long a shelf life as rabi onion. These numbers vary year to year, conditional on the prevailing market prices. For potato, around 70 per cent of the potato harvest is stored in the two largest producing states of Uttar Pradesh and West Bengal (Market Intelligence). The stored stocks in the case of potato gets released from May to November in which October sees the largest release as the rabi potato starts to perish by that month. Tomato being highly perishable cannot be stored, and it is assumed that the produce comes to the market right after harvest. As the supply is coming from different states throughout the year, monthly production is calculated for the crop year and not segregated season-wise.  Sale One of the primary determining factors of price variability in these commodities is how and when the produce is sold and especially the stored produce in case of onion and potato. There is endogeneity in this mechanism as the release of stored produce by farmers or traders depend upon the market prices and these releases, in turn, determine the prices. A monthly pattern of sale needed to be determined which can be applied to all the years in our analysis. This pattern determines how much of the produce, fresh or stored, comes to the market. The monthly mandi arrivals as a percentage of total annual arrivals gives us a close estimate of the monthly sales pattern for each state. This data is available from Agmarknet. Then the monthly sale of fresh harvest is given by:  i.e., sale S in each month m of season k of year i is γ per cent of annual marketed surplus for that season, MSki. γ is the sale pattern derived from Agmarknet data for onion and tomato. For potato, most of the produce gets stored right after harvest, and eventually released from the cold storages as per market demand. As a result, the market arrival pattern from Agmarknet does not reflect the true pattern. To address this inconsistency, monthly release pattern for potato has been obtained based on survey of the cold storage owners and farmers. Sale of stored stocks takes the form:  i.e., the sale of stored stocks S(t) in each month m in a year i is γ per cent of annual stored stocks T in the previous year. Tomato is a short duration crop of perishable nature produced throughout the year. The period considered for the balance sheet is July 2012 to June 2022. Government of India (GoI) releases production data on an annual basis, i.e., crop year July-June. Applying monthly harvest pattern to the annual production figures, annual production has been distributed to monthly production. As the supply is coming from different states throughout the year, monthly production is calculated for the crop year and not segregated season wise. Because of its short duration nature, it is assumed that the harvest pattern adequately mirrors the sale pattern. Monthly sale quantity is generated across months for each state. All-India sale figures are generated by summing up the state-level sale volumes. Losses Along the Value Chains of TOP Crop wastages at different levels of the value chain can lead to reduction in availability. Total loss in the value chain can be divided into two groups: losses in (i) farm operations and (ii) storage channels. The losses in farm operations include losses during collection, threshing, winnowing/ cleaning, drying, packaging, transport, etc. The marketed surplus ratio provided by the Ministry of Agriculture considers all these losses. For storage loss, CIPHET-ICAR study (2015) on post-harvest losses has been considered. Storage channels include farm, godown/cold store, wholesaler, retailer, and processing unit. Total storage losses for potato, onion, and tomato are taken as 0.78 per cent, 2.16 per cent, and 3.03 per cent, respectively. The storage losses are calculated on total stock of previous month for potato and onion. A total loss of around 12 per cent is assumed for tomato based on the CIPHET study of post-harvest loss. Therefore, total post-harvest losses are estimated as:  Net Import Among the three vegetables, a considerable share of onion is exported, as noted earlier. Government policy interventions of restricting exports or imposing Minimum Export Price (MEP) when the market prices are high partially ensures that exports have a minimal effect on the availability of onion in the domestic market especially when there has been a negative supply shock. For this reason, exports adjustments are not considered in the balance sheet approach for onion. Currently, tomato exports account for less than 1 per cent of total production, hence no adjustments have been made in the balance sheet. Even though India is the second largest producer of potato in the world, its share in world trade is negligible. In TE 2022-23, India exported 0.47 MMT of potato (fresh/chilled). As trade does not alter the amount of availability much, this component is not incorporated in the study. Usage/ Demand of TOP In the balance sheet, usage in a particular month is defined as total crop demand in the market and is given as:  The usage denotes consumption by individual households. As the detailed data on consumption were available up to 2011-12 during the time of analysing the data11, we projected the values based on 2011-12 data, using the behavioural approach method used in the Working Group Report of NITI Aayog (2018). NSSO gives the per capita intake of TOP separately for rural and urban areas. The various components of the formula used to project consumption for the following years are: (i) base period (2011-12) per capita consumption, (ii) extrapolated/actual population, (iii) growth rate of per capita income, and (iv) expenditure elasticity of vegetables taken from NITI Aayog. The method for assessing consumption:  where Qijt= household demand for ith commodity during the time period t; qij0 is annual per capita quantity consumed of ith commodity in base year in rural or urban areas (NSSO 2011-12); Pjt is projected population in period t, gjt is compound annual growth in per capita income (PCY) in time period t, and ejt is expenditure elasticity of the ith commodity. The total annual household demand for rural and urban areas are calculated separately using the above formula. The annual demand for India is calculated by taking a weighted average of rural and urban per capita consumption, weight being the population share in each of these categories. The annual projected consumption of tomato, onion, and potato is distributed monthly as per the pattern obtained from our market information which is almost stable each month. As these vegetables constitute an important part of the staple diet in the basket of households, their consumption pattern varies less across the year. From the total consumption of each of these vegetables, consumption out of home produce has been deducted to arrive at their net consumptions. Institutional Consumption The monthly consumption data computed based on NSSO’s consumption expenditure survey does not include consumption outside home or the magnitude of produce used by institutions. Therefore, information on institutional consumption is collected from the interaction with different stakeholders in the TOP value chain. Onion is processed to make dehydrated onion and tomato is processed to make puree and juice but its use in industries as a percentage of total onion/tomato production is negligible currently. Potato, however, is used in various industries, especially potato chips. Each month around 7.5 per cent of the sale of potato goes into institutional processing (Central Potato Research Institute, ICAR). Availability Variable Monthly state availability variable:  i.e., availability in a month is equal to total sale in that month minus the losses incurred in that month. In case of onion there are dehydration losses for the produce that get stored which results in decreased quantity of the produce. Based on market players’ and farmers’ response, the study found that for the storage of rabi produce i.e., harvest stored in April, the losses can go to as high as 30 per cent of the weight by November/December. Accordingly, dehydration losses have been applied as increasing percentages of the sale of stored stocks as the months move forward, for July (10 per cent), August (14 per cent), September (18 per cent), October (22 per cent), November (26 per cent) and December (30 per cent). There are also storage losses for both the commodities which have been taken from CIPHET report on post-harvest losses. This availability variable of a state gives us a supply side view for that state. For example, for Maharashtra we see that availability each month is very high and are traded across states, which is not being captured empirically in our analysis. Trade forms a major determinant in price formation. Lower stocks in the state of Maharashtra or Madhya Pradesh get translated into higher prices country wide. This exercise has been repeated for each state in our analysis for all the commodities, i.e., in total 5 balance sheets for tomato, 5 for onion and 3 for potato are created to obtain stock variable for each state. The robustness of each state’s balance sheet has been tested by checking the correlation of this availability variable with that state’s wholesale prices as well as all-India CPI and WPI y-o-y inflation. The negative correlation of each of the availability variable with prices helps us construct our all-India availability variable. All-India availability variable is created by summation of these state availability values. Our analysis focuses on all-India availability variable as the variable of interest to explain the price movements covering both the production seasonality in a year and the production shocks year to year. Finally, the study analyses the factors that affect prices of these vegetables using balance sheet variables that highlight the determination of prices through interaction of stakeholders in the vegetables value chain. The study also describes in detail the missing links in the value chain that play an important role in price volatility in the vegetables market. The description and sources of the data used in this analysis is given in Annexure A1. VI.2. Model Specification In line with the objective of the present study, firstly, the paper estimates determinants of tomato, onion and potato prices in an Autoregressive Distributed Lag Model (ARDL) framework. This framework is considered appropriate for situations where the variables have different orders of integration: I(0), I(1), or even a combination of both. This method is particularly robust when dealing with cases where a long-term relationship exists between the fundamental variables, especially when the available sample size is small (Pesaran and Shin, 1999; Pesaran et al., 2001). ARDL model adopts a single-equation framework. This allows it to incorporate an appropriate number of lags and efficiently navigate the data generating process within a framework that shifts from general to specific modelling, following the principles outlined by Harvey (1981). The ARDL method provides unbiased estimates and valid t-statistics, irrespective of the endogeneity of some regressors (Harris and Sollis, 2003; Jalil and Ma, 2008; Ali et. al., 2017). As far as the short-run adjustments are concerned, they can be combined with the long-run equilibrium through the error correction mechanism. To illustrate the ARDL modelling approach, a general ARDL(p,q) model is given by:  The error correction model (ECM) version of the ARDL can be expressed as:   In the study, the dependent variable for each equation is defined using the seasonally adjusted CPI of the TOP while the set of explanatory variables includes seasonally adjusted availability variable. The description and source of the data used in our regression analysis are given in Annexure Table 1 and 2. VI.2.1 Estimations of the Drivers of Tomato, Onion, and Potato Prices Estimation of Tomato For estimating the factors impacting the CPI tomato, the sample period is considered from July 2012-June 2022. The explanatory variables used are availability-usage ratio of tomato (Log AVU), rainfall dummy as it impacts tomato production heavily, and agro-chemical price index (Log AgroChemical Index) as it constitutes a major share in the cost of cultivation of tomato. Before estimating the ARDL model, the stationarity of the variables is checked using Augmented Dickey-Fuller (ADF) test. The results show that Log CPI Tomato is stationary in level, while Log AVU and log agro-chemical index are stationary in first differences (Table 4). The bounds test for tomato confirms the existence of a long-run relationship between CPI tomato and availability-usage, rainfall dummy, and agro-chemical index (Table 5). The estimate of long run coefficients from the ARDL specification and the short run dynamics are presented in Table 6 12. The ARDL model of order (2,2,0,0) show that in the long run, there is a negative relationship between CPI tomato and availability-usage variable (AVU). The founding hypothesis of this study is that the availability usage ratio of tomato at any given point determine the prices of that commodity. The negative coefficient of (-)0.72 indicates that one unit increase in the availability decreases the CPI tomato by 0.72 per cent. There is a significant and positive long-term relationship of prices with rainfall dummy which indicates that excess/deficient rainfall has a positive and significant impact on the prices of tomato. The estimate of the coefficient of ECM term, which is significant and negative, indicates that any deviation from the long-run equilibrium is corrected by 33 per cent within a month. In other words, it signals a strong correction back to the equilibrium path from any deviation. The diagnostic tests for the ARDL estimates for tomato indicate a white noise, i.e., independent and identically distributed error term with homoskedasticity and normality. Further, the Breusch-Godfrey test indicates that there exists no autocorrelation in the estimated residuals. The stability of model is tested using CUSUM test which shows that the predicted values lie within the 95 per cent confidence interval (Chart 22). Estimation of Onion For estimating the factors impacting the CPI onion, the sample period is considered from July 2014 to June 2022 based on data availability. The explanatory variables used are log of the availability of onion (LogAV) and log of composite weighted index of all the vegetables included in the CPI basket excluding onion (Log VegIndex). The ADF test shows that Log availability is stationary in level, while Log CPI onion and log vegetable index excluding onion are stationary in first differences (Table 7). The Bounds test confirms the existence of a long-run relationship between CPI onion and monthly supply of onion (Table 8). The estimated long run and short run coefficients from the ARDL (2,2,0) model are presented in Table 9. The results show that in the long run, monthly availability has a negative relationship with CPI onion. A one per cent increase in availability in a month decreases the CPI onion by 1.3 per cent. The coefficient of ECM (-0.155) is negative and statistically significant at 1 per cent level of significance, which indicates that any disturbance to the long-run equilibrium is corrected by 15 per cent within one month. A one percent increase in the prices of other vegetables is associated with 4.6 per cent increase in the CPI of onion indicating common driving factors leading to spill over across vegetables prices. The model residuals are stationary at 1 per cent level of significance. Further, the Breusch-Godfrey test indicates that there exists no autocorrelation in the estimated residuals. The stability of model is tested using CUSUM test which shows that the predicted values lie within the 95 per cent confidence interval (Chart 23). Estimation of Potato The ADF test shows that Log CPI Potato and Log real wage (Log RW) are stationary in levels, while Log availability and Log Veg index are stationary in first differences (Table 10). For estimating the factors impacting CPI potato, the sample period considered is from July 2014 to June 2022 based on data availability as mentioned earlier. The explanatory variables used are log of availability of potato (LogAV), log of composite weighted index of all the vegetables included in the CPI basket excluding potato (Log VegIndex) and log of real wages (LogRW). The Bounds test confirms the existence of a long-run relationship between CPI potato and monthly supply of potato and other vegetables price index (Table 11). The estimated long run and short run coefficients from the model are presented in Table 12. The results indicate that in the long run, there is a negative relationship of potato prices with the monthly availability of potato. A one per cent increase in the availability of potato at the all-India level decreases the CPI potato by 2.7 per cent. Similarly, the increase in prices of all other vegetables (CPI vegetables ex-potato) constitute a pull effect on the prices of potato. Moreover, price of potato also is positively related to real wages in the short-run, i.e., increase in real wages pull the prices up by raising the cost of cultivation for the farmers. In this model, the error correction term indicated by the adjusted coefficient (-0.099) is negative and significant at 1 per cent level of significance, indicating that any deviation from the long-run equilibrium gets corrected by about 10 per cent within a month (Table 12). The diagnostic test for the ARDL estimates for potato indicates that the model residuals are stationary at 1 per cent level of significance and hence satisfy the white noise test. Further, the model has no serial correlation at 1 per cent level of significance as per the Breusch–Godfrey test. The stability of model is tested using CUSUM test which shows that the predicted values lie within the 95 per cent confidence interval (Chart 24). VI.3. Inflation Forecasts of Tomato, Onion, and Potato Various studies have been undertaken to better understand and forecast food price inflation in the Indian context (Duvvuri, 2011; Sonna et al., 2014 and Raj et al., 2019). In the present paper, following the literature, an attempt has been made to forecast inflation for tomato, onion and potato for a 12-month horizon using time series-based univariate and multi-variate models such as seasonally adjusted ARIMA and ARIMA-X (StataCorp, 2013). The SARIMA model is based on its own past values and the lagged forecast errors under the assumption that the time series has a constant variation of errors (Gujarati and Sangeeta, 2007). In SARIMA-X, the additional explanatory variable is the availability variable derived as part of the balance sheet and found to be a significant determinant of CPI index of respective variables in the ARDL model. The paper considers two individual models to provide 12 months horizon prediction for each of the selected vegetables (onion, potato, tomato). Rolling (using a moving data window of 60 months) model estimation is considered to check the performance and accuracy of the forecasting models using the full sample period from July 2014 to June 2022 for onion and potato, and from July 2012 to June 2022 for tomato vis-à-vis actual inflation of these vegetables. Since the CPI index of vegetables and the balance sheet variables are seasonal in nature, these variables have been seasonally adjusted before using them for forecasting. VI.3.1 Analysis of Forecasts The Root Mean Squared Errors (RMSEs) of each forecasting model are evaluated for the full sample (i.e., July 2012 to June 2022 for tomato, and July 2014 to June 2022 for onion and potato based on the availability of data) which gives an overview of the forecast errors of a model working over different time lags. The evaluation was done by stopping the sample period in June 2021 and generating forecasts for 2, 4, 6, 8, 10, and 12 months ahead until June 2022, which were then compared with the corresponding actual inflation outcomes. The following tables report the RMSEs so obtained for all the three commodities. We check the RMSEs on 6 forecast horizons of 2, 4, 6, 8, 10 and 12 months to see how well the model forecasts the CPIs over different horizons. For tomato, potato and onion, SARIMA-X, where the availability variable is used as an exogeneous variable, generally outperforms SARIMA for the full sample as reflected in their relatively lower RMSEs (Tables 13-15).
In case of forecasts based on the rolling method (i.e., in a 60-months rolling window), SARIMA-X performs better for onion and potato for all the time horizons (except 12 months ahead for potato), while it performs better only up to 6 months horizons for tomato (Charts 25-27). 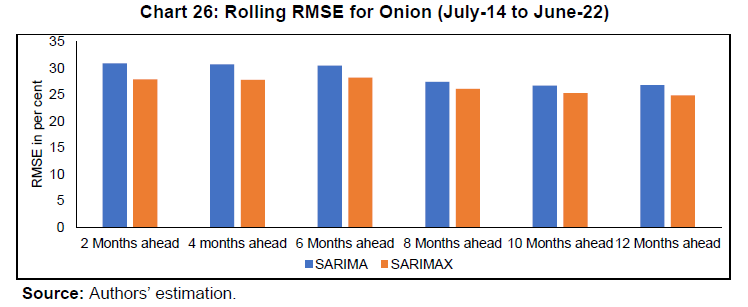 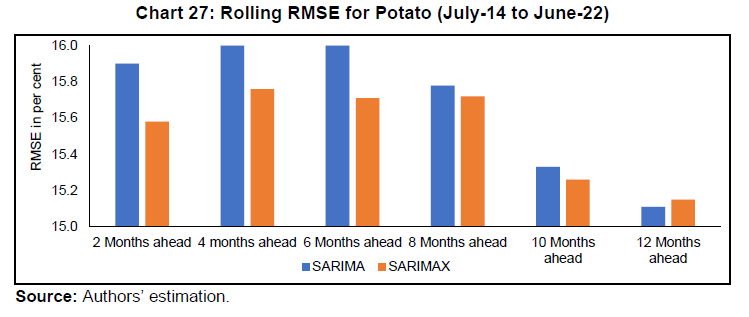 VII. Conclusion and Policy Suggestions The study has attempted to identify the key determinants of TOP prices in an ARDL framework and undertake short-term price forecasting of monthly retail inflation using time series models. For this, both monthly balance sheet analysis for TOP and perception surveys with various value chain stakeholders for forward-looking, reliable and credible market intelligence have been carried out. The empirical analysis suggests that there may be merit in including balance sheet variable like availability/availability usage ratio to better understand the price dynamics of TOP vegetables as well as for improving forecasts of TOP price inflation in India. Price fluctuations in TOP are witnessed frequently due to the existing value chain bottlenecks, in addition to climate adversities, which adds to volatility in food inflation. To improve the value chains and increase farmers’ share in consumer rupee for the three vegetables, the following policy measures are suggested: Marketing Reforms Agricultural marketing reforms: As vegetables are perishable commodities, private mandis may be increased to improve transparency in marketing of TOP vegetables. This will provide farmers with a wider choice of selling their produce. Further, due to competition, there may be improvement in Agricultural Produce Market Committee (APMC) infrastructure. Leveraging e-NAM: The electronic linking of national agricultural markets (e-NAM) was envisioned to streamline trading procedure and bring transparency in APMC mandis and allow farmers and traders to trade online. If e-NAM is leveraged to achieve spatial integration of TOP markets, this could help reduce the current inefficiencies in the markets and increase prices received by farmers as well as reduce the prices paid by the consumers. Promoting FPOs in TOP: As on June 30, 2023, 10,000 Farmers Producers Organisations (FPOs) have been allocated to various implementing agencies; of this, 6319 FPOs have been registered across the country. As vegetable farmers are mostly small and marginal, scaling up farmer collectives and empowering them with incentives may help increase their bargaining power. They can also benefit in terms of economies of scale in procuring inputs. Re-launching futures trading: Potato was traded on the Commodity Exchanges in India till 2014 after which it was banned. Relaunching of potato futures and launching futures trading in onion especially for the rabi variety can be explored for optimal price discovery and risk management. Storage Solutions Spatial distribution of storages: There is a spatial concentration of potato cold storage infrastructure as well as onion storage structures. While cold storages for potato are concentrated in UP, onion storages are concentrated in Maharashtra. There is, thus, a need to resolve the spatial distribution and capacity deficit of storage structures. Solar-powered cold storage: The efficiency of cold storages can be improved by setting up energy-efficient, solar-powered cold storages. It is found from the field survey and focussed group discussion with the cold storage owners conducted in December 2022 that there has been 35 per cent decline in electricity cost for a cold storage with a capacity of 1.71 lakh quintals of potato storage. Currently, UP has a few cold storages partly run by solar power, but such facilities may be promoted further by incentivising investment in solar-powered cold storages. Once most of the cold storages start using solar power, the benefits through reduced operation costs can be passed on to the farmers. The government provides large subsidies on the construction of cold storages; a separate slab of subsidy for cold storage which will install solar panel for energy supply may be introduced as an incentive. Processing of TOP Awareness among consumers: There is a need for creating greater awareness about the usage of processed forms of TOP: potato flakes, dehydrated onion and tomato puree among Indian consumers. Using dehydrated onion/tomato puree can be a substitute for fresh onion/tomato especially when the prices rise. This will help farmers by minimising post-harvest losses and their incomes will rise. Consumers can also purchase onion/tomato at reasonable prices throughout the year. Enhance processing capacity: While the dehydration industry in Mahuva (Gujarat) is already large, it can be leveraged for enhancing dehydrated form of TOP. On the other hand, there is negligible processing of potato in UP and Bihar, the first and third largest potato growing states. There is a need for increasing potato processing in these states to help farmers during the glut period. Further, small scale processing units may be opened by FPOs to produce tomato pulp and puree to supply to large-scale ketchup manufacturing plants. Enhancing TOP productivity Research and Development (R&D) for varietal development: There is a need to promote R&D in varietal development of table varieties of potato, processing varieties of potato, exportable varieties of onion, etc. This could enhance the yield of TOP per hectare and ensure adequate supply of the crops with more stabilised prices. Polyhouses for tomato: There is a need to promote usage of polyhouse cultivation of tomato to enhance tomato yield in India. This will ensure a steady supply of tomato crop and help stabilise tomato prices. To help FPOs and farmers afford such capital-intensive technology, some incentives could be provided for technology adoption. Adequate availability of data Private stock data: Data on private stocks of onion and potato cold storages are not readily available. Real time information on private stocks of onion and cold storage stock position for potato will strengthen assessment of the evolving demand-supply balance and facilitate appropriate and timely policy responses to stabilise prices of these commodities. Statistical data: There are several agencies that collect data on acreage (Land Use Statistics and Horticulture Statistics), and wholesale and retail prices (NHB, Department of Consumer Affairs, NHRDF). Availability of real time data on acreage for TOP crops and their stock positions will further help in better estimation of market supply for these crops and for calibrating necessary policy interventions. 1 This study is part of a joint research project on “Understanding Price Dynamics of Major Agricultural Commodities and Identifying Ways to Improve Value-chains” by the Reserve Bank of India (RBI) and the Indian Council for Research on International Economic Relations (ICRIER). Ranjana Roy, Sanchit Gupta, and Harsh Wardhan are Research Fellow, former Research Assistant, and former Consultant, respectively in the Division of Agriculture Policy Sustainability and Innovation (APSI), ICRIER. Dr. Ashok Gulati is distinguished Professor at the ICRIER. Suvendu Sarkar and Soumasree Tewari are Assistant Advisers in the Department of Statistics and Information Management (DSIM) and Department of Economic and Policy Research (DEPR), respectively, and Rohan Bansal and Shelja Bhatia are Managers in the Monetary Policy Department (MPD), RBI. The authors thank Atri Mukherjee, internal discussant from RBI and an anonymous external reviewer for their valuable comments and suggestions. The views expressed in this paper are those of the authors and do not represent the views of the institutions to which they belong. 2 The National Sample Survey Office (NSSO), Ministry of Statistics and Programme Implementation, Government of India has released the summary results of Household Consumption Expenditure Survey (HCES) conducted during August 2022 to July 2023 relating to estimated Monthly Per Capita Consumption Expenditure (MPCE) in the form of a factsheet in February 2024 and the detailed report in June 2024. 3 To calculate the seasonality graph, the seasonality factor which is the ratio of monthly retail prices to that year’s average retail price is used. The seasonality features have been averaged over the last four years based on the crop year of tomato, onion, and potato. 4 The item-wise monthly Consumer Price Index (CPI) data is unavailable for March, April, and May 2020. To address this gap, the study has imputed commodity-wise CPI values using the available sub-group CPI data for those months. 5 Season wise production data is available only up to 2021-22. 6 (A2+FL) includes value of hired human labour, hired bullock labour, owned bullock labour, owned machinery labour, hired machinery charges, seeds, insecticides, pesticides, manure, fertiliser, depreciation on implements and farm buildings, irrigation charges, land revenue, cess, other taxes, interest on working capital, miscellaneous expenses, rent paid for leased land, imputed value of family labour. 7 Agricultural Statistics at a Glance, 2014-15 8 Since, balance sheets for onion and potato are constructed considering season wise (rabi and kharif) data, the period considered is July 2014 to June 2022, as state wise and season wise data is only available from 2014. 9 NSO released the factsheet for the Household Consumption Expenditure Survey (HCES) 2022-23 in February 2024 and the detailed report in June 2024. 10 As MSR is not available for tomato in Agricultural Statistics at a Glance (2014), only 3 per cent of harvest level wastage data from CIPHET study for tomato has been applied. 11 NSO released the factsheet for the Household Consumption Expenditure Survey (HCES) 2022-23 in February 2024 and the detailed report in June 2024 12 As the balance sheet for onion and potato are created using season wise production data, the time period of the balance sheet is up to June 2022. Season wise data is not available for 2022-23. References Agmarknet (2022). Wholesale prices. Directorate of Marketing & Inspection (DMI), Ministry of Agriculture and Farmers Welfare, Government of India, New Delhi. Ali, W., Abdullah, A., & Azam, M. (2017). Re-visiting the environmental Kuznets curve hypothesis for Malaysia: Fresh evidence from ARDL bounds testing approach. Renewable and sustainable energy reviews, 77, 990-1000. Anand, R., Prasad, E.S., & Zhang, B. (2015). What measure of inflation should a developing country central bank target? International Monetary Fund Working Paper WP/15/205. Banerjee, A., Dolado, J., & Mestre, R. (1998). Error‐correction mechanism tests for cointegration in a single‐equation framework. Journal of Time Series Analysis. Vol. 19, Issue 3, pp. 267-283. Bhattacharya, R., & Sengupta, A. (2015). Food inflation in India: Causes and consequences. National Institute of Public Finance and Policy Working Paper 2015-151. New Delhi. Bhoi, B. B., Kundu, S., Kishore, V., & Suganthi, D. (2019). Supply chain dynamics and food inflation in India. RBI Bulletin, 73(10). Birthal, P., Negi, A., & Joshi, P. K. (2019). Understanding causes of volatility in onion prices in India, Journal of Agribusiness in Developing and Emerging Economies 9(3):00-00 DOI:10.1108/JADEE-06-2018-0068 Chand, R. (2010). Understanding the nature and causes of food Inflation. Economic and Political Weekly, 45(09), pp 10-13. Chand, R., & Saxena, R. (2017). Agricultural trade between India and Pakistan: Status and potential. India-Pakistan Trade Normalisation (pp. 15-59). Springer, Singapore. Chengappa, P. G., Manjunatha, A. V., Dimble, V. & Shah, K. (2012). Competitive assesment of onion markets in India, Bangalore: Competition Commission of India-Agricultural Development and Rural Transformation Centre, Institue for Social and Economic Change. DES (2022a). Directorate of Economics and Statistics, Ministry of Agriculture and Farmer’s Welfare, Government of India. Retrieved from https://aps.dac.gov.in/APY/Index.htm DES (2022b). Cost of cultivation data. Directorate of Economics and Statistics, Ministry of Agriculture and Farmer’s Welfare, Government of India. DoA&FW. (2020). Agricultural census 2015–16. Department of Agriculture Cooperation and Farmer’s Welfare, Ministry of Agriculture, Government of India, New Delhi. Retrieved from http://agcensus.dacnet.nic.in/ DoCA (2022). Price monitoring cell. Department of Consumer Affairs, Ministry of Consumers Affairs, Food and Public Distribution, Government of India, New Delhi. Dua, P., & Goel, D. (2021). Determinants of inflation in India. The Journal of Developing Areas, 55(2). Duvvuri, S. (2011). The challenge of food inflation. Presidential Address at the 25th Annual Conference of the Indian Society of Agricultural Marketing. Hyderabad. Estupinan, X., Gupta, S., Sharma, M., & Birla, B. (2020). Impact of COVID-19 pandemic on labour supply, wages and gross value added in India. The Indian Economic Journal, 68(4),572–592. FAOSTATS. (2022). Retrieved from Food and Agricultural Organisation of the United Nations, https://www.fao.org/faostat/ Ganguly, K., & Gulati, A. (2013). The political economy of food price policy – The case of India. Working Paper No.034. United Nations University, World Institute for Development Economic Research. Gujarati, D., & Sangeetha, N. (2007). Basic econometrics. Tata McGraw-Hill (4th ed.), New Delhi. Gulati, A., & Saini, S. (2013). Taming food inflation in India. Discussion Paper No. 4, Commission for Agricultural Costs and Prices, Ministry of Agriculture, Government of India. Gulati, A., Jain, S., & Satija, N. (2013). Rising farm wages in India: The ‘pull’ and ‘push’ factors. Discussion Paper No. 5. Commission for Agricultural Costs and Prices. Gulati, A., & Wardhan, H. (2019). From plate to plough: time to top up, New Delhi: The Indian Express, October 14. https://indianexpress.com/article/opinion/columns/tomato-onion-potato-price-hike-indian-farmers-6067813/ Gulati, A., Wardhan, H., & Sharma, P. (2022). Tomato, onion and potato (TOP) value chains. Agricultural Value Chains in India (pp. 33-97). Springer, Singapore. Harris, R., & Sollis, R. (2003). Applied time series modelling and forecasting, West Sussex: Wiley. Harvey, Andrew C. (1981). Time series models. Oxford: Philip Allan and Humanities Press. ICAR-CIPHET. (2015). Assessment of quantitative harvest and post-harvest losses of major crops and commodities in India. IGC. (n.d.). International Grains Council. https://www.igc.int/en/markets/marketinfo-sd.aspx. Jalil, A., & Ma, Y. (2008). Financial development and economic growth: Time Series Evidence from Pakistan and China, Journal of Economic Cooperation. 29(2) pp.29-68. MacKinnon, J. (1991). Critical values for cointegration tests. In: Engle, R. and Granger, C., Eds., Long Run Economic Relationships, Oxford University Press, Oxford, 267-276. MoFPI (2022b). Scheme guidelines for operation greens - long term interventions dated 08.06.2022, Ministry of Food Processing Industries, New Delhi: Government of India, https://www.mofpi.gov.in/sites/default/files/og_scheme_guidelines.pdf Mohanty, D. (2014). Why is recent food inflation in India so persistent? Speech at the Annual Lalit Doshi Memorial Lecture, Xavier’s Chapter, St. Xavier’s College, Mumbai, January 13, 2014. MoSPI. (2022). Ministry of Statistics and Programme Implementation, Government of India. Nair, S. R., & Eapen L.M (2015). Agrarian performance and food price inflation in India pre- and post-economic liberalisation. Economic & Political Weekly. Vol l. No 31, pp 49-60. Nair, S. R., & Eapen, L.M. (2012). Food price inflation in India (2008 to 2010): a commodity-wise analysis of the causal factors. Economic & Political Weekly. Vol (20), pp 46-64. Narayanan, S. (2022). How India’s agri-food supply chains fared during the COVID-19 lockdown, from farm to fork. (Ed.) McDermott, J. and Swinnen, J., Covid-19 and Global Food Security. IFPRI Niti Ayog (2018). Demand and supply projections towards 2033: Crops, livestock, fisheries and agricultural inputs. https://niti.gov.in/sites/default/files/2019-07/WG-Report-issued-for-printing.pdf. Padhi, P. Shekhar, H. & Handa, A. (2023). Anatomy of price volatility transmission in Indian vegetables market. DRG Study No 49. Reserve Bank of India. https://rbi.org.in/Scripts/BS_PressReleaseDisplay.aspx?prid=56002 Pesaran, M. H. Shin, Y., & Smith, R. P. (1999). Pooled mean group estimation of dynamic heterogeneous panels, Journal of the American Statistical Association. 94(446). Pp 621-634 https://www.jstor.org/stable/pdf/2670182.pdf Pesaran, M. H. Shin, Y., & Smith, RJ. (2001). Bounds testing approaches to the analysis of level relationships, Journal of Applied Econometrics 16(3), Special Issue in Memory of John Denis Sargan, 1924-1996: Studies in Empirical Macro econometrics (May - June, 2001), pp. 289-326 https://www.jstor.org/stable/2678547 NSSO. (2011-12). National Sample Survey 2011-2012 (68th round) - Schedule 1.0 (Type 1) - Consumer Expenditure. Raj, J., Kapur, M., Das, P., George, A.T., Wahi, G., & Kumar. P. (2019). Inflation forecasts: Recent experience in India and a cross-country assessment. Mint Street Memo No. 19, Reserve Bank of India. Sasmal, J. (2015). Food price inflation in India: The growing economy with sluggish agriculture. Journal of Economics, Finance and Administrative Science, 20(38), 30-40. Saxena, R., Kumar, A., Singh, R., Paul, R. K., Raman, M. S., Kumar, R., & Agarwal, P. (2022). Examining export advantages in Indian horticulture: an approach based on product mapping and seasonality. Journal of Agribusiness in Developing and Emerging Economies, (ahead-of-print). Sekhar C.S.C, Roy, D., & Bhatt, Y. (2018). Food inflation and volatility in India: Trends and determinants. Indian Economic Review. Vol. 53, pp65-91. https://doi.org/10.1007/s41775-018-0017-z Sonna, T, Joshi, H., Sebastian, A., & Sharma, U. (2014). Analytics of food inflation in India. RBI Working Paper Series No. 10 (RBI WPS (DEPR): 10/2014). RBI, Mumbai. https://rbi.org.in/Scripts/PublicationsView.aspx?id=16055 StataCorp, L. P. (2013). ARIMA, ARMAX & ARFIMA Stata time-series reference manual. Stata Press College Station. https://www.stata.com/features/time-series/ts-arima.pdf Annex
|
||||||||||||||||||||||||||||||||||||||||||||||||||||||||||||||||||||||||||||||||||||||||||||||||||||||||||||||||||||||||
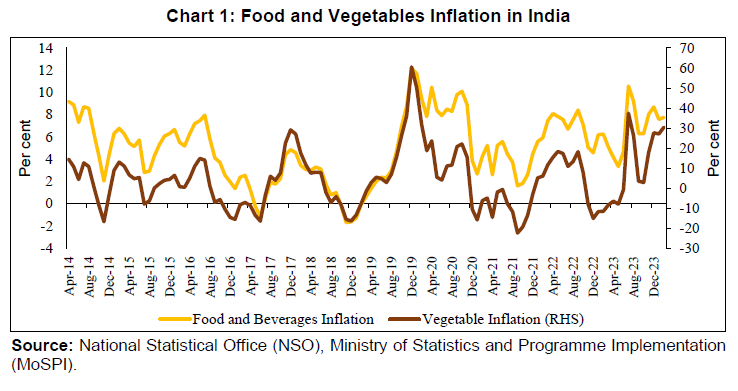
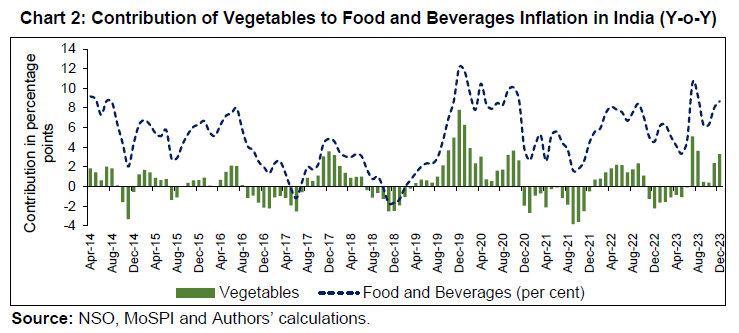
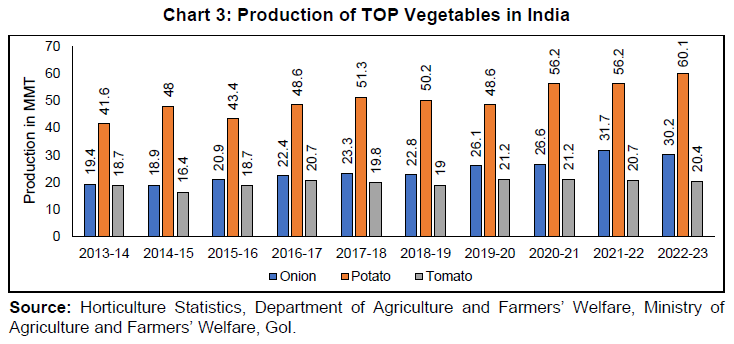
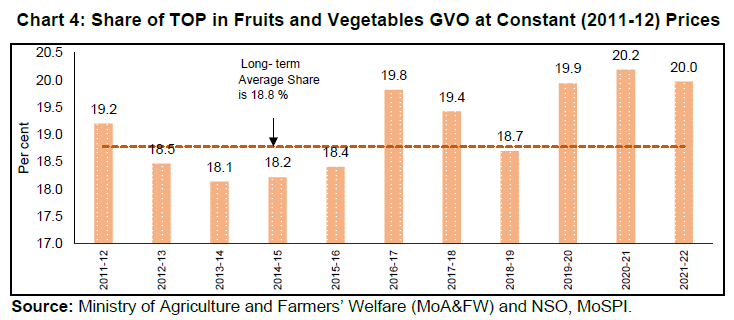
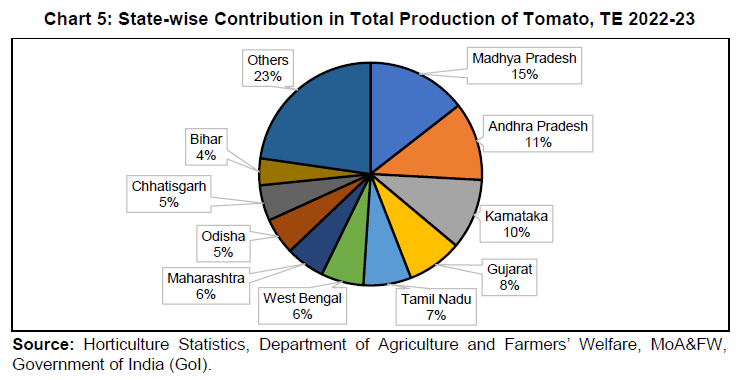
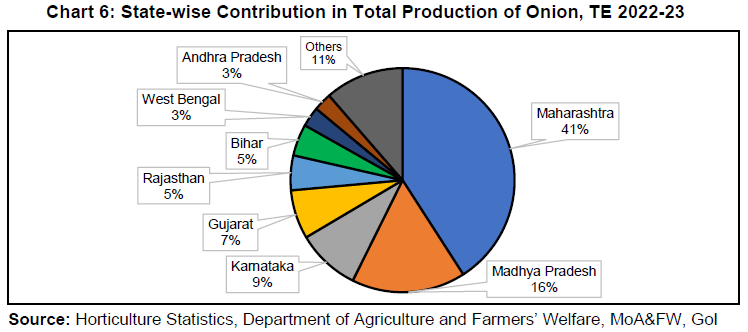
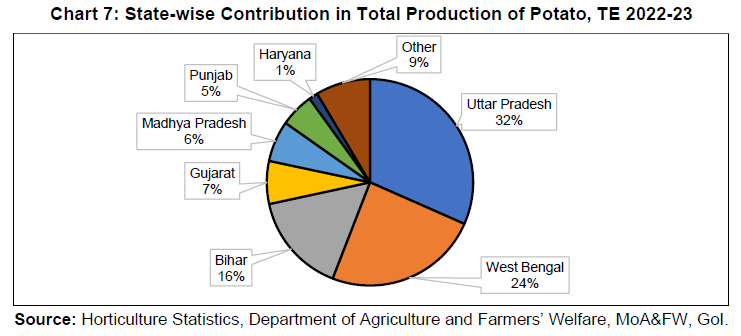
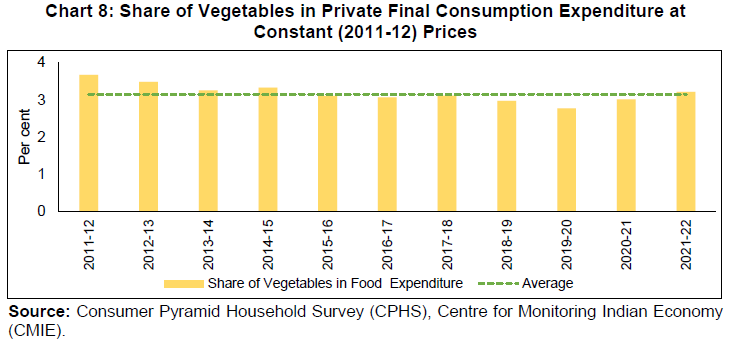
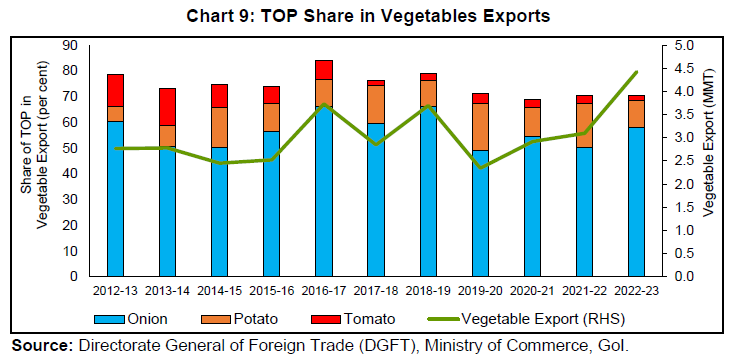
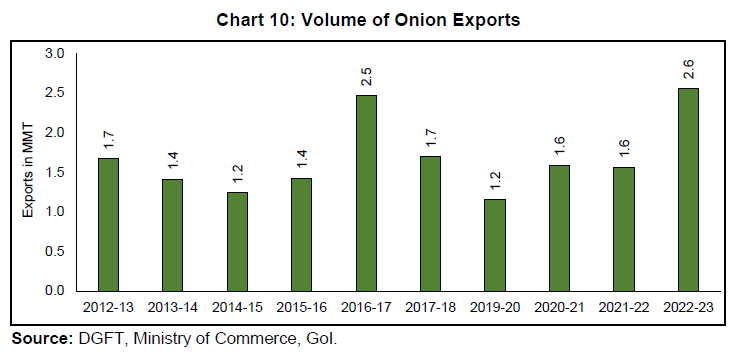
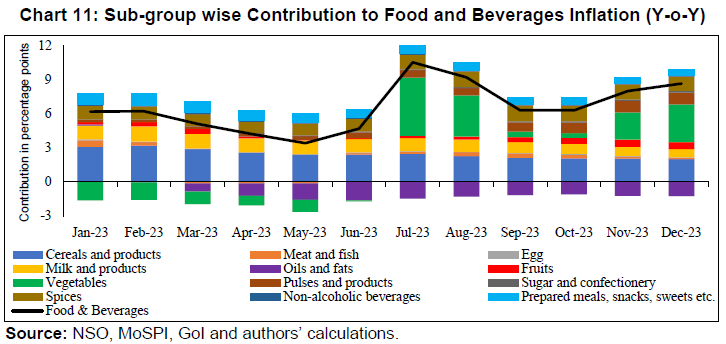
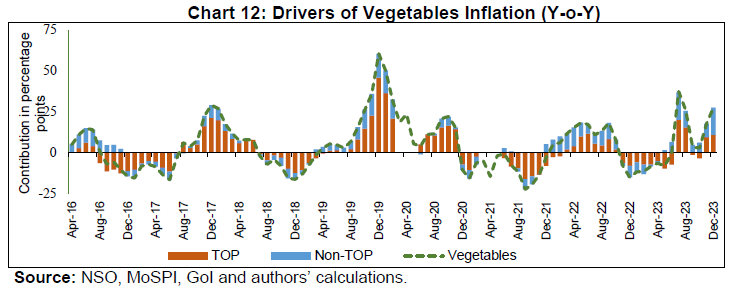
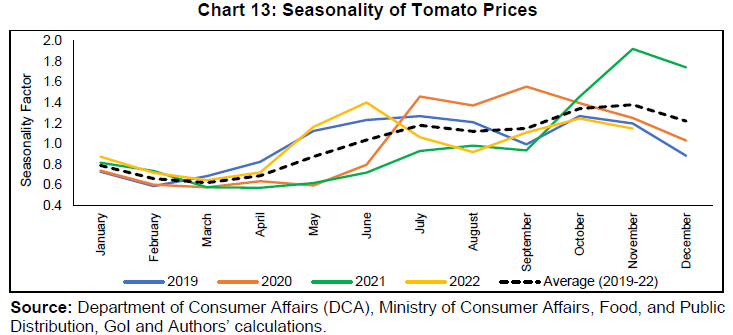
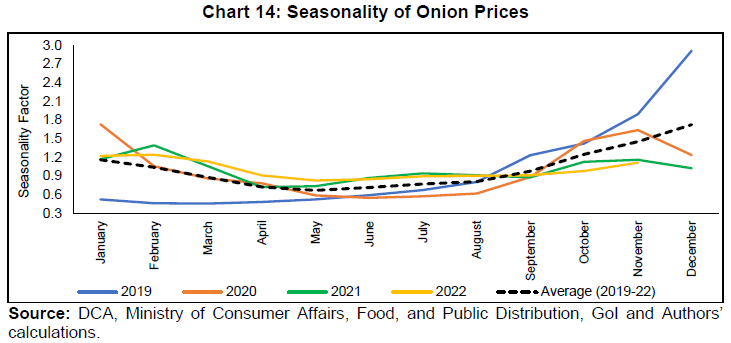
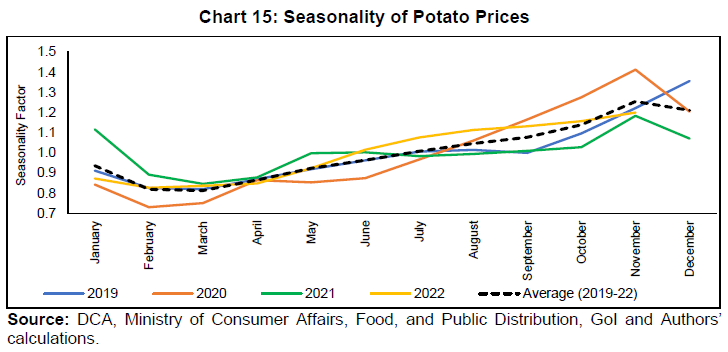

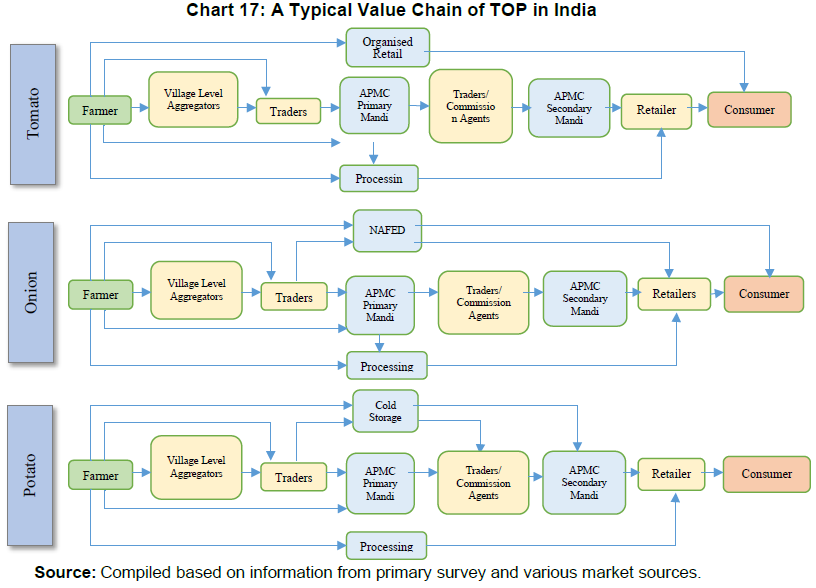
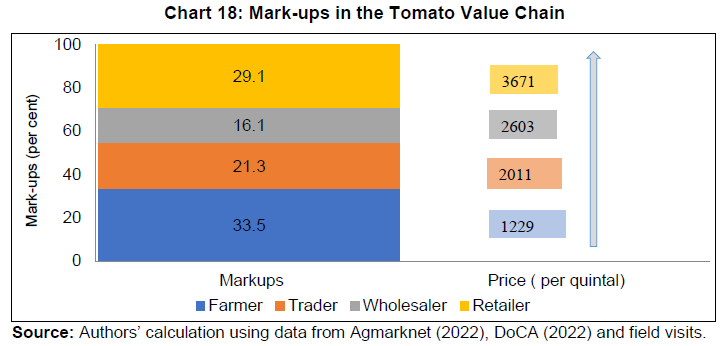
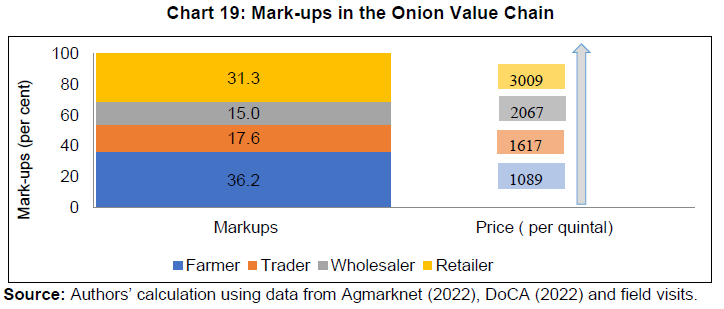
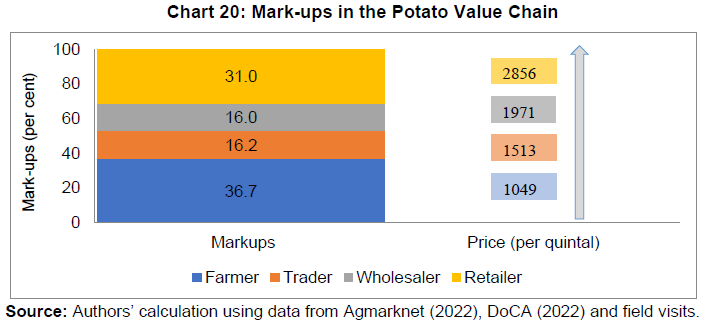
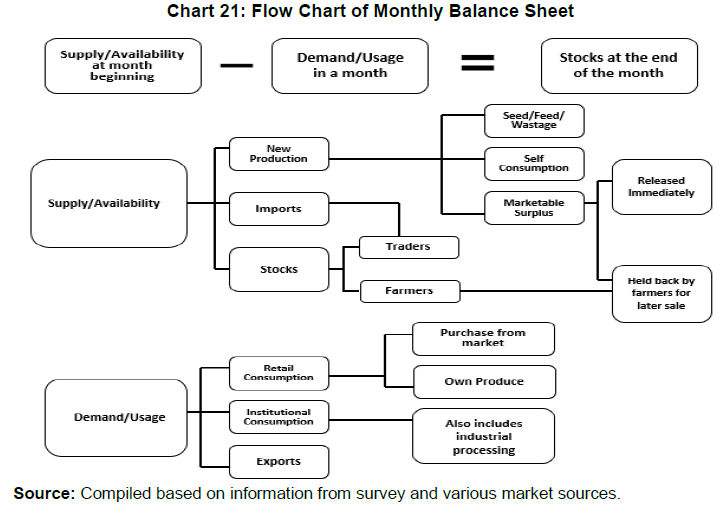
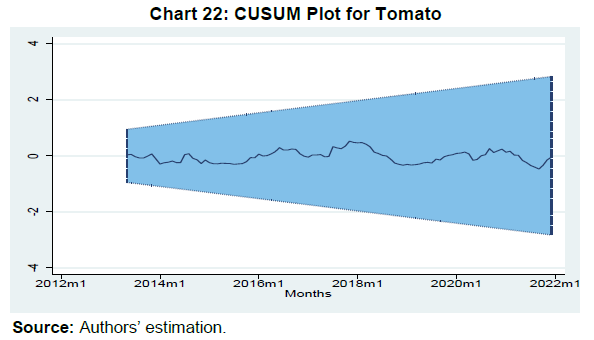
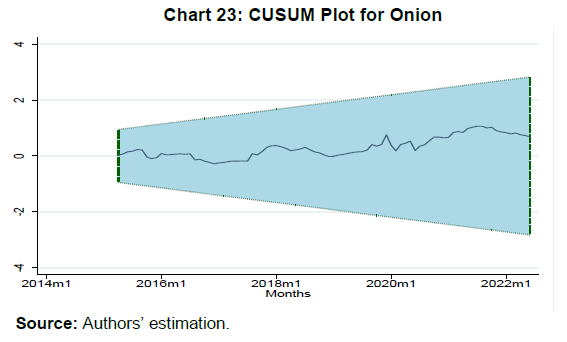
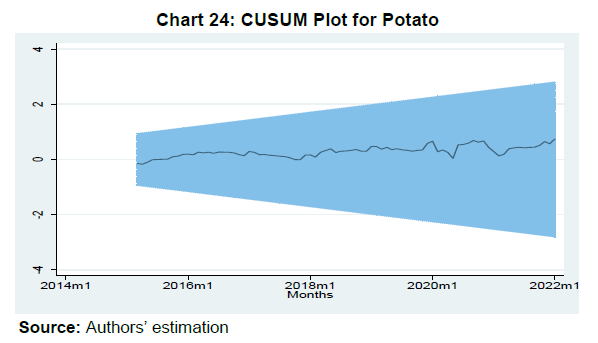
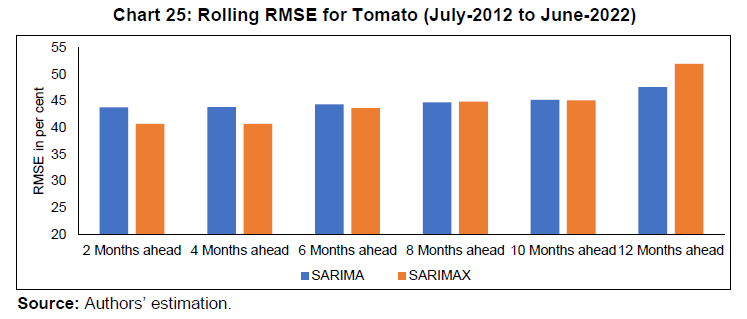

এই পেজটি শেয়ার করুন:


রিজার্ভ ব্যাঙ্ক অফ ইন্ডিয়া মোবাইল অ্যাপ্লিকেশন ইনস্টল করুন এবং সাম্প্রতিক সংবাদগুলিতে দ্রুত অ্যাক্সেস পান!
আমাদের অ্যাপটি ইনস্টল করতে QR কোডটি স্ক্যান করুন


পেজের শেষ আপডেট করা তারিখ:


