V. Financial Markets - আরবিআই - Reserve Bank of India
V. Financial Markets
Money Market
Foreign Exchange Market
Government Securities Market
Equity and Debt Markets
5.1 Financial markets were flush with liquidity over the greater part of 2002-03, bolstered by sustained capital inflows and a liquidity overhang. There was a general easing of market conditions in terms of turnover and rates, the latter enabled by the accommodative monetary policy stance. In the money markets, key rates ruled close to the repo rate, except for a transient firming in mid-May 2002 and episodic spurts after October 2002. Market sentiment recovered quickly from border tensions in May 2002 and over the rest of the year, there was a modest appreciation of the spot exchange rate against the US dollar and a softening of forward premia. Repeated price rallies in the government securities market pushed down yields and flattened the yield curve, abating temporarily in February 2003 as fears of war in Iraq mounted. Yields on corporate bonds fell more sharply than those on gilts as risk perceptions improved. While bank deposit rates decreased in response to monetary policy impulses, this was not fully reflected in the lending rate reductions in the credit market. Activity in the credit market, however, picked up on the back of an upturn in demand from a range of industries. Equity markets remained subdued during the year, tracking developments in international markets. Uncertainty surrounding the disinvestment strategy and the lack of appetite among foreign institutional investors dampened market sentiment (Table 5.1).
Call Money |
Gilt |
Foreign Exchange |
Liquidity Management |
Equity |
||||||||||||
|
|
||||||||||||||||
Month |
Average |
Average |
Turnover |
Average |
Average |
RBI’s net |
Forward |
Net |
Average |
Average |
Average |
Average |
Average |
Average |
||
Daily |
Call |
in |
Daily |
Excha- |
Foreign |
premia |
OMO |
Daily |
Daily Rev- |
Daily |
Daily |
BSE |
S & P |
|||
Turnover |
Rates |
Govt. |
Inter-bank |
nge |
Currency |
3-month |
Sales(-) |
Repos |
Erse Repo |
BSE |
NSE |
Sensex |
CNX |
|||
(Rs. |
(Per |
Securities |
Turnover |
Rate |
Sales (-)/ |
(Per |
Purcha- |
(LAF) |
(LAF) |
Turn- |
Turn- |
Nifty |
||||
crore) |
cent) |
(Rs |
(US $ |
(Rs. per |
Purch- |
cent) |
Ses (+) |
Outstan- |
Outstan- |
over |
over |
|||||
. crore)+ |
million) |
US $) |
ases(+) |
(Rs. |
ding |
ding |
(Rs. |
(Rs. |
||||||||
(US $ |
Crore) |
(Rs. |
(Rs. |
crore) |
crore) |
|||||||||||
million) |
crore) |
crore) |
||||||||||||||
|
|
||||||||||||||||
1 |
2 |
3 |
4 |
5 |
6 |
7 |
8 |
9 |
10 |
11 |
12 |
13 |
14 |
15 |
||
|
|
||||||||||||||||
2002-03 |
||||||||||||||||
April |
41,616 |
6.58 |
1,93,091 |
6,541 |
48.92 |
477 |
6.12 |
-5,307 |
8,119 |
1,322 |
1,312 |
2,424 |
3435 |
1121 |
||
May |
39,326 |
6.90 |
1,20,173 |
4,966 |
49.00 |
86 |
6.23 |
-1,525 |
1,924 |
17 |
1,279 |
2,499 |
3303 |
1080 |
||
June |
28,905 |
6.04 |
1,16,846 |
4,836 |
48.97 |
241 |
5.37 |
-189 |
10,420 |
0 |
1,166 |
2,212 |
3257 |
1066 |
||
July |
32,386 |
5.75 |
2,35,586 |
4,922 |
48.76 |
1,829 |
4.40 |
-6,538 |
17,092 |
0 |
1,162 |
2,235 |
3215 |
1035 |
||
August |
32,269 |
5.72 |
2,44,717 |
4,564 |
48.59 |
1,179 |
4.09 |
-7,025 |
19,046 |
0 |
1,132 |
2,196 |
3053 |
978 |
||
September |
28,883 |
5.75 |
1,70,345 |
4,429 |
48.44 |
965 |
3.94 |
-6,355 |
19,483 |
0 |
1,221 |
2,325 |
3086 |
987 |
||
October |
30,469 |
5.73 |
2,48,038 |
4,156 |
48.37 |
1,171 |
3.81 |
-71 |
20,653 |
0 |
1,316 |
2,472 |
2950 |
955 |
||
November |
25,821 |
5.45 |
3,34,605 |
5,093 |
48.25 |
2,115 |
3.66 |
-11,073 |
13,859 |
2 |
1,367 |
2,703 |
3058 |
992 |
||
December |
24,305 |
5.58 |
2,95,943 |
5,054 |
48.14 |
1,679 |
3.32 |
-4,548 |
10,911 |
0 |
1,456 |
2,951 |
3316 |
1074 |
||
January |
24,034 |
5.66 |
3,55,821 |
4,941 |
47.93 |
1,785 |
3.42 |
-10,996 |
6,325 |
13 |
1,343 |
2,816 |
3328 |
1073 |
||
February |
20,682 |
5.71 |
1,39,689 |
5,206 |
47.73 |
2,335 |
3.55 |
-88 |
4,259 |
45 |
1,235 |
2,542 |
3279 |
1056 |
||
March |
24,357 |
5.86 |
1,31,947 |
5,542 |
47.64 |
1,849 |
3.60 |
-66 |
2,265 |
1,570 |
1,013 |
2,158 |
3156 |
1016 |
||
2003-04 |
||||||||||||||||
April |
17,338 |
4.87 |
2,26,803 |
5,585 |
47.38 |
1,432 |
2.08 |
-7 |
27,372 |
109 |
1,041 |
2,449 |
3037 |
965 |
||
May |
18,725 |
4.87 |
2,99,933 |
5,960 |
47.08 |
2,342 |
1.10 |
-5,569 |
25,223 |
10 |
1,072 |
2,604 |
3033 |
963 |
||
June |
20,544 |
4.91 |
3,00,504 |
5,805 |
46.71 |
896 |
2.76 |
-44 |
24,805 |
– |
1,187 |
2,933 |
3387 |
1069 |
||
July |
18,698 |
4.90 |
3,04,587 |
5,986 |
46.23 |
3,146 |
2.65 |
-57 |
42,690 |
39 |
1,434 |
3,429 |
3665 |
1150 |
||
|
|
||||||||||||||||
OMO: Open Market Operations. |
+ Outright turnover in Central Government dated securities. |
LAF: Liquidity Adjustment Facility. |
||||||||||||||
BSE: Bombay Stock Exchange. |
NSE: National Stock Exchange. |
|||||||||||||||
5.2 Global financial markets witnessed major declines in the first half of 2002-03 with investor confidence severely undermined by financial distress among major corporate entities and geo-political tensions. Equity markets went through their steepest declines since September 11, 2001. The negative sentiment spilled over into the corporate bond markets where issuances slowed down and credit spreads widened. Sovereign spreads on emerging market paper rose markedly during June-July 2002. Activity in all segments of the international banking market experienced a pronounced slowdown, mainly due to a decline in inter-bank lending and subdued credit demand. A revival of investor confidence set in during October and equity markets began to recover. Corporate bond markets shared in this optimism as credit spreads narrowed. Emerging markets were dominated by local developments. International banking activity stabilised with some improvement in credit to non-banks. Nevertheless, sentiment in international financial markets remained uncertain with the weakening of the global recovery in the fourth quarter and the downward adjustment in expectation of stronger corporate earnings in the near term. Emerging markets were bound down by sluggish capital inflows, although the cessation of outflows of private capital shored up sentiment considerably towards the close of the year. In the foreign exchange markets, the US dollar depreciated against the Euro and Yen reflecting diminished attractiveness of US assets, a slowdown in the Euro area's diversification away from euro-denominated assets, growing apprehensions about the US's large trade deficit and geo-political concerns.
Call/ Notice Money Market
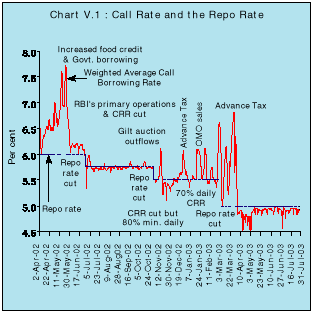
5.3 Call/notice money market activity during 2002-03 was dominated by shifts in liquidity conditions. The usual beginning-of-the-year liquidity evinced considerable appetite for LAF repos. The commencement of the Centre's market borrowing and open market sales for improving price discovery evened out the excess liquidity, and the weighted average call borrowing rate edged above the Bank Rate of 6.5 per cent at the end of April (Chart V.1). As the borrowing programme intensified, drawals of food credit began and border tensions surfaced in May, market liquidity tightened, driving up the average call rate to a high of 7.7 per cent on May 22, 2002. The demand for LAF repos waned until a reverse repo auction and a series of private placements of government securities with the Reserve Bank brought the call rate down by end-May 2002 (Appendix Table V.1).
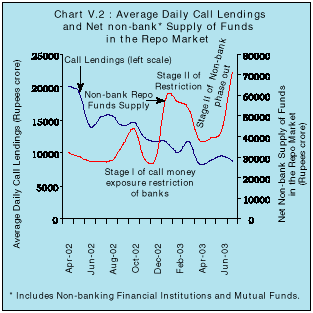
5.4 Easing of monetary conditions - reduction of CRR - and redemption inflows drove the call rates below the repo rate by the fourth week of June. The reduction in the repo rate on June 27 started a long phase of stability in the call money market with the call rates trailing just below the repo rate up to October 2002. Amidst ample liquidity and phasing out of non-banks from the call/notice money market, as the first stage of call money exposure limits for banks became effective in October, the turnover in call/notice money market segment declined while the participation and exposure in the repo market segment increased (Chart V.2).
5.5 Call/notice money market conditions remained relatively volatile in the remaining part of the year, with rates edging up around mid-November due to gilt auction outflows and higher minimum average daily CRR maintenance requirements. Another round of monetary policy easing calmed the market and the call rates softened below the repo rate by the end of the month. An increase in the notified amount of 91-day Treasury Bill auctions, application of second stage call money exposure restrictions and advance tax outflows moved the call rates above the repo rate in December 2002. Liquidity conditions eased as the minimum average daily CRR maintenance requirement was lowered.
5.6 The call money rates firmed up intermittently in the last quarter of the year - in mid-January, 2003 on account of sizeable open market sales and in the later part of February 2003 due to geopolitical uncertainties and on-tap sale of State loans. The repo rate reduction on March 3, 2003 brought the call rates down for a brief period before they rose again towards the end of the month in a typical end-of-the-year upturn (Table 5.2).
5.7 The year 2003-04 began with softer call rates during April 2003 following inflows on account of large deferred expenditure undertaken by the government, purchase of foreign currency by the Reserve Bank and unwinding of the year-end tightness of liquidity. Capital inflows continued and monetary conditions were eased with a reduction in CRR in June 2003. The call rates settled at sub-repo levels during May-August 2003 (up to August 13) reflecting ample liquidity conditions. The turnover in call/notice money market fell in July 2003 subsequent to the application of call lending restrictions on the non-banks in June 2003.
Other Money Market Segments
Term Money Market
5.8 The main factor that has inhibited the development of term money and other money market segments in India is the absence of a smooth rupee yield curve providing an anchor for expectations for longer tenor. The skewness in liquidity among participants is also proving to be a deterrent for proper development of this market. Furthermore, corporates' preference for 'cash' credit rather than for 'loan' credit generally forces banks to deploy a large amount in the call money market instead of the term money market to meet sudden demand from corporates. For all these reasons, market activity tends to be concentrated predominantly in the call segment. Activity in the term money market during 2002-03 was dormant up to October but for an aberrational spurt in August due to temporary funds invested in the term money segment towards the later part of the month. With the imposition of prudential limits on exposure to the call/notice money market on banks and primary dealers, term money transactions rose from November 2002 onwards with the average daily turnover turning out to be significantly higher in 2002-03. The momentum has been maintained during 2003-04 so far with a further phase-out of non-banks from call/notice money market in June 2003 (Table 5.3).
(Rupees crore) |
||||||
|
|
||||||
Month |
Average |
Transactions in |
Commercial |
Certificates |
Commercial Bills |
Forward Rate |
Daily |
Repo Market |
Paper |
of Deposit |
Rediscounted |
Agreements/ |
|
Turnover in |
(Outside |
(Outstanding |
(Outstanding |
by commercial |
Interest Rates |
|
Term Money |
Reserve |
Amount) |
Amount) |
banks |
Swaps (Notional |
|
Market |
Bank) |
Amount) |
||||
|
|
||||||
1 |
2 |
3 |
4 |
5 |
6 |
7 |
|
|
||||||
2002-03 |
||||||
April |
225 |
47,020 |
8,046 |
1,393 |
371 |
88,813 |
May |
123 |
44,431 |
8,111 |
1,360 |
463 |
1,03,993 |
June |
135 |
37,848 |
8,447 |
1,359 |
701 |
1,17,644 |
July |
108 |
34,170 |
8,520 |
1,303 |
400 |
1,24,453 |
August |
1,179 |
33,281 |
9,125 |
1,007 |
341 |
1,32,354 |
September |
247 |
41,768 |
9,549 |
1,236 |
572 |
1,31,898 |
October |
117 |
46,595 |
8,426 |
1,394 |
502 |
1,31,340 |
November |
392 |
34,503 |
8,599 |
1,219 |
332 |
1,53,260 |
December |
454 |
37,651 |
9,025 |
1,163 |
462 |
1,61,566 |
January |
288 |
66,599 |
8,554 |
1,226 |
455 |
1,92,170 |
February |
281 |
65,413 |
7,070 |
1,125 |
295 |
2,18,816 |
March |
546 |
74,236 |
5,749 |
908 |
105 |
2,44,161 |
2003-04 |
||||||
April |
604 |
41,815 |
5,994 |
1,485 |
164 |
2,49,449 |
May |
455 |
43,328 |
6,820 |
1,996 |
334 |
2,84,048 |
June |
610 |
48,605 |
7,108 |
2,183 |
393 |
2,93,127 |
July |
573 |
74,936 |
7,557 |
– |
364 |
3,01,062 |
|
|
||||||
– Not Available. |
||||||
Certificates of Deposit issued by Banks
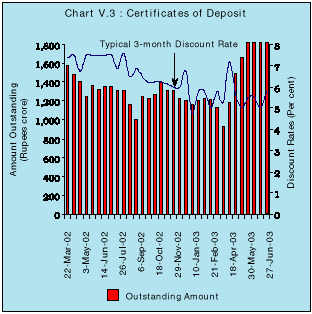
5.9 The market for certificates of deposit (CDs), which are essentially securitised high cost short-term time deposits, tends to be active when liquidity conditions tighten and banks try to meet the liquidity gap by issuing CDs, often at a premium. Comfortable liquidity kept the outstanding amount of CDs low during 2002-03 (Appendix Table V.2). The typical discount rate for 3-month CDs softened, especially during the second half of the year (Chart V.3). During 2003-04 (up to June 27), the issuances of CDs rose and the typical discount rate showed some hardening.
Commercial Paper
5.10 Commercial Paper (CPs) and CDs exhibit contrasting behaviour. Activity in the CP market picks up amidst ample liquidity conditions when eligible entities can raise funds through CPs at an effective rate of discount lower than the lending rate of banks. The outstanding amount of CPs rose during the first three quarters of 2002-03 before shifts in market sentiment drove down issuances (Chart V.4 and Appendix Table V.3). A marginal decline in the cumulative flow of primary issuances of CPs during 2002-03 as against 2001-02 reflected primarily a fall in primary issuances by the manufacturing companies which had access to sub-PLR lending. On the other hand, the primary issuances of leasing and finance companies and those of financial institutions moved up. The weighted average discount rate (WADR) of the CP softened, with the spread between the prime rated and medium rated companies narrowing during 2002-03.
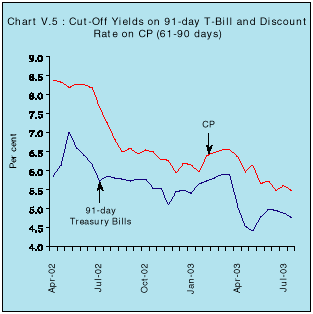
5.11 The outstanding amount of CPs has risen so far during 2003-04 (up to July). Ample liquidity conditions in the beginning of 2003-04 generated activity in the CP market. The WADR declined steadily. The spread between the yields of CP (61-90 days) and 91-day Treasury Bills widened around mid-May 2003 reflecting the substantial drop in the cut-off yields of 91-day Treasury Bills. A recovery in the 91-day Treasury Bill yields narrowed the spread subsequently (Chart V.5).
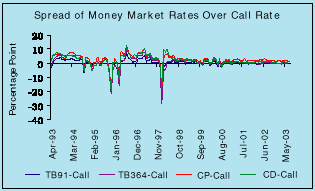
5.12 Money market rates have exhibited a significant degree of synchronicity indicating that they are increasingly getting jointly determined by a common set of factors embodied in macroeconomic and financial conditions. In contrast to earlier instances of joint behaviour in episodes of uncertainty, the recent convergence has occurred under ample liquidity conditions as well as orderliness and selectivity in bid/ offer activity (Box V.1)
Box V.1 A significant feature of financial market behaviour during 2002-03 was a close co-movement of market segments at the short-end, i.e., call money, Treasury Bills, CP and CDs. Rates in these markets frequently joined the call rates in dipping below the repo rate, the informal floor for the financial market spectrum in India, on many occasions during the course of the year. Similar co-movement was evident in turnovers. The consequent narrowing of spreads at the short end of the market spectrum and the strength of this synchronicity has implications for the operational efficiency of markets as well as for the effectiveness of the transmission of monetary policy which typically operates at the short end of the market structure (Chart). Recognition of this interesting development was reflected in the Statement on Monetary and Credit Policy for 2003-04: 'interest rates in money market instruments converged to a narrow band….'. In the literature, convergence of risk-adjusted returns is regarded as a necessary condition for market integration, though not a sufficient one. In particular, co-movement in rates is suspect since financial market rates show 'random walk' in that they exhibit no tendency to return to trend value once disturbed. Moreover, association in rate movements may indicate contagion rather than integration. Empirical investigation conducted in the Reserve Bank in a vector error correction model (VECM) framework indicated contemporaneous episodes of excess returns in the call, Treasury Bill, CP and forward segment of the foreign exchange market during periods of turbulence in financial markets. Simultaneous presence of excess returns disappeared with the return of stability in market activity. This asymmetric integration constrains the conduct of monetary policy since simultaneous interventions are required in the disturbed segments and monetary policy could be imprisoned in a self-fulfilling vicious circle. It is important, therefore, to carefully sift through the empirical evidence on market integration for calibrating the reaction of monetary policy to market movements. Correlation may well obscure the differences in maturity, liquidity and risk characteristics. In particular, it is important to closely scrutinise the stylised evidence of market synchronicity in periods of calm as opposed to the earlier exercise which was conducted on episodes of perturbation. Similar efforts have been conducted in the context of mature financial markets. With the introduction of the gilt repo in the UK money market, tighter spreads were observed between the two-week market rate and the official repo rate, resulting in lower money market volatility at the very short end of the money market curve with no sign of volatility transmission up the curve. Stability in the long-run relationship between the policy rate and T-bill rate under shifting monetary policy regimes was observed in an error correction framework capturing both asymmetries and non-linearities in interest rate dynamics in the US. Co-movement in various money market rates is often explained by the market's expectations about the operating rate over the term of the instrument plus a risk premium. A broad conclusion emerging from these country specific studies is that integration in money market segments tends to reduce volatility. This would work towards improving the transmission of monetary policy. Empirical investigation of the relationship between the money market rates in a co-integration framework in India indicates the presence of a unique and stable long-run co-movement, despite their being unstable (non-stationary) individually. A vector error correction process suggests that the call rate adjusts rapidly to exogenous disturbances and 'herds' other money market rates back to equilibrium. These findings indicate that money market segments are getting integrated even in periods of normalcy, and the call rate could well emerge as the reference rate for the money market. Broadbasing of the Negotiated Dealing System and the establishment of CCIL as a central counter party risk manager would foster market integration by reducing uncertainty relating to funds position. The implementation of RTGS would reduce the settlement risks and strengthen the co-movement of money market rates. This would also help in developing a continuous short-term rupee yield curve through efficient price discovery. References
|
Commercial Bill Market
5.13 The market for bills rediscounting recorded a general decline in activity during 2002-03. The outstanding amount of commercial bills rediscounted by commercial banks with various financial institutions (FIs) was nearly half of the volume in April 2002 than a year ago. As the year progressed, commercial bill rediscounting activity by the FIs trailed off substantially since May. Small Industrial Development Bank of India (SIDBI), however, continued to rediscount a major part of the commercial bills as it accounted for 78.2 per cent of the total transactions in this market segment during 2002-03. During 2003-04 (up to July 2003), the market for bills rediscounting recorded a rise with SIDBI continuing to remain the major participant.
Repurchase Agreements (Other than LAF)
5.14 During 2002-03, the weekly transaction volumes (first leg only) in the market repo segment ranged between Rs.5,248 crore and Rs.18,749 crore. The imposition of call money exposure restriction on banks and primary dealers coupled with the process of phasing out of non-banks from the call/notice money market prompted market participants to take increased recourse to the repo market, thereby driving up the average weekly transactions in the repo market to Rs.14,898 crore during mid-December 2002 to March 2003 from Rs.9,087 crore during April to mid-December 2002. Repo rates generally ranged between 4.00 per cent and 8.50 per cent during the year except for occasional spikes.
5.15 During the year 2003-04 (up to July 25, 2003), the weekly volume (first leg only) in the repo market ranged between Rs.6,030 crore and Rs.20,725 crore and rates generally ranged between 2.50 per cent and 6.50 per cent. The volume of transactions in the repo market rose more sharply in July 2003, reflecting increased participation of non-banks as their lendings in the call/notice money market were further scaled down in June 2003.
Forward Rate Agreements (FRAs)/ Interest Rate Swaps (IRS)
5.16 There was a sharp increase in the volume in the Forward Rate Agreements (FRAs)/Interest Rate Swaps (IRS) market (See Table 5.3). Despite a significant increase in the number and amount of contracts, participation in the market continues to remain restricted to select foreign and private sector banks and a primary dealer. In a majority of these contracts, National Stock Exchange-Mumbai Inter-bank Offered Rate (NSE-MIBOR) and Mumbai Inter-bank Forward Offered Rate (MIFOR) were used as the benchmark rate. The other benchmark rates used include yield on government paper with one-year residual maturity and primary cutoff yield on 364-day Treasury Bills.
Collateralised Borrowing and Lending Obligation
5.17 Collateralised Borrowing and Lending Obligation (CBLO) was operationalised as a money market instrument through the Clearing Corporation of India Ltd. (CCIL) on January 20, 2003 with original maturity between one day and up to one year. There were 52 members in CCIL's CBLO segment as on July 31, 2003. The total turnover in CBLO stood at Rs.7,925 crore, with a daily average turnover of Rs.74 crore.
5.18 Tightness prevailed in the foreign exchange market during the first three months of 2002-03. Concerns regarding rising crude oil prices, tensions in Gujarat and short covering by importers exerted pressure on the spot exchange rate of the Rupee visa-vis the US dollar which depreciated by 0.4 per cent during April 2002. Heightened border tensions led to a burst of hectic short covering which dragged down the spot rate even further in May. A renewal of demand for US dollars amidst receding supplies of foreign investment kept the spot rate weak in June. The excess demand conditions were reflected in the gap in the merchant segment of the spot market turnover. In the inter-bank segment, banks took positions with respect to merchant activity.
5.19 The spot exchange rate firmed up from the third week of June as rising repatriation of export proceeds eased supply conditions and demand from corporates and importers moderated. The weakening of the US dollar against major currencies also shored up the Rupee. Heavy inflows in the last week of June on account of FDI strengthened the recovery.
5.20 Supplies continued to rise in the second quarter from export proceeds, unwinding of long dollar positions by banks and remittance inflows. The US dollar continued to weaken against the Euro and the Japanese Yen reflecting weak US economic data and financial irregularities in the US corporate sector which lowered investor confidence. The gains in the spot rate, however, were capped by demand from public sector banks. In terms of monthly averages, the spot exchange rate appreciated by 1.0 per cent between April-September 2002 despite net purchases from the market by the Reserve Bank.
5.21 The spot rate continued to gain strength as remittances from exporters, non-resident Indians and foreign direct investment continued while demand remained slack during October-November. Falling global crude oil prices and rising levels of foreign exchange reserves improved market sentiment and the spot exchange rate appreciated by 0.7 per cent in the third quarter with purchases by the Reserve Bank arresting further gains (Table 5.4). Lingering weakness in the US dollar against major currencies owing to dismal US economic fundamentals contributed to the Rupee's gains. Purchases by the Reserve Bank checked the spot appreciation at 1.1 per cent at end-November 2002 over end-March 2002.
5.22 An increase in foreign investment flows from end-December 2002, despite mounting tensions in the Middle East, kept sentiments in the market upbeat and poised for further gains. Nevertheless, the real effective exchange rate (Reserve Bank’s five - country trade weighted indices - Base: 1993-94=100) of the Rupee was undervalued by around three per cent by March 2003 over March 2002, given the steep decline in US dollar against other currencies (Chart V.6).
5.23 Soaring global crude oil prices resulting from war fears weighed heavily on market sentiment in the last quarter of the year, despite the significant liberalisation of banks' overseas investment and relaxation of restrictions in the forward market. Robust inflows of exports proceeds and inward remittances, however, continued to provide support to the spot exchange rate. On the basis of monthly averages, the Rupee appreciated against the US dollar by 2.3 per cent in 2002-03.
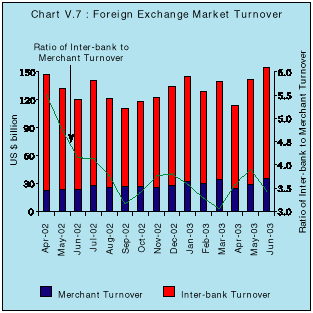
5.24 Activity in both the merchant and inter-bank segments of the foreign exchange market rose strongly (Chart V.7 and Appendix Table V.4). The inter-bank to merchant turnover ratio, however, declined, indicating the stability of market conditions and the narrowing of interest differentials.
5.25 In cross currency trade, the Rupee weakened against the Euro, the Pound Sterling and the Japanese Yen during the first four months of 2002-03. The Rupee regained strength against the three currencies over the period August-October 2002 in alignment with the US dollar. With the US dollar's weakening from November 2002 onwards, the Rupee steadily depreciated against other major currencies over the rest of the year (Chart V.8).
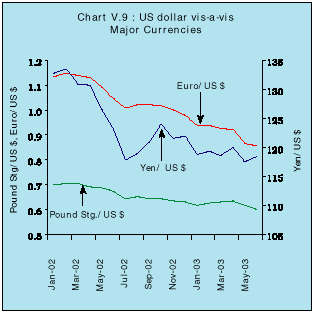
5.26 In terms of monthly averages, the US dollar depreciated against the Euro, the Pound Sterling and the Japanese Yen (Chart V.9). The US dollar's depreciation against the major currencies at the beginning of 2002 became more pronounced during the course of the year with the shift in foreign capital from US financial products to the European market. The US dollar was also weighed down by factors such as the impending war with Iraq and tensions concerning North Korea. The softness of the dollar has been ascribed to several fundamental factors which include the large and persistent current account deficit of the US, subdued growth with uncertain prospects for a faster recovery and the worsening of geo-political environment. For non-dollar area investors with investments in dollars, there was an erosion in the value of portfolios by more than 30 per cent in just one year and any further fall in the US dollar could trigger a major change in the pattern of global capital flows. Developing countries such as South-East Asian economies, whose exchange rates are linked to the US dollar, benefited from the soft dollar environment as their exports to non-dollar areas became competitive. If the fall in the US dollar continues there is, however, a risk that the interest rate cycle in the US may reverse much earlier than expected.
5.27 The Rupee continued to gain strength against the US dollar during the first four months of 2003-04. In terms of monthly average exchange rates, the Rupee appreciated by 3.0 per cent against the US dollar during the period. Sustained foreign exchange inflows from export proceeds, remittances and investments by FIIs continued to provide strength to the Rupee in the face of subdued demand for the US dollar. Absorption of flows by the Reserve Bank/ state-run banks, however, kept the Rupee in the range of Rs.46.09- Rs.47.46 per US dollar during April-July 2003. The outlook for the Rupee remains buoyant with a lingering weak dollar against the other major currencies, large inflows of dollar through entities such as exporters and foreign funds and rising foreign exchange reserves. The exchange rate of the Rupee was Rs. 45.91 per US dollar on August 13, 2003.
5.28 In cross-currency trade, the Rupee continued to weaken against the Euro after US dollar lost grounds against this unit in overseas markets. In terms of monthly average exchange rates, the Rupee depreciated against the Euro by 2.0 per cent during the first four months of 2003-04. The Rupee, however, appreciated by 0.4 per cent against the Pound Sterling and 3.0 per cent against the Japanese Yen during the same period.
Forward Market
5.29 Excess demand conditions prevailed in both merchant and inter-bank segments of the forward exchange market during the first quarter of 2002-03. One-month and the six-month forward premia hardened in May. As the spot market recovered in June, excess supply conditions characterised the forward market and continued to prevail during the rest of the year. The excess supply conditions in the forward segment necessitated a reversal in the strategy of intervention by the Reserve Bank. Outstanding net forward sales of the Reserve Bank remained negative up to August 2002. Forward premia in all maturities declined steadily reflecting heavy forward sales by exporters and easy liquidity conditions in the domestic money market (Chart V.10).
5.30 The covered interest parity (CIP) condition would suggest that forward rates reflect the differential between domestic and foreign interest rates. In the recent period, however, downward movements in the forward premia have been driven by the anticipation of further appreciation of the spot exchange rate against the US dollar. This is broadly consistent with the theory of efficient markets which postulates that the forward rate is a predictor of the future spot rate. This phenomenon is strengthened by a rush to borrow foreign exchange overseas at relatively low interest rates and convert it into rupee assets which attract a relatively higher rate of return. If the spot exchange rate does appreciate, the borrowers of foreign exchange expect to make a financial gain (as fewer rupees would be required to repay the 'borrowed' dollars). This situation is also reflected in banks going 'short' on dollars during intra-day and inter-day foreign currency trade. At the same time, however, corporates and other market participants accumulate large 'unhedged' exposures on their future dollar obligations such as imports and debt service payments. These conflicting considerations warrant a re-appraisal of the intrinsic relationship between spot and forward exchange rates (Box V.2).
5.31 Reflecting the excess supply condition in the spot exchange market, the average one-month and three-month forward premia declined by 102 basis points and 95 basis points to 2.79 per cent and 2.65 per cent, respectively, during April-July 2003.
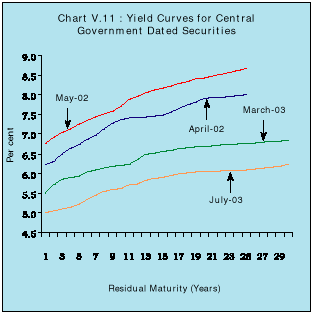
5.32 Yields declined in the secondary segment of government securities market during 2002-03 for the third year in succession reflecting ample liquidity and persistent expectations of interest rate cuts. Yields across residual maturity exceeding 14 years fell sharply relative to the benchmark 10-year security, flattening the yield curve (Chart V.11). The aggregate volume of transactions in Central and State Government dated securities and Treasury Bills (outright as well as repos) rose during the year, although the share of outright transactions decreased (Appendix Table V.6).
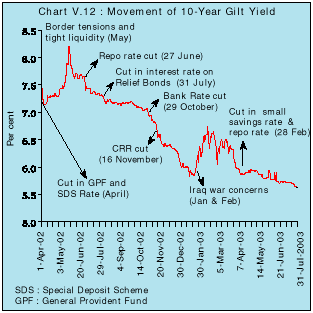
5.33 The easing of liquidity conditions at the beginning of 2002-03 and reductions in administered interest rates set a bullish tone to the government securities market during the first week of April 2002. OMO sales stabilised the market and sentiment turned cautious. Tensions at the border and tighter liquidity conditions hardened the yields on the government paper, pushing the 10-year yield to a high on May 21, 2002 (Chart V.12). The Reserve Bank's private placement assuaged market sentiment and drove down yields by end-May 2002.
5.34 The repo rate cut on June 27, 2002 spurred a rally in the gilt market. Moreover, reduction in administered interest rates and anticipations of further reductions in U.S. interest rates resulted in easing the liquidity situation which exerted a downward pressure on yields. The lowering of CRR and the Bank Rate in the Mid-Term Review of Monetary and Credit Policy of 2002-03 and a cut in the Fed Funds target rate helped sustain the rally in November 2002. After the benchmark 10-year yield breached the Bank Rate on December 27, 2002, the gilt market experienced a sharp rally which culminated in 10-year yield reaching the year's low on January 22, 2003. OMO sales and apprehensions of military action in the Middle East reversed trends in yields in the last week of January 2003. Reduction in the small saving rates announced in the Union Budget 2003-04, followed by a repo rate cut regenerated a rally in government paper. The rally was, however, short-lived and turnovers fell in March 2003 due to inflation concerns and ongoing military action in Iraq. Gilt prices recovered towards the end of March as the Iraq war abated.
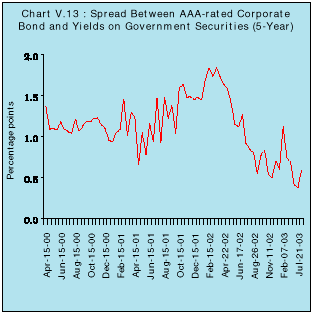
5.35 The decline in yields in the 2 to 5 year segment averaged around 60 basis points while in the 6 to 10 year and 11 to 20 year tenors the fall in yields was of the order of 102 and 115 basis points, respectively, on account of active trading interest at the long end in a period of low interest rates. On the other hand, the relative stability of the overnight call rates checked similar reductions in the yields of government securities of the shorter tenors. This resulted in a flattening of the yield curve during the year. The spread between AAA-rated corporate bonds and government securities narrowed during 2002-03 (Chart V.13).
5.36 Ample liquidity conditions and declining inflation generated a rally in gilt prices, especially in the short (below five years) maturity segment, in April 2003. The yield curve steepened immediately after the announcement of the Monetary and Credit Policy with surplus liquidity drawing down short-term yields. The yield curve, however, flattened during the last three weeks of May 2003 reflecting lowering of inflation expectations. The yields continued to fall in June 2003 on the back of persistent surplus liquidity, monetary easing in US and other developed countries and fall in inflation rate. The 10-year government yield fell by around 67 basis points during 2003-04 (up to August 16) to 5.54 per cent.
CREDIT MARKETS
5.37 Easy liquidity conditions and monetary policy impulses for softening induced a reduction in deposit rates across all maturities (Table 5.5). Comparable reductions were, however, not fully reflected in the prime lending rates (PLRs). Sub-PLR lending of the banking system (excluding exports, the bulk of which is at sub-PLR rates) constituted over one-third of total lending by December 2002. As many as 40 banks comprising 18 public sector banks (PSBs), 6 foreign banks and 16 private banks reduced their PLRs after the announcement of the mid-term Review of Monetary and Credit Policy in October 2002. The effective lending rates of commercial banks remained high due to wide spreads over the PLR which remained unchanged over 2002-03. The interest rate on home loans came down substantially over the year due to policy initiatives to boost the housing finance market.
(Per cent) |
|||||||
|
|
|||||||
Interest Rates |
July |
March |
December |
June |
September |
March |
|
2003 |
2003 |
2002 |
2002 |
2002 |
2002 |
||
|
|
|||||||
1 |
2 |
3 |
4 |
5 |
6 |
7 |
|
|
|
|||||||
1. Domestic Deposit Rates |
|||||||
Public Sector Banks |
|||||||
a) Up to 1 year |
3.75-5.75 |
4.00-6.00 |
4.25-6.25 |
4.25-6.75 |
4.25-6.75 |
4.25 – 7.50 |
|
b) 1 year up to 3 years |
5.00-6.25 |
5.25-6.75 |
6.00-7.00 |
7.00-8.00 |
6.50-7.75 |
7.25 – 8.50 |
|
c) Over 3 years |
5.25-6.50 |
5.50-7.00 |
6.50-7.25 |
7.50-8.25 |
7.00-8.25 |
8.00 – 8.75 |
|
Private Sector Banks |
|||||||
a) Up to 1 year |
3.00-7.00 |
3.50-7.50 |
3.50-8.00 |
4.00-8.75 |
4.00-8.75 |
5.00 – 9.00 |
|
b) 1 year up to 3 years |
5.50-7.50 |
6.00-8.00 |
6.50-8.25 |
7.25-9.50 |
7.25-9.50 |
8.00 – 9.50 |
|
c) Over 3 years |
5.75-8.00 |
6.00-8.00 |
6.50-8.50 |
8.00-10.0 |
7.50-9.50 |
8.25 – 10.0 |
|
Foreign Banks |
|||||||
a) Up to 1 year |
3.00-7.75 |
3.00-7.75 |
3.25-7.75 |
4.25-9.75 |
4.00-9.75 |
4.25 – 9.75 |
|
b) 1 year up to 3 years |
3.50-8.00 |
4.15-8.00 |
4.50-8.00 |
6.25-10.0 |
5.50-10.0 |
6.25 – 10.0 |
|
c) Over 3 years |
4.50-8.50 |
5.00-9.00 |
4.75-8.50 |
6.25-10.0 |
5.50-10.0 |
6.25 – 10.0 |
|
2. Prime Lending Rates |
|||||||
Public Sector Banks |
9.00-12.25 |
9.00-12.25 |
9.00-12.50 |
10.00-12.50 |
10.00-12.50 |
10.00–12.50 |
|
Private Sector Banks |
8.00-15.50 |
7.00-15.50 |
9.00-15.50 |
10.00-15.50 |
9.50-15.50 |
10.00–15.50 |
|
Foreign Banks |
5.45-17.50 |
6.75-17.50 |
6.50-17.50 |
7.90-17.50 |
7.40-17.50 |
9.00 –17.50 |
|
|
|
|||||||
5.38 Four factors are generally attributed to the rigidity of bank lending rates in India. First, deposit offer floating interest rates on deposits. holders expect nominal rates which are reasonably in excess of inflation. Secondly, offering fixed deposit rates is the traditional practice. Thirdly, non-interest operating expenses as well as the carrying costs of non-performing assets (NPAs) push up the lending rates. Fourthly, the persistent and large volume of market borrowing requirements of the Government gives an upward bias to the interest rate structure. In the recent years, there has, however, been considerable progress in relaxing these constraints. Inflation rates have moderated, interest cost of government borrowings have come down and banks are being encouraged to Furthermore, recent reductions in deposit rates and administered interest rates on small savings have created the environment for commensurate lowering of lending rates. A key issue in this context is locating the appropriate level of the real lending rate. There is some criticism, particularly in industry circles, that bank lending rates remain high. On the other hand, there is the apprehension that too low real lending rates may push the economy into a deflationary gap (Box V.3).
Mobilisation of Resources by Non-Bank Financial Sector
Financial Institutions
5.39 Select all-India financial institutions (FIs) have been permitted by the Reserve Bank to raise resources by way of term money borrowings, issue of CDs, CPs, acceptance of term deposits and inter-corporate deposits (ICDs). The aggregate limits of FIs for raising of resources declined essentially on account of mergers and a sharp reduction in net owned funds of the IFCI during the course of 2002-03. As a result, the outstanding aggregate amount of resources raised by the FIs (IDBI, IFCI Ltd., EXIM Bank, SIDBI, IIBI Ltd., TFCI Ltd., NABARD, IDFC Ltd. and NHB Ltd.) by way of short-term money market instruments declined during the year. On an average, ICDs continued to remain the preferred instruments, followed by term deposits, CPs, CDs and term money borrowings.
5.40 The interest rate offered on term money borrowings by FIs reflected the easy liquidity conditions and declined sharply towards the end of the year. Interest rates on CDs issued by the FIs and ICDs followed a similar pattern. Term deposit rates remained range bound over the year, 2002-03.
5.41 Total resource mobilised by way of issue of rupee bonds/ debentures (including private placement and public issue) by select all-India FIs rose significantly during 2002-03 as they took advantage of falling interest rates to retire their old high cost debt. The weighted average maturity of instruments across these FIs varied between 2.3 years and 8.5 years. The average interest rates on resources mobilised by way of rupee bonds/debentures by these FIs was in the range of 6.1 per cent per annum and 12.8 per cent per annum (Table 5.6).
Non-Banking Financial Companies
5.42 The slowdown in the activities of the non-banking financial companies (NBFCs) continued. Public deposits held by NBFCs as a proportion to aggregate deposits of commercial banks declined sharply from 2.2 per cent in December 2000 to 1.5 per cent in March 2003 reflecting investors’ aversion towards riskier saving options. The interest rate ranged between 10 per cent to 12 per cent for 35.11 per cent of the deposits, and 12 to 14 per cent for 38.71 per cent of the deposits mobilised by NBFCs (excluding residuary non-banking companies) as at end-March 2002. According to the information pertaining to large NBFCs (including RNBCs) with a deposit base of Rs.20 crore and above, the aggregate public deposits amounted to Rs.17,615 crore for 25 companies as at March 2003 as compared with Rs.17,842 crore for 42 companies as at end-March 2002.
5.43 The capital market remained depressed during 2002-03. The primary market was subdued mainly due to lack of demand for funds by the corporates. Positive investor response to quality issues in the primary market, however, points to selectivity breaking through a generalised risk aversion. The secondary market was weighed down by a host of adverse domestic developments as well as the sell-offs in international equity markets in the first half of the year. Notwithstanding fall in prices of blue chip scrips, mid-cap scrips, PSU scrips and bank scrips experienced increased buying interest.
Primary Market
5.44 The primary capital market, which comprises the public issues and the private placement market, is a source of funds (both equity and debt) for the corporates and an avenue for investment of surplus funds by the investors. During the last few years, resource mobilisation from the public issue market has been declining. Paucity of new issues entering the market and fading investor interest continued to characterise the market during 2002-03 (Chart V.14 and Table 5.7).
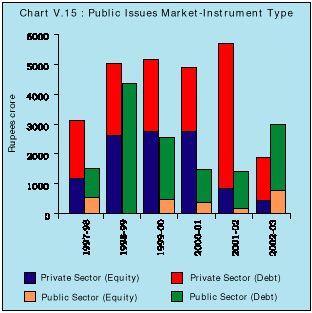
5.45 The bulk of resource mobilisation from the public issues market in 2002-03 was by banks and FIs. Prompted by the positive secondary market response to banking sector stocks, three public sector banks floated equity issues. In addition, there were five bond issues by the IDBI and three bond issues by the ICICI Bank. Resources mobilised by non-Government non-financial public limited companies declined sharply (Appendix Table V.10 and Chart V.15).
5.46 In sharp contrast to the public issues market, the private placement market has emerged as an alternative and more convenient source of funds for the corporate sector, even though the growth of this market has slowed down during the last few years. The decline in resource mobilisation during 2002-03, however, is partly attributable to the ICICI-ICICI Bank merger, since the erstwhile ICICI was a large mobiliser of funds from the private placement market. The non-financial sector mobilised a larger part of resources from the private placement market. While state level undertakings and banks continued to raise substantial resources from the private placement market, the share of AIFIs declined.
5.47 The Euro issues market, which comprises the Foreign Currency Convertible Bonds, Global Depository Receipts and American Depository Receipts, witnessed increased activity during 2002-03.
5.48 The deceleration in activity in the primary capital market, especially in the public issues market could be attributed to factors operating both on demand and supply. The tightening of disclosure standards and entry point norms by the SEBI has meant that only companies with established track record are able to access the market. This has helped improve the quality of paper and checked fly-by-night operators. Nevertheless, some issues have been highly oversubscribed even in the depressed market conditions, suggesting that investor interest is marked by selectivity rather than general market aversion. During 2002-03, most of the issues were oversubscribed and there was not even a single issue which was not fully subscribed. The slackening of investment by the private corporate sector since the second half of 1990s has affected the demand for funds. The demand for funds by corporates is contingent on several factors impinging on the overall macroeconomic environment as well as sector-specific/firm-specific factors that shape the investment climate (Box V.4). During April-June 2003, the primary market witnessed further slowdown as there was no issue in the public issues market as compared with three issues aggregating Rs.613 crore during the corresponding period of the previous year. There was one issue of Rs.224 crore during April-June 2003 in the Euro issues market.
Mutual Funds
5.49 Under the overall depressed conditions in the capital market, resource mobilisation by mutual funds during 2002-03 declined mainly due to net outflow of funds from the UTI, which was restructured during the year (Table 5.8).
(Amount in Rupees crore) |
|||||
|
|
|||||
Item |
2002-03 |
2001-02 |
|||
No. of |
Amount |
No. of |
Amount |
||
Schemes |
Schemes |
||||
|
|
|||||
1 |
2 |
3 |
4 |
5 |
|
1. Unit Trust of India |
59 |
-9,434 |
72 |
-7,284 |
|
2. Public Sector Mutual Funds |
74 |
1,988 |
69 |
1,474 |
|
3. Private Sector Mutual Funds |
337 |
12,026 |
266 |
12,947 |
|
Total (1 to 3) |
470 |
4,580 |
407 |
7,137 |
|
|
|
|||||
Notes: |
1. Data are provisional. |
||||
2. For UTI, the figures are net sales (with premium), including re- Investment sales, and for other mutual funds, figures represent net sales under all schemes. |
|||||
3. Data exclude amounts mobilised by off-shore funds and through roll-over schemes. |
|||||
5.50 The subdued conditions in the secondary equity market and buoyancy in the debt market enabled debt schemes to attract funds in 2002-03 (Table 5.9). Of the total asset under management of Rs.1,09,299 crore at end-March 2003 (as against Rs.1,00,954 crore at end-March 2002), net assets under debt schemes accounted for 74.0 per cent, followed by nearly equiproportional shares of equity and balanced schemes at 13.0 per cent. The resource mobilisation by mutual funds rose sharply during April-June 2003 to Rs.19,432 crore as compared with an outflow of Rs.832 crore during the corresponding period of the previous year.
Secondary Market
5.51 The downtrend in the domestic stock markets, which set in during March 2001, persisted throughout 2002-03 due to a combination of adverse domestic and international developments such as border tensions, unsatisfactory monsoons, lower than expected quarterly results of some major corporates, continuing uncertainties regarding the PSU disinvestment programme, tensions in the Middle East and the rise in international oil prices (Chart V.16 and Appendix Table V.11).
5.52 Market sentiment was also affected by the sharp decline in the major international markets in the first half of the year. The BSE Sensex declined by 12.1 per cent on a point-to-point basis over the year which was, however, much lower in comparison with the fall in major international market indices like the Nasdaq Composite Index (by 27.3 per cent) and the Dow Jones Industrial Average (by 23.2 per cent) (Chart V.17).
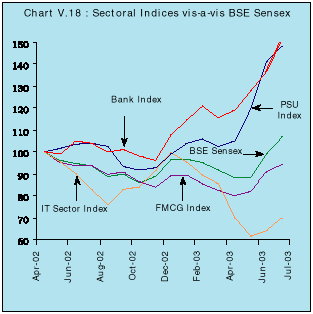
5.53 The stock market was affected significantly by some sector specific factors at different points of time during the year (Chart V.18). In the first half of the year, the BSE Sensex was pulled down by the Fast Moving Consumer Goods (FMCG) sector, which remained subdued on account of drought fears and the depressed Information Technology (IT) sector, which posted lower than expected quarterly results. The BSE Sensex recovered to some extent during November and December 2002 as a result of the rally in PSU stocks on expectations of disinvestment initiatives. Bank scrips, in particular, witnessed a sharp increase almost throughout 2002-03, with improvement in profitability and relaxations on foreign direct investment (FDI) in private sector banks (Box V.5). The BSE Sensex was pulled down by the subdued FMCG and IT sector again in the last quarter of 2002-03.
5.54 Investments in various instruments of the stock market are guided by risk-return perceptions. In the recent period, the rate of interest available on various fixed income instruments has declined sharply following the overall softening of interest rates. Although the stock markets experienced a sharp reduction in volatility during the last three years, returns from the stock markets declined. As a result of the decline in prices, the P/E ratio and overall market capitalisation also declined. There was, however, improvement in the turnover ratio reflecting increased liquidity (Table 5.10).
|
|
|||||
Indicator |
BSE |
NSE |
|||
2002-03 |
2001-02 |
2002-03 |
2001-02 |
||
|
|
|||||
1 |
2 |
3 |
4 |
5 |
|
|
|
|||||
1. |
BSE Sensex/S&P CNX Nifty |
||||
(i) Average |
3206 |
3332 |
1037 |
1077 |
|
(ii) End of the year |
3049 |
3469 |
978 |
1130 |
|
2. |
Co-efficient of Variation (%) |
4.9 |
7.2 |
5.2 |
6.8 |
3. |
Price -Earning Ratio@ |
14.5 |
16.6 |
15.2 |
15.7 |
4. |
Price-Book Value Ratio@ |
2.2 |
2.4 |
2.6 |
2.6 |
5. |
Yield @ (per cent per annum) |
2.2 |
2.0 |
2.1 |
1.2 |
6. |
Listed Companies # |
5,650 |
5,782 |
673 |
793 |
7. |
Turnover (Rupees crore) |
3,14,073 |
3,07,292 |
6,17,989 |
5,13,167 |
8. |
Market Capitalisation # (Rupees crore) |
5,72,197 |
6,12,224 |
5,37,133 |
6,36,861 |
9. |
Turnover Ratio |
0.5 |
0.5 |
1.2 |
0.8 |
|
|
|||||
@ |
Based on scrips included in the BSE Sensex and the S&P CNX Nifty and are averages for the year. |
||||
# |
As at end-March. |
||||
Source : The Stock Exchange, Mumbai and the National Stock Exchange of India Limited. |
|||||
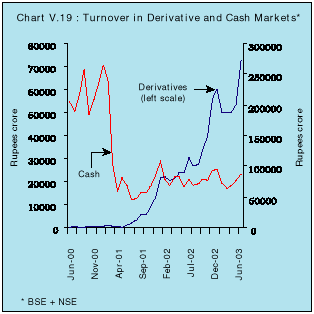
5.55 Increased liquidity has also been noticed in the derivatives market. The growth of derivatives market, especially single stock futures, suggests growing popularity of the segment (Chart V.19 and Appendix Table V.12).
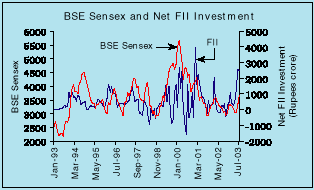
5.56 In the absence of a significant presence of retail investors, the stock markets in India are increasingly influenced by institutional investors. Investments by mutual funds declined as they continued to shift from equities to debt in search of better returns. Investments by FIIs also slowed down sharply during 2002-03 (Table 5.11). Net investment by FIIs turned negative during April-June 2002, driving down the stock market. As net investment by FIIs turned positive subsequently, the market recovered and moved in a narrow range. Significantly, FIIs made investments in the debt instruments of Rs.4,151 crore during November 2002-July 2003. It was, however, not at the cost of investment in the equity market (Rs.9,288 crore). Investments by FIIs are influenced both by global factors such as interest rate changes, inflationary expectations, etc., as also, growth prospects and performance of the corporate sector (Box V.6).
Box V.6 The globalisation of the world economy during the 1990s resulted in a substantial increase in portfolio flows from industrialised countries to emerging market economies. Private portfolio flows to emerging markets rose steadily from US $ 56.1 billion during 1992 to US $ 94.6 billion during 1996 but thereafter fell to US $ 1.7 billion during 1998, driven by outflows from the five crisis-affected Asian countries of Indonesia, Korea, Malaysia, Philippines and Thailand. Portfolio flows recovered to around US $ 41.4 billion in 1999. While there is little disagreement about the benefits of portfolio flows as a source of funds, their 'hot money' character has often escalated the possibilities of contagion. This has sparked off a considerable interest in the determinants of capital flows. Portfolio flows are, by and large, determined by the performance of stock markets of the host economy relative to that of the home economy. There is empirical evidence to suggest that equity flows would be 'pulled' towards an economy with relatively higher returns. When the recipient economy is small, equity inflows could also be 'pushed' in once stock returns in the rest of the world rise sufficiently to allow investors to take such risks. Official policies, especially in terms of capital controls, influence the scale of portfolio flows. The degree of cross-country portfolio diversification which the investors in the developed economy are willing to accept often depends on the 'home bias' which is, however, gradually eroding with the increase in global financial integration and the degree of risk spreading enabled by such investments. For example, emerging equity markets were reported to be offering higher returns at more or less unchanged or reduced portfolio risks during 1988-94. During 1995-98, they yielded lower returns, without reducing portfolio risk. Other factors explaining portfolio flows include interest rate differentials, volatility in the stock markets, exchange rate fluctuations and measures of country risk. There are also feedback-trading effects in that gains (losses) in an economy tend to reinforce the next round of investment (disinvestment). Portfolio inflows are often persistent and besides, such flows to different countries in a particular region often tend to be highly correlated. Stylised evidence suggests that the advantages of informed trading explains about three-fourth of the total persistence. Finally, portfolio flows to emerging market economies in the late 1990s were also driven by sector-specific factors such as the availability of technology scrips during the technology boom of the late 1990s. The evidence on determinants of portfolio flows continues to be mixed depending on model specifications. One set of results suggests that FII flows are, by and large, driven by stock market returns while other variables such as US and world returns and country risk returns are not very significant in explaining capital flows. Other findings indicate that portfolio flows are affected by a combination of domestic, regional and global variables including global interest rates, lagged returns in emerging markets, nominal depreciation expectations of the exchange rate and credit rating downgrades. India opened its stock market to FIIs in September 1992. As at end-March 2002, about four-fifth of FII investment emanated from the USA, UK and Western Europe. FII flows were consistently positive for the first few years reflective of buoyant stock market conditions but turned negative in September 1997 for the first time at the time of the Asian crisis (Chart). Although there have been a few periods of net outflows during brief episodes of foreign exchange market volatility, they were quickly reversed once stability returned to the financial markets. An analysis of the data reveals that FII flows and stock market performance in India are strongly correlated. Daily data for the period October 1999-January 2002 show that there is a bi-directional causality between FIIs' equity investments and changes in the BSE Sensex. This implies that portfolio decisions made by FIIs influence and, in turn, are influenced by the market performance. References
|
(Rupees crore) |
||||
|
|
||||
FIIs |
Mutual Funds |
|||
Year |
Equity |
Debt |
Equity |
Debt |
|
|
||||
1 |
2 |
3 |
4 |
5 |
|
|
||||
2000-01 |
10,124 |
-46 |
-2,767 |
5,023 |
2001-02 |
8,067 |
685 |
-3,796 |
10,959 |
2002-03 |
2,528 |
162 |
-2,067 |
12,604 |
Total |
20,719 |
801 |
-8,630 |
28,586 |
|
|
||||
Source : SEBI |
||||
5.57 Several steps have been taken in the equity markets in recent years to enhance investor protection, and the safety and integrity of the market (Box V.7).
5.58 The process of demutualisation and corporatisation of stock exchanges, which has already been initiated, is expected to improve investor confidence in the stock market (Box V.8).
5.59 Liquidity conditions in money, gilt and foreign exchange segments are expected to remain comfortable over 2003-04, with developments in the year so far providing early indications of market activity in the near term. In the money market segments, rates are expected to remain soft and clustered around the repo rate. The outlook for the Government securities market continues to be positive. The early signs suggest that the liquidity conditions are expected to remain adequate for supporting the government market borrowing programme as well as the off-take of credit for sustaining industrial recovery. The foreign exchange market is reflecting conditions of excess supply which have dominated the first few months of the year. The behaviour of the exchange rate is likely to depend considerably on the movements of the US dollar vis-a-vis other major currencies. The capital market has been experiencing heightened activity recently. Current valuations are attractive and FIIs’ appetite for Indian paper is getting rekindled. The market is expected to further consolidate these gains in the near future. A sustained recovery in financial market activity is contingent upon the abiding strength of the macroeconomic fundamentals and a stronger and more durable recovery in international markets.


