 IST,
IST,
V. Money, Credit And Prices
Changes in the Monetary Policy Framework
Monetary Policy Reforms - An Assessment
Transmission Channels of Monetary Policy
Concluding Observations
Introduction
5.1 In India, the monetary policy framework underwent a significant transformation during the 1990s. Monetary policy emerged as the chief instrument of macroeconomic stabilisation as well as a vehicle for the subsequent structural reforms in the financial system. The objective was to create a competitive environment in the financial sector while ensuring price stability and growth. The growing integration of various markets and increasing globalisation called for reforms in the monetary policy operating framework in terms of instruments, procedure and institutional architecture.
5.2 The efforts towards better fiscal-monetary coordination through the replacement of ad hoc Treasury Bills by a system of ways and means advances provided monetary policy the necessary flexibility. While the twin objectives of the conduct of monetary policy remained the pursuit of price stability and credit availability, the operating procedure shifted from administered and direct instruments of monetary control towards indirect instruments in order to improve the efficiency of resource allocation. Moreover, monetary management had to contend with vicissitudes in capital flows while maintaining orderly conditions in the financial markets during the 1990s. The shifts in the channels of policy transmission as a result of financial liberalisation necessitated a move from the existing monetary targeting framework to a multiple indicator approach. This called for a carefully crafted strategy in which an array of monetary levers – quantum and rate - had to be honed up to harness liquidity conditions to macroeconomic objectives.
5.3 This Chapter undertakes an assessment of the changes in the monetary policy framework in the 1990s. Section I places the imperatives of the reform process in perspective. Section II analyses the changes in the monetary policy framework, in terms of a shift from direct to indirect instruments of monetary control and the enabling structural reforms, including issues in monetary-fiscal co-ordination. Section III evaluates the monetary policy reforms in terms of the inflation outcome and credit availability as well as the maintenance of orderly conditions in the financial markets. It also focuses on key issues like the management of capital flows, the interest rate pass-through and the real interest rate. Section IV examines the impact of reforms on the monetary policy transmission channels. Finally, Section V concludes with a few emerging issues.
I. IMPERATIVES OF MONETARY REFORMS
5.4 India, like most developing economies, followed the path of planned development after Independence, based on the assumption that public savings would fund higher levels of investment. Monetary and credit policy was, therefore, geared to fund the requirements of the fisc, channelising public saving to 'socially purposive' investment. The public sector, however, instead of being a source of savings for the community’s good became, over time, a consumer of community’s savings (Jalan, 2002a). As a result, the Government had to take increasing recourse to a draft of resources from the Reserve Bank and the banking system by fiat.
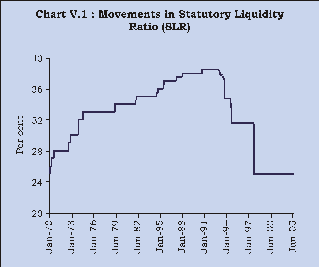
5.5 Fiscal dominance affected the conduct of monetary policy and resource allocation in a number of ways. First, although interest rates on government borrowings were raised during the 1980s – with the weighted yield on government borrowing climbing to 11.41 per cent during 1990-91 from 7.03 per cent during 1980-81 - they were still not high enough to attract voluntary subscriptions (RBI, 1991). As a result, the statutory liquidity ratio (SLR), originally a prudential norm mandating banks to earmark a portion of their liabilities in risk-free instruments, was increased steadily to provide a captive market for government borrowings, constricting portfolio choice (Chart V.1). The SLR was hiked to a peak of 38.5 per cent of net demand and time liabilities (NDTL) in September 1990 from 25.0 per cent in September 1964.
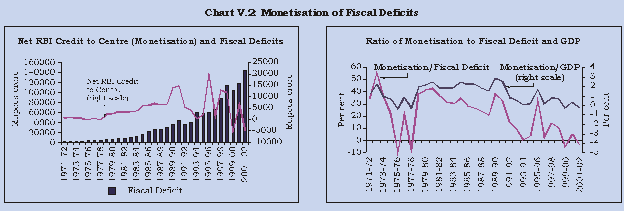
5.6 Second, as the higher SLR was still not sufficient to fund the fiscal deficit, the gap was filled by an almost monotonic increase in the monetisation of the fiscal deficit, with the ratio of monetisation to GDP almost doubling from 1.1 per cent during the 1970s to 2.1 per cent during the 1980s (Chart V.2).
5.7 Third, by the end of the 1980s, there was increasing empirical evidence that the excessive monetary expansion, emanating from the monetisation of the fiscal deficit, was beginning to spill over into inflation (Rangarajan and Arif, 1990). Given a higher elasticity of government expenditure with respect to prices relative to receipts, the higher inflation further widened the fiscal deficit. The consequent necessity of higher monetisation thus brought the inflation-fiscal-monetary nexus into sharp focus (Rangarajan, Basu and Jadhav, 1989; RBI, 2002a).
5.8 Fourth, from the viewpoint of monetary management, the Reserve Bank had to hike the cash reserve ratio (CRR) to contain the inflationary impact of the monetisation of the fiscal deficit, thereby imposing an indirect tax on the banking system. The CRR was raised from the statutory minimum of three per cent of NDTL in September 1962 to 15 per cent in July 1989. By March 1991, commercial banks had to, therefore, set aside over 60 per cent of their incremental resources for meeting statutory pre-emptions (after factoring in a 10 per cent incremental CRR).
5.9 Finally, the need to contain the interest burden of public debt necessitated a regime of administered interest rates, both on the lending and the deposit side, resulting in a degree of financial repression. This blunted the interest rate channel of monetary policy transmission by the 1960s. The Bank Rate, in particular, as an instrument of monetary policy fell into disuse by the mid-1970s.
5.10 The imbalances emerging from deficit financing began to be recognised from the 1960s onwards. It was realised that '…a sizable deficit financed by recourse to the Reserve Bank credit creates difficulties for the Bank in maintaining monetary stability…' (Iengar, 1960). It was also recognised that deficit financing '…should be substantially cut down if not perhaps altogether eliminated for some years ahead, as the capacity of the economy to bear deficit financing has been weakened by continuous recourse to this form of finance…' (Bhattacharya, 1966). The Report of the Committee to Review the Working of the Monetary System (Chairman: S. Chakravarty) (RBI, 1985) emphasised the need to rein in deficit financing 'within safe limits' through a mix of improved management of public finances and an increase in productivity of public enterprises.
5.11 Another integral feature of the monetary and credit policy before the 1990s was the regulation of credit with the stated objectives of curbing inflationary pressures, promoting its effective use, preventing the large borrowers from pre-empting the use of scarce credit and enlarging the spectrum of borrowers covered by banks in the overall context of national policies (RBI, 1985). Public sector banks (and subsequently private sector banks) were advised in 1974 to attain a priority sector lending target of not less than one-third of the outstanding credit by 1979 (40 per cent by March 1985). Although 'social control' enabled deepening of bank finance, the directed credit and investment requirements along with the administered interest rate regime, inter alia, led to a decline in the productivity and efficiency of the banking system (RBI, 1991).
II. CHANGES IN THE MONETARY POLICY FRAMEWORK
5.12 The overarching objective of monetary and financial sector reforms was to set free the process of price discovery with a view to enhancing the allocative efficiency of the financial markets, while at the same time, ensuring macroeconomic stability (RBI, 1993; Rangarajan, 1997). The operating procedure of monetary policy, in terms of targets and instruments, saw substantial changes in response to the challenges of financial liberalisation. The deregulation of interest rates, for instance, sharpened the Reserve Bank’s dilemma of funding both the Government and the commercial sector at a reasonable cost, without stoking inflationary pressures. Besides, following the opening up of the external sector, the need to maintain orderly conditions in the foreign exchange market, at times, required higher interest rates, while the pursuit of the growth objective required a softer interest rate regime. Finally, the shifts in the channels of transmission of monetary policy, as a result of freeing of financial prices, necessitated monetary operations in terms of both the price and quantum of liquidity.
Final Objectives: Price Stability and Growth
5.13 The twin objectives of monetary policy remained the pursuit of price stability and ensuring the availability of sufficient credit for the productive sectors of the economy during the 1990s. However, the relative emphasis varied from year-to-year depending on the evolving price-output situation.
5.14 The intellectual edifice of the reigning monetary policy framework the world over was essentially developed in the backdrop of high inflation of the 1960s and 1970s. In view of the ensuing anti-inflationary stance, an inflation-targeting framework with price stability as the single objective of monetary policy, gained increasing currency worldwide during the 1990s (Box V.1). In the Indian context as well, the Advisory Group on Transparency in Monetary and Financial Policies (Chairman: M. Narasimham) (RBI, 2000c) recommended that it would be best to veer towards prescribing to the Reserve Bank a single medium-term inflation objective. There are, however, several constraints in pursuing a single price stability objective (RBI, 2000a; Jalan 2002b):
Box V.1 With the money demand function becoming increasingly unstable in a number of advanced economies, the monetary policy framework began to shift away from a monetary targeting regime towards using short-term interest rates as an intermediate target of monetary policy. The framework underwent a further significant transformation as central banks, starting with New Zealand in 1989, began to target the final objective of monetary policy, viz., the inflation rate, rather than focussing on a monetary aggregate or an interest rate as an intermediate target. During the 1990s, a number of emerging economies also adopted inflation targeting (IT), especially as a device to stress their commitment to lowering the inflation rate. At present, 18 countries follow IT (IMF, 2003). Full-fledged IT is based on five pillars (an institutional commitment to price stability, absence of other nominal anchors, absence of fiscal dominance, policy instrument independence, and policy transparency and credibility) although some countries adopted IT without satisfying all of them (Mishkin and Schmidt-Hebbel, 2001). For instance, Chile and Israel adopted IT even as they had another nominal target (exchange rate) while the Bank of England adopted IT before attaining instrument independence. Most of the central banks which have adopted IT have chosen an inflation target in the vicinity of two per cent. Almost all central banks are known to follow a ‘flexible’ rather than ‘strict’ IT, i.e., deviations of output from the potential are also taken into account. This is clearly reflected in the fact that the horizon over which deviations from the inflation target are tolerated is usually close to eight quarters. Too short a horizon and a very narrow range of the inflation target can induce undesirable output fluctuations. Alternatively, to overcome the deviations on account of supply shocks, a number of IT central banks have put escape clauses or focus on core measures of inflation, the latter in turn leading to problems of understanding by the public. This is indicated in the preference of the emerging market IT central banks for the headline consumer price index (CPI) although the industrial countries appear to have a preference for core inflation. In the latter case, a few countries (Australia and New Zealand) have also switched towards headline CPI, with their statistical agencies redefining the headline CPI by excluding, inter alia, interest charges. IT does not purport to be an iron-clad policy rule; rather, it represents constrained discretion. The advantages of IT, vis-à-vis the monetary aggregate- or exchange rate-anchored framework, with its focus on low and stable inflation, are: its support to macroeconomic stability and growth; an enhancement in the transparency and accountability of the monetary as well as fiscal policies; a scope to the central bank for short-run stabilisation; and, an impetus for institutional and structural reforms in the economy. Available evidence suggests that IT matters as it enabled the former high-inflation countries to achieve low inflation coupled with low volatility though not necessarily below that achieved by some non-IT industrial economies. Sceptics have, however, pointed out that the 1990s did not face severe adverse shocks and as such, IT remains an untested framework. Moreover, many countries succeeded in reducing their inflation rates without a change in the monetary policy framework (Friedman and Knutter, 1996). The evidence, thus, does not support the superiority of IT over that of the US Federal Reserve policy or that of the monetary targeting regime of the Bundesbank (before the formation of the European Central Bank) and the Swiss National Bank (until recently). This is attributed to the fact that the monetary targeting banks like the Bundesbank had also an inflation objective in mind and were quite willing to miss their monetary targets as and when they conflicted with their inflation objectives. |
The recurrence of supply shocks limits the role of monetary policy in the inflation outcome. Structural factors and supply shocks from within and abroad make inflation in India depend on monetary as well as non-monetary factors.
The persistence of fiscal dominance implies that the debt management function gets inextricably linked with the monetary management function while steering liquidity conditions.
The absence of fully integrated financial markets suggests that the interest rate transmission channel of policy is rather weak and yet to evolve fully. In particular, the lags in the pass-through from the policy rate to bank lending rates constrain the adoption of inflation targeting.
The high frequency data requirements including those on a fully dependable inflation rate for targeting purposes are yet to be met.
5.15 The present co-existence of low inflation and low growth in large parts of the world economy presents a fresh challenge to the conduct of monetary policy. At one end of the spectrum lies the 'continuity view' which essentially treats the present economic slowdown as an unusual supply shock within the context of the present anti-inflationary monetary stance. At the other end is the 'new environment view' which enjoins central banks a much greater preemptive role in smoothening output fluctuations, especially as financial imbalances are increasingly able to create disturbances in the real economy without necessarily showing up in overt inflation rate at the initial stages (Borio, English and Filardo, 2003). Notwithstanding the lively academic debate over the policy rules regarding the inflation-growth trade-off, the more standard central banking practice often lies in the 'middle ground' of constrained discretion (Bernanke, 2003). This is built on the parsimonious principle that within its strong commitment to price stability, monetary policy should strive to limit cyclical swings in effective demand. This broadly corresponds to the Reserve Bank’s current monetary policy stance of ensuring easy liquidity conditions to facilitate the revival of industrial growth while maintaining a constant vigil over the price level. Given properly designed monetary policy rules, the key socially important objectives of price stability and growth, thus, tend to be mutually reinforcing rather than competing goals.
Intermediate Target: From Monetary Targeting to a Multiple Indicator Approach
5.16 The Reserve Bank broadly followed a monetary targeting rule with feedback from the mid-1980sonwards till around 1997-98. Broad money (M3) served as the intermediate target with the CRR as the operating instrument. The intellectual underpinnings of monetary targeting, laid by the Chakravarty Committee (RBI, 1985), were based on a stable relationship between money, output and prices. In the Indian case, money demand was generally found to be stable, providing reasonable predictions of average changes in prices over a medium-term horizon of 4-5 years, though not necessarily on a year-to-year basis (Rangarajan and Arif, 1990; Jadhav 1994). Financial innovations that were supposed to have imparted instability to money demand in some industrial economies were not considered relevant for the Indian economy at that stage (Arif 1996; Joshi and Saggar, 1995).1 Finally, the money stock target was believed to be relatively well-understood by the public at large. All these factors provided a rationale for monetary targeting in the Indian context (Rangarajan 1988; 1997).
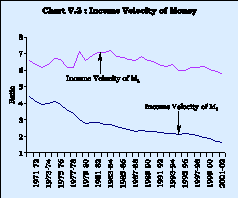
5.17 The behaviour of the velocity of money provides a gauge of the underlying monetary dynamics of the economy. Theoretically, while the increased monetisation of the economy is expected to lower the velocity, financial innovations are expected to raise it (Bordo and Jonung, 1987). The M3 income velocity, for instance, declined from an average of 3.7 during the 1970s to 2.6 during the 1980s, reflecting the role of institutional factors, such as, financial deepening in the economy. The declining trend persisted throughout the 1990s, albeit at a slower pace (Chart V.3). Although deregulation and diversification of the Indian financial system tended to arrest the decline in velocity of money, this was simultaneously counterbalanced by the fact that most of the ensuing transactions continue to be conducted through the banking channel and occasional flights to safety of bank deposits, especially in the late 1990s (Jadhav, 1994; RBI, 2000b, 2002d).
5.18 The growing complexities of monetary management, by the latter half of the 1990s, in the context of the ongoing liberalisation of financial markets and the opening up of the economy, required that the process of policy formulation should be based on a wider range of inputs rather than being predicated on a single M3 aggregate. The Working Group on Money Supply (RBI, 1998b) reported that real GDP and broad money balances continued to be co-integrated, reflective of a long-run equilibrium relationship. At the same time, unidirectional short-term deviations from the long-run equilibrium path suggested that monetary policy exclusively based on the demand function for money could lack precision. The Reserve Bank’s Monetary and Credit Policy for the first half of 1998-99 pointed out that, although most studies in India have shown that money demand functions have so far been fairly stable, '…the financial innovations that have recently emerged in the economy provide some evidence that the dominant effect on the demand for money in near future need not necessarily be real income, as in the past. Interest rates too seem to exercise some influence on the decisions to hold money' (RBI, 1998a).
5.19 The Reserve Bank, accordingly, formally switched to a multiple indicator approach effective 1998-99. A host of macroeconomic variables, including interest rates or rates of return in different markets (money, capital and government securities markets) along with such data as on currency, credit extended by banks and financial institutions, fiscal position, trade, capital flows, inflation rate, exchange rate, refinancing and transactions in foreign exchange available on high frequency, are now juxtaposed with output trends for drawing policy perspectives. In this framework, although use of M3 as an intermediate target has the exclusive been de-emphasised, it remains an important indicator of the monetary policy stance. The multiple indicator approach allows a correct assessment of potential inflationary pressures when alternative indicators of inflation emit differing signals as for instance in the second half of the 1990s (RBI, 1999a).
5.20 The increasing complexities of macroeconomic management are gradually leading a number of central banks, as in the Indian case, to abandon the traditional monetary strategy which was woven around individual nominal anchors - money, interest rates or exchange rates - closely related to the ultimate objectives of price stability and growth. The management information system of monetary policy formulation now spans a large set of macroeconomic variables rather than a single monetary or interest rate target in the case of most central banks (Table 5.1).
Table 5.1: Multiple Indicators of Monetary Policy | |||
Country | Objective | Target | Key Policy Indicators |
1 | 2 | 3 | |
European | Price stability | Money and a broadly based assessment of | |
Central Bank | the outlook for price developments and the | ||
risks to price stability using financial and | |||
other economic indicators. | |||
Japan | Price stability | Current account | Overall economic and financial indicators, |
balances | such as, wholesale prices, corporate | ||
service prices and money stock. | |||
Mexico | Price Stability | Money, credit, interest fates, exchange | |
rate, inflation expectations, employment | |||
contracts, producer prices and balance of | |||
payments. | |||
South Africa | Price stability | Money, credit, international interest rates, | |
yield curve, nominal and real salaries and | |||
wages, employment, nominal unit labour | |||
costs, output gap,money market conditions, | |||
asset prices, balance of payments, terms of | |||
trade, exchange rate and public sector | |||
Borrowing requirement. | |||
USA | Maximum | Federal funds rate | A number of indicators of current and |
employment, | prospective economic developments. | ||
stable prices and | |||
Moderate long- | |||
term interest | |||
rates | |||
Source: Websites of respective central banks. | |||
Changes in the Operating Procedure of Monetary Policy
5.21 The operating procedure of monetary policy changed dramatically in the 1990s driven by three inter-related factors:
Need for a market-oriented policy mix of open market operations and interest rate signals consistent with the process of price discovery.
Need to sterilise capital flows following the opening up of the economy.
Need for swift policy reactions to maintain orderly conditions in the financial markets.
5.22 The Reserve Bank introduced open market (including repo) operations in an attempt to move from direct to indirect instruments of monetary control in 1992-93 (Table 5.2; RBI, 1993). Following the recommendations of the Report of the Committee on Banking Sector Reforms (Chairman: M. Narasimham) (Government of India, 1998), an Interim Liquidity Adjustment Facility (ILAF) was introduced initially in April 1999. This later transited into a full-fledged LAF, put in place on June 5, 2000. The Reserve Bank is now able to adjust market liquidity on a daily basis through repo/reverse repo auctions of varying frequencies under the LAF. While interest rates in the repo/reverse repo auctions usually emerge out of the bids, the Reserve Bank occasionally conducts fixed interest rate auctions to send signals to the markets. In the process, the interest rates emerging out of the repo and reverse repo auctions provide a corridor for the call money and other short-term interest rates. The LAF is gradually emerging as the principal operating instrument of monetary policy, replacing all other windows of liquidity support to the market.
Table 5.2 : Monetary Policy Instruments | ||||||
Instrument/Decade | 1950s | 1960s | 1970s | 1980s | 1990s | |
1 | 2 | 3 | 4 | 5 | ||
Cash Reserve Ratio | v | v | v | |||
Standing Facilities | v | v | v | v | Sector- specific refinance | |
de - emphasised. | ||||||
Credit Control | v | v | v | v | Phased out. | |
Open Market Operations | v | v | v | Reactivated in1992-93 | ||
Bank Rate | v | v | v | Reactivated in1997-98 | ||
Note : | v denotes an active use of the instrument. | |||||
5.23 Another major step towards a market-based monetary policy was the reactivation of the Bank Rate in April 1997 (Chart V.4 and Table 5.3). The interest rate on the majority of the accommodation extended by the Reserve Bank was initially linked to the Bank Rate. As the price of primary money is now increasingly market-determined, essentially at rates emerging out of the LAF auctions, the Bank Rate is now used, more or less, as a signalling instrument of monetary policy in line with the evolving macroeconomic and liquidity conditions.
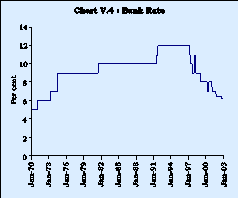
Table 5.3 : Use of the Bank Rate | ||||||
(Per cent) | ||||||
Bank Rate | Inflation Rate | |||||
Decade | Number of times | Range | Average | Range | ||
changed | ||||||
1 | 2 | 3 | 4 | |||
1950s | 2 | 3.0-4.0 | 1.7 | (-)12.5-14.0 | ||
1960s | 4 | 4.0-6.0 | 6.4 | (-)1.2-13.9 | ||
1970s | 3 | 5.0-9.0 | 9.0 | (-)1.1-25.2 | ||
1980s | 1 | 9.0-10.0 | 8.0 | 4.4-18.2 | ||
1990s | 10 | 8.0-12.0 | 8.1 | 3.3-13.7 | ||
April 2000 –Feb 2003 | 6 | 6.25-8.0 | 4.6 | 3.0-7.2 | ||
5.24 The Reserve Bank now manages liquidity through open market (including repo) operations, reinforced by direct interest rate signals through changes in the policy rates such as the Bank Rate/ repo rates, besides the traditional tools of changes in reserve requirements and standing facilities. While CRR continues to be used as a monetary policy instrument, the adverse impact of impounding lendable resources has been minimised by bringing it down to 4.75 per cent of NDTL, in line with the medium-term goal of reducing it to the statutory minimum of 3.0 per cent. Furthermore, the banks are now remunerated for CRR balances (above the statutory minimum) at the Bank Rate.
5.25 The liquidity management framework is in line with the cross-country experience which suggests that the operating procedures of monetary policy during the 1990s are gradually coalescing into a process of estimating market liquidity, before initiating policy action through a mix of open market operations and interest rate signals. This helps steer monetary conditions to a trajectory consistent with the macroeconomic objectives (Borio, 1997; Schaechter, 2002).
The Reserve Bank Balance Sheet in the 1990s
5.26 In view of the increasing market orientation of monetary policy, the Reserve Bank undertook several steps to impart greater transparency and resilience to its balance sheet. First, the foreign currency assets are valued every Friday in respect of exchange rate changes and gains/losses from valuation are not booked in the profit and loss account. The revaluation is parked in the capital account to meet fluctuations in foreign exchange markets. The Reserve Bank marks its investment portfolio, both domestic and foreign securities, to the market on a monthly basis and on the balance sheet date (i.e., June 30) in terms of the prudential policy of valuing investments at the lower of book or market value. Second, the Reserve Bank has set an indicative target of building up the Contingency Reserve to 12.0 per cent of assets by June 2005 (11.7 per cent as at end-June 2002) and the Asset Development Reserve to 1.0 per cent of assets (within the 12.0 per cent indicative target) to meet unforeseen contingencies in line with best international practices (Stella, 2002). Third, the ratio of net foreign assets to currency (123 per cent as on March 14, 2003), an indicator of external vulnerability, by far exceeds the 70 per cent benchmark set by the Committee on Capital Account Convertibility (Chairman: S.S.Tarapore). Finally, apart from releasing a weekly statement of its assets and liabilities and annual audited accounts in fulfilment of the statutory obligations, the Reserve Bank releases data on i) commercial banks’ cumulative balances with it and money market operations, on a daily basis, ii) foreign exchange reserves, on a weekly basis and iii) outstanding forward liabilities, on a monthly basis. The Advisory Group on Transparency in Monetary and Financial Policies (RBI, 2000c) opined that the Reserve Bank’s accounting disclosure norms are in consonance with the best international practices.
Monetary-Fiscal Co-ordination
5.27 The monetary policy reforms during the 1990s hinged on easing the fiscal constraint. The first important step was introduction of an auction system for the Centra l Government’s market borrowings in June 1992. This enabled an increasing proportion of the fiscal deficit to be financed by borrowings at market-related rates of interest. This, in turn, enabled the Reserve Bank to scale down the SLR to the targeted statutory minimum level of 25.0 per cent by October 1997 (see Chart V.1).
5.28 The second major step was the historic accord between the Government and the Reserve Bank in September 1994, eliminating the automatic monetisation of the Centre’s fiscal deficit by gradually phasing out ad hocs by April 1997. A system of ways and means advances (WMA) to the Central Government, subject to mutually agreed limits at market-related rates, was put in place instead to meet mismatches in cash flows. Since the Reserve Bank reserves the right to trigger floatation of fresh government loans as and when the actual utilisation crosses 75 per cent of the limit, the WMA does not acquire the cumulative character of ad hocs. This enables the Reserve Bank to accommodate the Government at its discretion and helps impose a market discipline on fiscal activism.
5.29 Finally, the Reserve Bank instituted a conscious strategy of providing primary support to the Government through private placements and devolvements in government securities auctions when liquidity is tight. Such acquisitions are later offloaded through secondary market operations [such as open market (including repo) operations] depending upon capital flows, credit growth and requirements of monetary management. This allows the Reserve Bank to contain volatility in the market and facilitate the smooth progression of market borrowings. The net effect on the Government budget and the balance sheet of the Reserve Bank remains unchanged because of the increased transfer of profits from the Reserve Bank to the Government and consequently the beneficial effects are being realised with virtually no extra costs to the Government (Reddy, 2000).
Interest Rate Deregulation
5.30 The deregulation of interest rates was central to the new market-oriented monetary strategy in terms of rejuvenating the price discovery process, on the one hand and in terms of developing an interest rate channel of monetary transmission on the other. The process of interest rate liberalisation began in the mid-1980s. The initial initiative to introduce a degree of flexibility by allowing banks to set interest rates for maturities between 15 days and up to one year subject to a ceiling of 8.0 per cent, effective April 1985, however, had to be withdrawn in the face of an ensuing price war by end-May 1985.
5.31 The dismantling of the administered interest rate structure gathered momentum during the 1990s. The first step in this direction was taken in September 1991 with the discontinuation of sector-specific and programme-specific prescriptions excepting for a few areas like agriculture and small industries, the Differential Rate of Interest (DRI) scheme and export credit. Loans above Rs.2 lakh were freed from various prescriptions, subject to the minimum lending rate prescribed by the Reserve Bank. By linking the concessionality in interest rates to the size of the loan, the new structure ensured that the basic societal concerns were taken care of while significantly reducing the multiplicity and complexity of the rate structure.
5.32 The process of deregulation was carried forward with the withdrawal of the minimum lending rate in October 1994, thereby providing banks full freedom to determine lending rates for loans above Rs.2 lakh. Banks were only required to announce their prime lending rates (PLR); subsequently, in October 1996, in view of the high spreads over the PLR and to impart a degree of transparency, banks were advised to announce the maximum spread over the PLR. Banks were later permitted to operate different PLRs for different maturities and lend at sub-PLR to creditworthy borrowers.
5.33 Deposit rate deregulation was more gradual as it was considered prudent to free deposit interest rates at the end of the process of deregulation and at a time when inflation was under control. The process began in April 1992 by replacing the existing maturity-wise prescription by a single ceiling rate, which was subsequently varied in line with the modifications in the minimum lending rate and the evolving macro-economic developments followed by complete deregulation in October 1997 (Table 5.4). At present, the only domestic deposit rate that continues to be prescribed is the savings deposit rate (fixed at 3.5 per cent, effective March 2003). The deposit rates in respect of non-resident rupee deposits were also deregulated on broadly similar lines while that on foreign currency deposits are subject to a ceiling rate linked to LIBOR.
Table 5.4 : Interest Rates on | |
Domestic Term Deposits : Deregulation | |
Month | Measure |
April 1992 | The existing maturity-wise prescription replaced by a single ceiling rate |
of 13 per cent for all deposits above 46 days of maturity. | |
November 1994 | The ceiling rate brought down to 10.0 per cent. |
April 1995 | The ceiling rate raised to 12.0 per cent |
October 1995 | Deposits of maturity of over two years exempted from the ceiling. |
July 1996 | Deposits of maturity of over one year exempted from the ceiling. |
April 1997 | The ceiling rate for deposits of ‘30 days up to one year’ linked to the |
Bank Rate less200 basis points. | |
October 1997 | Deposit rates fully deregulated by removing the linkage to the Bank Rate. |
April 1998 | Banks allowed to offer differential rates of interest depending upon the |
size of the deposit. | |
5.34 While bank term deposit rates stand deregulated, small savings continue to be administered, thereby imparting a degree of rigidity to the interest rate structure. The Expert Committee to Review the System of Administered Interest Rates and Other Related Issues (Chairman: Y.V. Reddy) (RBI, 2001c) recommended that interest rates on small savings and other administered instruments of various maturities needed to be benchmarked to the secondary market yields of government securities of corresponding maturities. In pursuance of these recommendations, the Union Budget 2002-03 announced that interest rates on small savings would be henceforth linked to the average annual yield of government securities in the secondary market for the corresponding maturities, with an annual adjustment on an automatic and non-discretionary basis. This measure is expected to enhance the flexibility of the interest rate structure in the economy. Interest rates on small savings instruments were cut by 50 basis points in the Union Budget, 2002-03 and by another 100 basis points in the Union Budget, 2003-04.
Deregulation of Credit
5.35 The reforms in credit regulation, which began in the mid-1980s, intensified in the 1990s with a shift in focus from micro-regulation towards macro-management of credit. These included a scaling down of pre-emptions in the form of statutory stipulations to expand the pool of lendable resources, rationalisation of priority sector requirements, phasing out of directed credit programmes and relaxation of balance sheet restrictions to improve the credit delivery system.
5.36 The cash credit system in the Indian banking system, by allowing the borrowers to utilise credit limits at their discretion, passed the onus of cash management to banks. In order to introduce an element of credit discipline for borrowers under the cash credit system and better control over the credit flow, the Reserve Bank gradually introduced a 'loan system' effective April 1995 in which fund management reverted to the borrower. This, along with the phasing out of on-tap Treasury Bills, provided a fillip to the development of a market for short-term funds.
5.37 The liberalisation of investment norms in the 1990s, following initial relaxations in the mid-1980s, gradually transformed banks into active players in the emerging financial markets. This took two forms. First, the ambit of eligible investments was enlarged to cover commercial paper, units of mutual funds and the secondary equity market. Second, the limit on investments in the capital market was gradually raised to five per cent of the previous year’s deposit mobilisation in October 1993. The sub-ceiling in respect of corporate equity was withdrawn in May 1994. Effective May 2001, the total exposure of a bank to stock markets with sub-ceilings for total advances to all stock brokers and market makers as well as individual stock broking entities and their associate/ interconnected companies was limited to 5.0 per cent of the total advances (including CPs) as on March 31 of the previous year. At the same time, the scope of the ceiling was enlarged by gradually excluding several categories of investments.
Payment and Settlement Reforms
5.38 The Reserve Bank, like many central banks in emerging market economies, initiated payment reforms to enhance the operational efficiency of the financial system. This essentially involves a three-pronged strategy of i) developing an institutional framework to oversee the payments systems, ii) operationalising information technology applications and iii) instituting satellite- and terrestrial-based communications infrastructure. The Reserve Bank is also introducing a full-fledged real time gross settlement system, in line with international best practices, which would minimise risks arising out of domino effects of individual defaults.
III. MONETARY POLICY REFORMS: AN ASSESSMENT
5.39 Against the backdrop of these monetary policy changes, this Section begins with some stylised facts followed by an assessment of the reforms in terms of the macroeconomic objectives of price stability and credit availability. In addition, the changes in the liquidity management framework are evaluated in terms of the management of capital flows and maintaining orderly conditions in the money market.
5.40 The 1990s opened with a severe balance of payments crisis and a high rate of inflation, reflecting the growing internal imbalances of the 1980s. The Reserve Bank responded swiftly with monetary and credit measures aimed at import compression and demand containment. Following the success of the initial stabilisation efforts and the liberalisation of the external sector, the management of capital flows posed a fresh challenge to monetary management. The Reserve Bank absorbed surplus capital flows in its balance sheet in order to maintain the export competitiveness of the economy and at the same time, attempted to sterilise the monetary impact (RBI, 1994).
5.41 With the downturn in economic activity beginning 1997-98, the revival of growth emerged as an overriding concern of monetary policy, although with a constant vigil on the inflation front. Besides, in contrast to sustained capital flows in the earlier years, the latter half of the 1990s saw periodic episodes, albeit short-lived, of capital outflows, leading to bouts of volatility in the financial markets, necessitating swift policy action to restore orderly conditions.
Inflation Record
5.42 The pursuit of price stability was central to the process of financial sector reforms initiated in the 1990s. Although inflation is not targeted per se, monetary policy was formulated with the stated objective of curbing inflationary expectations. The projected inflation rate was gradually scaled down to 4-5 per cent in the last few years from around 7-9 per cent indicated in the early part of the 1990s.
5.43 The Indian inflation record over the past five decades can be considered satisfactory as compared with many developing economies. This can be attributed to relatively appropriate monetary management coupled with measures to contain the adverse effects of supply shocks through adequate buffer stocks of foodgrains and other sensitive commodities (Singh, 1982). The guiding principle in respect to inflation management continues to be that, in the medium to long-run, the increase in prices is largely sustained by monetary expansion. In the short-run, however, inflation could be affected by non-monetary, essentially supply-side, factors (RBI, 2001a).
Trends in Wholesale Prices
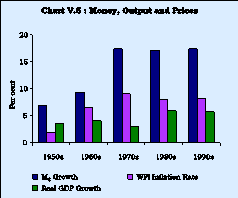
5.44 The inflation rate (measured by variations in annual average wholesale price index, WPI) over the past five decades averaged 6.6 per cent per annum. However, decade-wise, the inflation rate accelerated steadily from an annual average of 1.7 per cent during the 1950s to 6.4 per cent during the 1960s and further to 9.0 per cent in the 1970s before easing marginally to 8.0 per cent in the 1980s (Chart V.5). On the other hand, the volatility in the inflation rate, as measured by the coefficient of variation, which was fairly high in the 1950s (4.4 per cent), moved in a narrow range of 0.4–1.0 per cent in the subsequent decades. The pickup in inflation from 1970s onwards coincided with a sharp rise in M 3growth, partly reflecting fiscal dominance. At the same time, the inflationary dynamics also reflected supply shocks, such as the two wars (1962 and 1965), hike in crude oil prices (1973-74 and 1979-80) and crop failures. Demand pressures, emanating partly from the widening fiscal imbalances, sustained the inflation in the 1980s.
5.45 The first half of the 1990s saw a sharp increase in inflation. The decade began with double-digit inflation attributable to the large-scale monetisation of fiscal deficits. This was intensified by hikes in procurement prices as well as supply-demand imbalances in essential commodities like pulses, oilseeds and edible oils. The severe foreign exchange shortage that the country faced at the time constrained the ability of the authorities to augment the supply position through imports and also contributed to inflationary pressures. Increases in fuel prices and other administered items also fed higher inflation. The inflationary pressures continued during 1993-94 and 1994-95 in the wake of unprecedented capital inflows and the consequent higher monetary expansion. The focus of monetary policy, therefore, shifted to the moderation of money supply with the objective of containing inflation to create an enabling environment for the process of structural adjustment.
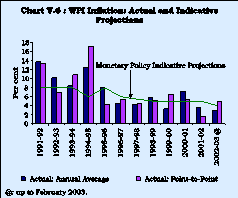
5.46 The second half of the 1990s was marked by a significant turnaround in the inflation outcome. The inflation rate declined from an average of 11.0 per cent during 1990-95 to 5.3 per cent during the second half of the 1990s. In the first three years of the current decade (2000-01 to 2002-03), the inflation rate continued to be benign, despite a continued volatility in the international crude prices. The actual inflation rates since the second half of the 1990s were, thus, broadly in line with the indicative projections set out in monetary policy statements (Chart V.6).
5.47 The low inflation rate since the second half of the 1990s, despite an unchanged GFD/GDP ratio, sustained external capital flows and continued double-digit fuel price increases can be attributed to a number of factors (Table 5.5):
Table 5.5 : Inflation and Its Major Determinants
(Annual averages in per cent) | ||||||
Variable/Period | 1980- | 1985- | 1990- | 1995- | 1998- | |
1 | 2 | 3 | 4 | 5 | ||
WPI Inflation Rate | 9.3 | 6.7 | 11.0 | 5.3 | 5.0 | |
CPI Inflation Rate | 10.1 | 8.0 | 10.5 | 7.3 | 6.2 | |
Food Articles Inflation | 10.7 | 6.4 | 11.9 | 6.6 | 6.0 | |
Increase in Procurement Prices: | ||||||
Paddy | 7.6 | 6.3 | 13.0 | 6.6 | 6.3 | |
Wheat | 6.1 | 6.6 | 11.2 | 8.3 | 5.0 | |
Fuel Inflation | 12.5 | 6.0 | 12.8 | 11.3 | 12.5 | |
M3 Growth @ | 16.8 | 17.6 | 17.5 | 16.8 | 17.2 | |
(16.3) | (16.2) | |||||
GFD/GDP @@ | 5.9 | 7.7 | 6.3 | 5.6 | 5.9 | |
(5.5) | (5.1) | (5.6) | ||||
GDP Growth | 5.6 | 6.0 | 5.0 | 6.1 | 5.6 | |
Increase in Unit Value Index of Imports | 5.6 | 8.0 | 7.6 | 6.3 | 5.2 | |
@ : | Figures in brackets are growth rates excluding RIBs/IMDs.2 | |||||
@@ : | Figures in brackets exclude States’ share in small savings. | |||||
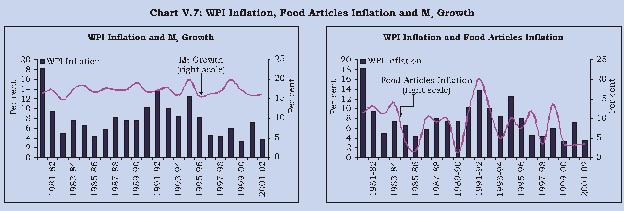
There was a perceptible deceleration in the M3 growth rate from 17.5 per cent during 1990-95 to 16.2 per cent during 1998-2002 even as the real GDP growth accelerated from 5.0 per cent to 5.6 per cent over the same period (Chart V.7). This was facilitated by the increased flexibility in monetary policy due to the improved monetary-fiscal interface. At the same time, as noted below, monetary policy was able to sterilise the capital flows. This also enabled a deceleration in broad money growth consistent with the objective of containment of inflationary pressures.
Food articles inflation halved during the period from 11.9 per cent to 6.0 per cent, led by a deceleration in procurement price increases (Chart V.7).
External pressure on domestic prices (as measured by unit value index of imports in rupees) was lower than that in the first half of the 1990s.
Negative output gap (as measured by the HP filter method) prevailed in the recent three years (2000-01 to 2002-03) implying that actual output trailed potential output.
While increased capital flows and higher foreign exchange reserves have inflationary implications through monetary expansion, at the same time, they provide a greater flexibility in supply management in the face of supply shocks.
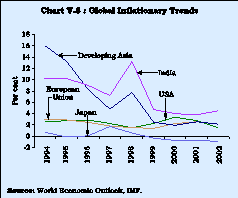
5.48 The role of these factors in containing inflationary pressures also emerges from a formal econometric analysis. A common approach to modelling inflation is the short-run Phillips curve relating inflation to lagged inflation (assuming adaptive expectations) and output gap augmented by supply shocks (Gordon, 1998; Stock and Watson, 1999; RBI, 2002a). The estimated coefficients have the expected signs and are statistically significant.3 The estimates suggest that aggregate demand at one per cent above trend output level raises the inflation rate by around 40 basis points. Similarly, nominal money at one per cent above its trend level increases the inflation rate by around 86 basis points. In brief, the decline in the inflation rate since the second half of the 1990s reflected a confluence of factors. These included better monetary management facilitated by improved fiscal-monetary co-ordination, lower pressures from administered procurement price hikes, weakness of domestic aggregate demand, presence of excess capacities, ample food stocks and foreign exchange reserves. The decline in inflation was also synchronous with the current phase of disinflation characterising the global business cycle (Chart V.8).
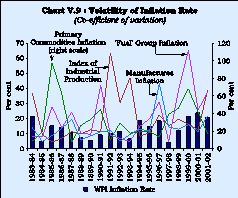
5.49 The objective of the monetary policy all over the world is not only to maintain low inflation but also a stable rate, i.e., to minimise its deviations from the target. Moreover, a consensus is emerging that monetary policy should also minimise deviations of output from its potential level although it is recognised that a trade-off exists between the variability of inflation and the variability of output. Increased credibility in the form of inflation expectations anchored on the inflation target can reduce the variability of both inflation and output (Svensson, 2003). Assessed against these goals, although the inflation rate witnessed a noticeable deceleration in the second half of the 1990s in India, the volatility of the inflation rate did not see a concomitant decline (Chart V.9). This could be attributed to an increased volatility in fuel group inflation - the coefficient of variation of the fuel group increased from 16 per cent in the first half of the 1990s to 32 per cent in the period 1995-2002 -reflecting volatile international crude oil prices.4 The primary articles inflation too was more volatile during the second half of the 1990s (Chart V.9). The persistence of volatility could hamper anchoring expectations at a low level. As regards output, its variability – as measured from growth in the index of industrial production, in the absence of high-frequency data on overall GDP growth – was lower in the post-1995 period as compared with the first half of the 1990s. The lower variability of output, however, has to be seen in the context of the industrial production getting caught in a low growth rate trajectory.
Consumer Inflation
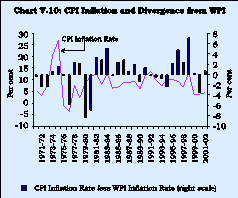
5.50 Retail inflation, as measured by variations in the consumer price index for industrial workers (CPI-IW or CPI for brevity), by and large, moved in tandem with WPI inflation. Although CPI inflation, at 7.7 per cent, remained lower than WPI inflation during the 1970s, it turned out higher at 9.0 per cent during the 1980s and 9.5 per cent during the 1990s. The divergence between the two inflation indicators widened during the second half of the 1990s with the CPI inflation at 8.6 per cent, almost three percentage points higher (Chart V.10).
5.51 The wedge between the two inflation indicators largely reflects the larger weight of the food group in the CPI and a differential movement in the inflation rates of various sub-groups. For instance, in the WPI index, the ‘primary articles’ inflation at 6.5 per cent was higher than that of 4.1 per cent recorded by ‘manufactures’ in the second half of the 1990s (Chart V.11). In addition, the divergence between the CPI and WPI could also reflect the movements in the prices of services, which are included in the CPI. The divergence between goods and services inflation appears to be a widespread phenomenon (Table 5.6). The higher services inflation can be attributed to faster productivity growth in manufacturing (King, 2002).
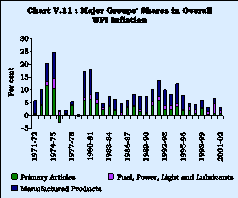
Table 5.6 : Goods and Services Inflation in Major Economies | ||||
(Excess of Services over Goods Inflation) | ||||
Period/Country | UK | US | Euro area | Japan |
1 | 2 | 3 | 4 | |
1990-97 | 1.6 | 1.6 | 1.6 | 1.3 |
1990-2002 | 2.3 | 1.8 | 1.3 | 1.3 |
Source : King (2002). | ||||
Inflation Expectations and Core Inflation
5.52 In view of the divergence between the CPI and the WPI inflation, there may be a need for monitoring a host of other indicators to obtain a more accurate assessment of expectations of inflation for a forward-looking monetary policy. Pethe and Samanta (2001), for example, developed a ‘composite leading indicator’ for inflation and found manufacturing output, money stock, exchange rate, bank credit and raw material prices as possessing predictive capability for future inflation in India. Food prices, exchange rate and real money gap lead inflation expectations by one month each while yield spreads and fuel prices lead by two and six months, respectively (RBI, 2001b).
5.53 As the inflation rate in the short-run is often dominated by supply shocks emanating from the agricultural sector or fuel prices, the year-to-year headline (i.e., WPI) inflation rate does not necessarily reflect the underlying inflationary pressures in the economy. This brought forth the construction of ‘core’ measures of inflation to eliminate the noise or transient components of the headline, especially in terms of supply shocks. Two alternatives, exclusion-based and limited influence estimators (trimmed mean), have been examined for India (Samanta, 1999; Mohanty, Rath and Ramaiah, 2000). However, the loss of information content in the construction of core inflation and the relatively greater public acceptability of the headline inflation make the core measures useful only as indicators of the underlying inflationary process rather than as policy targets. Furthermore, in developing countries, a measure of core inflation excluding food items – which can account for more than half of the weight in the index – may not be very meaningful (Jalan, 2002b).
Issues in Price Stability
5.54 There is, by now, an emerging consensus in the literature, that while money is typically neutral in the long run, monetary policy generates short-run real effects in view of price rigidities and expectation errors. Recent research in the context of developed countries suggests that monetary policy should aim at an inflation rate of 1.5-4.0 per cent (Akerlof et al, 1996; Krugman, 1996). In view of the possibility of a inflation-growth trade-off, a growth-maximising threshold inflation rate has been placed at around 1-3 per cent for industrialised countries and 7-11 per cent for developing countries (Sarel, 1996; Khan and Senhadji, 2001).
5.55 The Chakravarty Committee’s observation of four per cent inflation rate as being acceptable can be regarded as the first illustrative benchmark on threshold inflation for the Indian economy. A number of studies have subsequently placed threshold inflation in the range of 4-7 per cent (Rangarajan, 1997; Kannan and Joshi, 1998; Vasudevan, Bhoi and Dhal, 1998; Samantaraya and Prasad, 2001; and RBI, 2002a). The estimate of threshold inflation has, however, a shifting perspective. With structural changes in the economy, prolonged price stability at the global level as well as in India and the credible anchoring of inflationary expectations at a lower level, the threshold inflation could also move downwards.
5.56 Finally, while there is little disagreement regarding the long-run benefits of low and stable inflation, a number of studies stress the possible short-run costs in the process of reducing inflation. This is discussed in the received literature in terms of the so-called sacrifice ratio, which is defined as cumulative output losses that an economy needs to endure to reduce average inflation, on a permanent basis, by one percentage point. The concept of sacrifice ratio focuses on reducing inflation on a permanent basis by the monetary authority rather than on a temporary reduction in inflation (say, due to beneficial supply shocks like lower food prices). Furthermore, the sacrifice ratio measures cumulative output losses, which could be spread over a number of periods. The output losses refer to deviations of actual output from its trend. Over time, as inflation expectations stabilise at a lower level, actual output gradually converges to its trend path. The sacrifice ratio measures such output losses in the process of disinflation. One study puts the estimate of the sacrifice ratio at around two for India (Kapur and Patra, 2000). It is necessary to emphasise here that for a proper interpretation of the sacrifice ratio, it is crucial to analyse the dynamics and sources of inflation. In particular, a clear distinction must be made between low inflation driven by benign supply factors and a tight monetary policy.
Analytics of Bank Credit
5.57 Besides the pursuit of price stability, the Reserve Bank attempts to ensure that sufficient credit is available at a reasonable cost to the productive sectors of the economy to fund growth. At the heart of the reforms of the monetary fiscal interface lay the objective of enhancing lendable funds with the banking system by limiting the Government’s draft of resources by fiat . Following the deregulation of interest rates, the price of credit also emerged as a focus of monetary policy attention. With the slowdown in economic activity in the second half of the 1990s, the Reserve Bank attempted to put in place a softer interest rate regime with a view to facilitating the revival of credit demand.
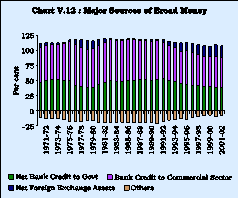
5.58 The 1990s witnessed a weakening of the simultaneity of the processes of money and credit creation underscoring the need for focusing greater attention on credit aggregates.5 The share of foreign assets of the banking sector in M3 increased substantially, concomitantly reducing the share of domestic credit to 89.6 per cent during 2001-02 from 115.7 per cent during 1989-90 (Chart V.12). The proportion of the net bank credit to Government in domestic credit, however, increased to 45 per cent during the 1990s as compared with 43 per cent during the 1980s and the 1970s reflecting the persistence of the fiscal constraint. The proportion of incremental net bank credit to the Government in the Centre’s gross fiscal deficit increased from 51.7 per cent during the first half of the 1990s to 59.5 per cent during the latter half of the 1990s.
Impact of Changes in the Monetary-Fiscal Interface
5.59 The composition of net bank credit to the Government changed substantially as the declining net Reserve Bank support to the Centre was mirrored by the increasing investment by the banking system in government securities. Scheduled commercial banks’ investments in government securities, as a result, increased from 25.3 per cent of deposits as at end-March 1990 to 37.3 per cent by end-March 2002 even as the SLR was brought down to 25 per cent (Chart V.13).
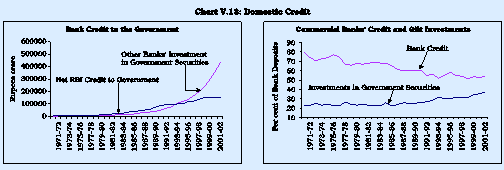
5.60 The banks’ continued preference for government securities, almost 12 percentage points above the statutory requirements, can be attributed to a variety of factors:
Increased resources emanating from strong capital flows on the supply side.
Weak credit off-take on the demand side in line with the industrial slowdown as well as due to a downward rigidity in the bank lending rates. Reported shortening of the working capital cycle of manufacturing companies may be yet another reason for weak credit demand (Business Standard, 2003).
Heightened risk aversion on the part of the banks on account of prudential guidelines requiring risk-weight for credit to the commercial sector vis-à-vis the credit risk-free government paper.
Growing gross market borrowings of the Government in view of the large fiscal gap.
5.61 This near exclusive recourse to gilts to park investible surpluses even by strong commercial banks reflects dissipation of banking knowledge capital with regard to credit appraisals and runs a danger of the link between liquidity, credit, money and economic activity being severed in the long-run (Mohan, 2002).
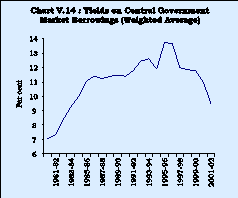
5.62 A critical concern regarding the changes in the monetary-fiscal co-ordination is the impact on the cost of public debt. Although the interest rates on market borrowings hardened with the switch to market-determined rates in the initial years of the reform process, they declined sharply from 1997-98 onwards and are now at their lowest in the last two decades. The weighted average interest rate on government borrowings followed an inverted U-curve, initially increasing from around 11.5 per cent in the late 1980s to 13.75 per cent by 1995-96 and thereafter declining to 9.44 per cent during 2001-02 (Chart V.14). The reduction in the yields continued during 2002-03, with the yield on the 10-year paper declining from 7.36 per cent at end-March 2002 to around 6.5 per cent by mid-March 2003.
5.63 An important issue in the context of the monetary-fiscal interface, drawing upon the unpleasant monetarist arithmetic (UMA) proposition, is the non-inflationary central bank financing of the gross fiscal deficit of the Centre and an optimal degree of monetisation. The decline in the ratio of net Reserve Bank credit to the Centre to GDP to 0.7 per cent during the 1990s led to a view that the degree of monetisation has been on the lower side (Rakshit, 2000; Venkitaraman 1995). On the other hand, it has been argued that while bond financing may increase real interest rates vis-a-vis money financing, it is still beneficial as it reduces inflation and, hence, enhances long-run welfare (Moorthy et al, 2000). There exists an optimal degree of monetisation for a given level of government deficit (Prasad and Khundrakpam, 2000). For the Union Budget, 2001-02, the optimal degree was about 40 per cent of the budgeted fiscal deficit (Rao, 2000). The optimal degree of monetisation has been falling in the second half of the 1990s, and the decline in monetisation may be reflecting structural changes and policy efforts to widen the financial markets to enable the absorption of government debt (RBI, 2002a). The degree of monetisation of fiscal deficits is also constrained by the fluctuations in capital flows (RBI, 2002d).
5.64 It was possible to ease the fiscal constraint on monetary management in recent years on account of a strong demand for government paper essentially emanating from a mix of strong capital flows and relatively poor credit offtake. This also implies that the burden of direct financing of the fiscal deficit could easily revert to the Reserve Bank in case of a reversal in the liquidity conditions, especially as banks’ investments in Government securities are already far in excess of their statutory SLR requirements. The overall task of monetary management, therefore, becomes more and more difficult when a large and growing borrowing programme puts pressure on the absorptive capacity of the market (RBI, 2001b).
Credit to Commercial Sector
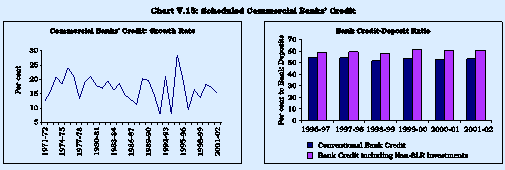
5.65 Scheduled commercial banks’ credit to the commercial sector increased by 15.9 per cent during the 1990s as compared with 16.8 per cent during the 1980s. The conventional bank credit-deposit ratio declined from 60.4 per cent as at end-March 1991 to 53.4 per cent as at end-March 2002, in line with the long-term trends. Unlike in the 1970s and 1980s, when commercial credit was squeezed by statutory stipulations, the decline in the 1990s partly reflected the growing securitisation of bank portfolios, following the easing of investment norms. It is, therefore, important to expand the concept of bank credit to include other investments in money and equity markets (RBI, 1998b). Once the data on such non-SLR sources are taken into account, the share of credit as a proportion of bank deposits increased from 58.7 per cent as at end-March 1997 to 60.8 per cent as at end-March 2002, substantially higher than that of 53.4 per cent in terms of the conventional definition (Table 5.7 and Chart V.15).
Table 5.7 : Scheduled Commercial Banks’ | ||||
Non-SLR Investments | ||||
(Rs. crore) | ||||
Variable | As at end-March | |||
1997 | 2002 | |||
1 | 2 | |||
1 | Commercial Paper | 685 | 8,497 | |
2. | Shares issued by | 1,252 | 5,914 | |
2.1 PSUs | 348 | 1,586 | ||
2.2 Private Corporate Sector | 904 | 4,327 | ||
3. | Bonds/debentures issued by | 16,631 | 66,589 | |
3.1 PSUs | 14,277 | 39,520 | ||
3.2 Private Corporate Sector | 2,354 | 27,069 | ||
Total Non-SLR (1+2+3) | 18,568 | 81,000 | ||
Memo: | ||||
Conventional Bank Credit | 2,78,401 | 5,89,723 | ||
Bank Credit Including non-SLR | 2,96,969 | 6,70,723 | ||
Investments | (58.7) | (60.8) | ||
Note : | Figures in brackets indicate the ratio of bank credit(including non-SLR investments) to aggregate deposits. | |||
Bank Credit: Is It a Leading Indicator of Activity?
5.66 Bank credit plays a critical role in the Indian economy as the principal source of external financing for the corporate sector. Although directed credit programmes have been phased out, the Reserve Bank continues to monitor credit as a driver of growth. With the growing market orientation of the Indian economy, business cycle analysis is emerging as an important input for the formulation of a forward-looking monetary policy. In this context, recent research to find robust leading indicators of activity has identified non-food credit as a potential lead indicator, notwithstanding episodic aberrations from this underlying relationship (Chart V.16).
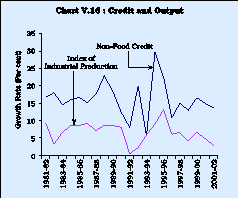
5.67 Industrial production and non-food credit are cointegrated with Granger causality tests indicating a bi-directional causation.6 A component-wise analysis of industrial output shows that the bi-directional causation is relatively weaker between non-food credit and intermediate goods (RBI, 2001b). While the bidirectional causation reduces the usefulness of the leading indicator property of non-food credit, the leading property finds support from a comparative analysis of the impulse responses which indicate that the impact of a shock to IIP on non-food credit is smaller vis-à-vis that of a shock to non-food credit on IIP. This dynamic and complex relationship between non-food credit and industrial activity, therefore, needs to be further investigated before ascribing leading, coincident or lagging information content to non-food credit in relation to real activity (Mall, 1999; Mohanty, Singh and Jain, 2000; RBI, 2001b, 2002a, 2002b).
5.68 In brief, non-food credit and industrial production show co-movement. Cointegration analysis suggests that a 10 per cent increase in industrial production leads to an almost 15 per cent increase in real non-food credit.7 In view of this, the recent preference of banks to invest in government securities could be attributed, partly to the weak industrial demand. Reflecting the role of credit in the economy and its sensitivity to interest rate signals, the provision of adequate liquidity to meet credit growth and support investment demand in the economy continues to be a core policy objective of the Reserve Bank. Given the information content, credit is one of the variables in the present multiple indicator approach to monetary policy in India.
Liquidity Management
5.69 The Reserve Bank had to operate simultaneously in the money and foreign exchange markets to counterbalance domestic and external sources of monetisation following the opening up of the economy in the 1990s. Besides, the gradual evolution of inter-linked financial markets, while necessary for economic efficiency, posed challenges of rapid contagion to monetary management. With the growing market orientation, the role of the Reserve Bank moved away from exercising control and discretion towards becoming an active player in the market itself through proactive, timely and effective interventions to modulate liquidity conditions and signal the policy stance in regard to interest rates (Kanagasabapathy, 2001). The empirical evidence suggests that the Reserve Bank was able to stabilise liquidity conditions in the market for bank reserves by systematically reacting to changes in bank liquidity, autonomous of policy action, with discretionary operations (RBI, 2001b; Sen Gupta et al, 2000).
5.70 An episodic analysis brings out the increasing effectiveness of liquidity management. During the initial episodes of financial market volatility, the monetary policy responses induced a very sharp reaction in the bank reserves as the Reserve Bank did not possess commensurate instruments to fine-tune market liquidity on a day-to-day basis. The Reserve Bank had to first create a sufficiently large gap through a concerted hike in CRR and a cut in refinance limits, which was later funded by higher cost reverse repos and refinance drawals. For instance, monetary tightening in the wake of excess demand conditions in the foreign exchange market in end-October 1995 drove DFHI’s call lending rates to a peak of 85 per cent as on November 3, 1995, which was stabilised by liquidity injection via reverse repos. Similarly, DFHI’s call rates zoomed to a peak of 110 per cent on January 24, 1998 following the monetary measures of January 16, 1998, in the wake of the South-Asian crisis and came down thereafter as banks began to draw on the refinance window to fund their liquidity gap (Table 5.8).
Table 5.8 : Changes in the Liquidity Management | |||||
Framework: An Episodic Analysis | |||||
Monetary | October | January | August | ||
Policy Action | 1995 | 1998 | 2000 | ||
1 | 2 | 3 | |||
Demand side measures | |||||
CRR | ? | ? | |||
Bank Rate | Not active | ? | ? | ||
Repo/reverse repo rate | ? | ? | |||
(in discrete | (Frequently) | ||||
stages) | |||||
Repos (net) | ? | ||||
(Bids accepted depending | |||||
on liquidity onditions) | |||||
Reverse repos (net) | ? | ? | - do - | ||
Cost of import finance | ? | ? | ? | ||
Supply side measures | |||||
Foreign currency sales | ? | ? | @ | ? | |
Cost of export credit | ? | ? | ? | ||
Note : | ? indicates an increase in the corresponding policy variables. | ||||
@ Since September 1997. | |||||
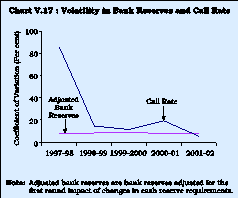
5.71 With the operationalisation of the LAF by June 2000, the Reserve Bank was able to supplement the standard monetary measures by active liquidity management through a mix of primary support to Government and changes in both the price and quantum of primary liquidity on a daily basis. Reflective of the greater degree of manoeuvrability in discretionary operations, call rates remained, by and large, range-bound around the LAF 1-day repo rate during the episode of financial market volatility in August-September 2000. As a result, the volatility in the short-term money market rates was lower in the recent period (Chart V.17).
Management of Capital Flows
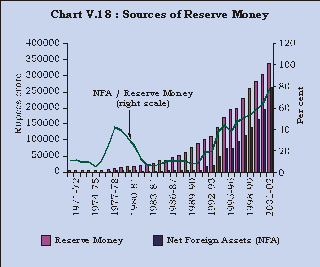
5.72 The changes in the operating procedure of monetary policy and the growing openness of the economy during the 1990s impacted both on the size and composition of reserve money. A distinct feature during the 1990s was the growing influence of capital inflows on the conduct of monetary policy. With capital flows in excess of the current account deficit, the Reserve Bank absorbed the surplus foreign exchange in the market. As a result, the share of net foreign assets (NFA) in reserve money increased to 78.1 per cent as at end-March 2002 from 7.8 per cent as at end-March 1990, with implications for monetary expansion (Chart V.18). As on March 14, 2003, the ratio stood at 97.0 per cent. Nonetheless, the Reserve Bank could effectively sterilise such capital flows and keep reserve money under control by trading the surpluses on the external account with the fiscal deficit and thus, neutralise its own balance sheet. In this context, it may be noted that for a part of the accretion to NFA in the form of aid receipts, revaluation and income from foreign assets, there is no monetary impact and hence no need for sterilisation. For instance, such flows amounted to 64 per cent of incremental NFA during 1998-2002; in 2002-03 (up to March 14, 2003), the ratio was 31 per cent.
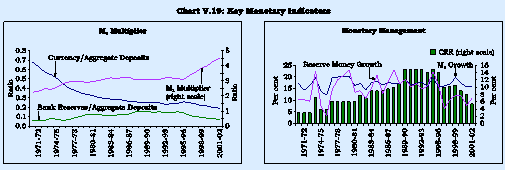
5.73 The share of the net Reserve Bank credit to the Centre in reserve money declined over the 1990s. More recently, the net Reserve Bank credit to the Centre has recorded a decline even in absolute terms in the face of a sustained surge in capital flows. In the process, the monetisation of the Centre’s fiscal deficit (as a proportion to GDP) declined from 2.1 per cent during the 1980s to 0.7 per cent during the 1990s. As a result, reserve money expansion could be contained to 14.3 per cent during the 1990s as compared with 16.5 per cent during the 1980s.
5.74 An additional factor behind the lower reserve money growth was a sustained cut in cash reserve requirements since the late 1990s, in line with the stated policy objective to reduce it to the statutory three per cent. As a result, the M3 multiplier jumped to 4.4 as at end-March 2002 from 3.1 as at end-March 1995 thus amplifying the monetary impact of primary liquidity in the recent years. The overall M3 growth rate, therefore, worked out to 17.3 per cent per annum during the 1990s, close to 17.2 per cent in the previous decade although reserve money expansion decelerated during the 1990s (Chart V.19).
5.75 A stylised fact of the 1990s, as noted earlier, was a sharp rise in net foreign assets of the Reserve Bank with a corresponding decline in net domestic assets reflecting sterilisation by the Reserve Bank. An issue that needs to be examined is whether it was the reduction in net domestic assets that caused subsequent capital inflows or whether they offset the previous capital inflows. For most of the countries, both lines of causality could be at play depending upon the degree of capital account liberalisation and sensitivity of foreign flows to interest rate differentials. An examination of the offset coefficient – the response of net foreign assets to net domestic assets - for a sample of six countries studied by Schadler et al (1993) showed that all, except Thailand, had scope for effective sterilisation. For India, Granger causality tests indicate a uni-directional causality from changes in NFA to net domestic assets (NDA).8 Moreover, the sterilisation coefficient - the response of change in NDA to that in NFA - was (–) 0.84 during April 1994-December 2002, i.e., an increase of Rs. 100 in NFA attracted a policy response of sterilisation that drained away NDA worth Rs. 84 from the system9. In other words, the results do not suggest that capital inflows were in response to domestic monetary conditions. This indicates scope for effective sterilisation. In theory, surges in capital flows should ease domestic money market conditions and lower interest rates. Given the estimated sterilisation coefficient for India, the authorities were largely able to steer interest rates consistent with domestic macroeconomic conditions.
5.76 The sustained increase in the ratio of net foreign assets to net domestic assets during the 1990s reflected both the scale effect (the CRR cuts) and the substitution effect (sterilisation) of the changes in the monetary policy framework and structural changes. This has two implications. First, the reduction in NDA limits the Reserve Bank’s ability to sterilise capital flows in future. Second, this also impacts the Reserve Bank’s income in terms of the differential between domestic and international interest rates.
Interest Rate Pass-through
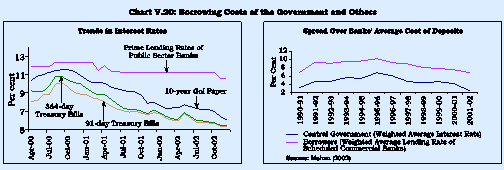
5.77 While the Reserve Bank is increasingly able to ensure orderly conditions in the financial markets, the critical issue in determining the effectiveness of the signals emanating from the changes in the policy rate is the degree of ‘pass-through’, i.e., the speed and the magnitude of the response of the market interest rate spectrum to the monetary policy signals (RBI, 2002d). Between March 1998 and February 2003, the Bank Rate and the repo rate were cut by 425 basis points and 250 basis points, respectively. In addition, the CRR was reduced by 550 basis points over the same period. The repo rate was cut by a further 50 basis points in March 2003. The easing of the monetary policy stance was mirrored in a general softening of interest rates in the money markets (with call rates declining by almost 325 basis points) and in the government securities markets (with the yield on 10-year government securities declining by almost six percentage points). However, the prime lending rates of major banks remained sticky. This suggests a low level of pass-through of the changes in the policy rates on to the lending rates, thereby blunting the efficacy of the monetary policy. Over a medium-term horizon, the spreads of lending rates of commercial banks over their average costs of deposits reveal a marginal narrowing down since 1996-97. The spreads, however, still continue to be fairly large. The spread of the Central Government’s market borrowings over the banks’ average cost narrowed from 5.2 per cent during 1990-96 to 4.4 per cent during 1996-2002 while that of other borrowers declined from 9.2 per cent to 8.1 per cent over the same period (Chart V.20).
5.78 This relative downward inflexibility in the commercial bank interest rate structure can be attributed to a number of structural factors in the Indian banking system (RBI, 2002e):
Average cost of deposits for major banks continues to be relatively high (6.25 to 7.25 per cent). This could be attributed partly, in turn, to the returns on alternative savings instruments in the country. Despite reductions in the administered interest rates on small savings and provident funds in the recent period, these instruments still yield higher returns than bank deposits, which are made even more attractive by tax benefits. This, therefore, constrains the banks’ ability to reduce deposit rates. Furthermore, in the absence of a well-developed pension market, bank deposits continue to be the dominant source of income for senior citizens. This hinders sharp cuts in interest rates on bank deposits. Moreover, although the inflation rate has declined in the recent period, its year-to-year variability, as noted earlier, remains high. This might have prevented a commensurate decline in inflation expectations and thus, keeping nominal rates high.
Substantial portion of bank deposits remains in the form of long-term deposits at fixed interest rates. This limits the flexibility available to banks in reducing their lending rates in the short-run without adversely affecting their return on assets.
Relatively high overhang of non-performing assets (NPAs) further pushes up the average cost of funds for banks, particularly public sector banks.
Non-interest operating expenses of banks work out to 2.5 to 3.0 per cent of total assets, putting pressure on the required spread over the cost of funds.
In view of legal constraints and procedural bottlenecks in recovery of dues by banks, the risk-premium tends to be higher resulting in a wider spread between deposit rates and lending rates.
In the context of the current cyclical slowdown of the economy, especially the industrial sector, the probability of defaults and late payments by borrowers increases; this could lead to an increase in risk premium and hence a stickiness in the PLR.
The large borrowing programme of the Government, over and above SLR requirements, gives an upward bias to the interest rate structure.
5.79 In order to overcome these rigidities and to impart more flexibility to the interest rate structure, the Reserve Bank has recently initiated a number of measures. Banks were encouraged to introduce a flexible interest rate system option for all new deposits and urged to review and announce the maximum spreads over PLR. To have a greater degree of transparency with regard to actual interest rates for depositors as well as borrowers, banks were asked to provide information on deposit rates for various maturities, the effective annualised return to the depositors and maximum and minimum interest rates charged to their borrowers. These factors are expected to increase the degree of pass-through over time. For instance, the median range of interest rates at which at least 60 per cent of business is contracted narrowed from 12.75-14.00 per cent as at end-June 2002 to 12.00-14.00 per cent as at end-September 2002.
5.80 It would be useful to compare the Indian experience of pass-through with that of a developed economy. In contrast to the Indian experience, the pass-through in the USA is almost instantaneous and complete. For instance, between January 2001 and January 2003, the Fed Funds rate declined by 474 basis points; the prime rate over the same period declined by 480 basis points (Chart V.21). The correlation coefficient between the two rates was, therefore, nearly unity. The spread of the prime rate over the Fed Funds rate was almost constant at 300 basis points in the US as compared with almost 600 basis points over the Bank Rate in India at present. The pass-through is relatively lower on to the long-rates. For instance, the correlation coefficient of 10-year Treasury yields with the Fed Funds rate was 0.70 over the period January 1997 to January 2003. On the other hand, in India, although long-term yields fell in line with the monetary easing, the prime lending rate did not show much co-movement. This brings into sharp focus the importance of a faster pass-through for an effective monetary policy.
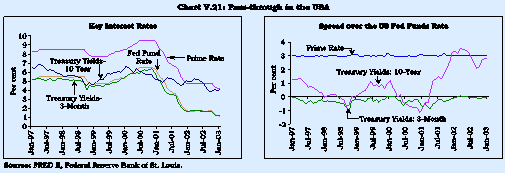
Real Interest Rates
5.81 The low interest pass-through, in the context of a decline in the inflation rate, is reflected in a hardening of the real interest rate (Table 5.9). The impact differed across various sectors in view of divergent trends in the pass-through as well as the relevant inflation rates. In particular, the appropriate real interest rate for borrowers increased significantly as manufacturing inflation declined more sharply than the headline inflation while the nominal rates remained relatively sluggish. The sluggishness of nominal rates, in turn, emanated from a combination of downward rigidity of deposit rates, low pass-through and risk-aversion by banks in view of the prudential norms. In the case of the Central Government, the increase in real interest rates could be attributed partly to the fact that the administered interest rate mechanism continued during the first few years of the 1990s. For the Central Government, real interest rates, in fact, fell sharply in 2002-03 on the back of a substantial decline in nominal yields. The key issue, in terms of the growth objective, is the impact of the structure of real interest rates, especially as the interest cost as a proportion of sales of corporates is much higher as compared with many emerging market economies (Mohan, 2002).
Table 5.9 : Real Interest Rates | ||||
(Per cent) | ||||
Category/Period | 1990-91 to | 1996-97 to | ||
1995-96 | 2001-02 | |||
1 | 2 | |||
Depositors | -0.3 | 1.9 | ||
Central Government | 1.8 | 6.8 | ||
Borrowers | 6.5 | 12.5 | ||
Note : | Real interest rates calculated as the weighted average lending rate of scheduled commercial banks less manufacturing inflation, for borrowers; weighted average interest rate on Central Government securities less WPI inflation, for the Central Government; and average cost of time deposits less CPI-IW inflation for depositors. | |||
Source : | Mohan (2002). | |||
5.82 For India, econometric evidence suggests that a 100 basis point rise in real interest rates depresses the real GDP and hence widens the output gap (actual less trend output) by six basis points in the short-run and almost 60 basis points in the long-run.10 Available empirical evidence also suggests that the response of output to monetary policy signals is asymmetric, with a tight monetary policy being more effective than an easy monetary policy. For the US, the short-run response of output to increases in the Fed Funds rate is estimated to be more than twice of the response to decreases in the Fed Funds rate (Piger, 2003).
IV. TRANSMISSION CHANNELS OF MONETARY POLICY
5.83 In India, as in many other developing countries, credit markets were typically segmented till the 1980s, with interest rate controls and directed lending stipulations. During the 1990s, financial sector liberalisation brought out greater linkages among the various segments of the financial markets paving the way for the emergence of an interest rate channel of monetary policy transmission. With the increasing opening of the economy, the exchange rate channel of the monetary policy transmission is also expected to reinforce the traditional interest rate channel (Box V.2). The transmission channels of monetary policy are, therefore, expected to have undergone changes, consequent upon the liberalisation of financial markets. Against the backdrop of these changes, this Section makes an attempt to examine the transmission process in the 1990s vis-a-vis the 1980s.
Box V.2 The transmission mechanism describes as to how monetary policy action affects output and inflation, which are the final objectives of monetary policy. Monetary policy action transmits to the ultimate objectives through two broad sets of channels, financial prices (e.g., interest rates, exchange rates, yields, asset prices, equity prices) and financial quantities (money supply, credit aggregates, supply of government bonds, foreign denominated assets). An important financial market prices channel is the interest rate channel. A contractionary monetary policy leads to a hike in nominal short-term interest rate, which given nominal rigidities (sticky nominal wages and prices) and the expectations model of the term structure, translates into higher real interest rates. The resultant increase in the price of currently purchased goods as compared with goods purchased in the future reduces investment and consumption and contracts output. As wages/goods prices adjust over time, real GDP returns to the potential level and the real interest rate and the real exchange rate also return to their fundamental levels. The efficacy of the interest rate channel would, however, be reduced in case banks ration credit. But even though interest rates charged by banks do not change, the amount of lending by banks would increase if the supply curve of funds shifts to the right; to that extent, even with unchanged interest rates, the economic activity will have a positive effect. The transmission of monetary policy through interest rates is augmented by changes in the exchange rates and balance sheet effects. Higher interest rates, for example, induce an appreciation of domestic currency which leads to lower prices of imports (the direct effect) and a reduction in net exports and, hence, in aggregate demand and output leading to a decline in prices (the indirect effect). Changes in interest rates impact on the balance sheet in a variety of ways. Higher interest outgoes, for example, lead to lower cash flows of firms and personal disposable incomes of households and, hence, reduce investment and consumption demand. Similarly, higher interest rates reduce asset prices and erode the net worth of borrowers restricting their ability to borrow. On the other hand, the monetarist view of transmission argues that interest rate is just one of the many relative prices in the transmission mechanism. It is not just a single short-term interest rate but actual and anticipated prices on a variety of domestic and foreign assets that also undergo a change. Monetary impulses are, therefore, transmitted through relative price changes and changes in real money balances. The particular pattern of relative price changes varies from cycle to cycle and from country to country. Empirical Evidence Recent empirical research has confirmed the early findings of Friedman and Schwartz (1963) that monetary policy actions are followed by movements in real output that may last for two years or more. Furthermore, real effects of the monetary shocks are not only substantial but also long-lived (though not permanent) with the effects remaining up to three years (Romer and Romer, 1989). The recent vector auto regression (VAR) literature confirms these results: monetary policy shocks have a persistent effect on output while inflation displays an inertial response. Output, consumption and investment display a hump-shaped response, with the peak effect occurring about 1.5 years after a monetary policy shock. Inflation also displays a hump-shaped response, with the peak response after about two years (Christiano et al, 2001). The results for the euro area broadly conform to this pattern. The peak effect of output occurs after one year while inflation hardly moves during the first year. The delayed response of prices relative to that of output suggests that studying the transmission of policy to spending and output is a logical step, even if the aim of monetary policy is defined primarily or exclusively in prices (Angeloni et al, 2002). Although the persistence of inflation has declined per se in the US and the UK, the lags in the impact of systematic monetary policy action on inflation still persist despite numerous changes in monetary policy arrangements and advances in information processing as well as financial market sophistication (Batini and Nelson, 2002). A distinguishing feature of the euro area and the Japanese transmission vis-à-vis that of the US is that real output changes in the former are brought about largely by the response of investment in contrast to the predominant role of consumption in the latter. A comparative analysis of the alternative channels for the euro area, as a whole, suggests that the interest rate appears to be a very prominent, although not the dominant, channel of transmission; for some individual countries though, it turns out to be the dominant channel. For the euro area, the exchange rate channel is the dominant channel of transmission in the first two years, both in terms of its impact on output and on prices; from the third year onwards, the user cost of capital channel is dominant in terms of impact on output. The ‘credit channel’ is found to operate significantly in Germany and Italy but irrelevant in some other euro area countries. Thus, the role of the banks is found to be smaller than expected. On the other hand, evidence for Japan indicates a strong role for the ‘credit channel’ since borrowers have been unable to substitute bank borrowing with alternative sources and consequently, business investment is especially sensitive to monetary shocks (Morsink and Bayoumi, 2001). Moreover, a money shock is found to have a large impact on economic activity even when the interest rate is included in the VAR; this suggests that the interest rate channel does not fully account for the transmission mechanism in Japan. The overall evidence, therefore, strongly suggests that short-term policy nominal interest rates do have real effects in the short- and medium-term. The monetary policy transmission channels in emerging market economies have also been affected by the process of financial liberalisation (Kamin et al,1998). The withdrawal of state controls facilitated the emergence of an interest rate channel, although the credit channel remains important, especially in the context of occasional financial fragility. At the same time, the opening up of the economy together with the withdrawal of balance sheet restrictions enhanced the role of asset prices, in particular the exchange rate, in the monetary transmission process. |
Monetary Transmission in India
5.84 For India, the empirical evidence showed that changes in money supply lead to changes both in output and prices, although the price effects of an increase in money supply are stronger than the output effects (Rangarajan and Arif 1990; Jadhav 1994). The Working Group on Money Supply (RBI, 1998b) found a strong unidirectional causation running from real output to real money. Besides, the output response operating through the interest rate channel turned out to be stronger and more persistent than that of the credit channel. A comparison of monetary impulses transmitted through interest rate effects and through liquidity effects for the period 1961-2000 indicates that the interest rate channel has emerged as a significant factor for explaining the variation in real activity in the 1990s as compared with its negligible impact in the 1980s (Dhal, 2000). The liquidity effect, although significant, diminished in terms of magnitude. This subsection examines afresh the transmission mechanism in India in the recent years (April 1994 to December 2002) vis-à-vis the 1980s (April 1981 to June 1990). The analysis is undertaken in terms of a vector autoregression (VAR) framework (Box V.3).
Box V.3 In the literature, the two competing approaches in assessing the transmission mechanism are structural modeling approach and vector autoregression (VAR) model. The structural model approach sometimes suffers from the imposition of identifying restrictions and arbitrariness regarding the variables that are assumed to be exogenous (or pre-determined) (Sims, 1980). Moreover, because most of the macroeconomic variables are non-stationary in nature, estimating a structural model may provide spurious estimates and misleading forecasts. As an alternative, formulating unrestricted VAR models, treating all variables as endogenous in order to avoid infecting the model with spurious or false identifying restrictions is preferred. Although the VAR methodology has also been subjected to criticism, the method remains popular since it offers a straightforward solution to the simultaneity problem and appears to yield a reasonable characterisation of the economy’s response to monetary policy (Kuttner and Mosser, 2002).11 Unlike a macroeconomic model, the VAR facilitates quantifying the impact of policy shocks. This method also makes the lag structure and dominance of the channels transparent. In view of lack of a consensus on the workings of the transmission, the preference for VAR methodology in the recent literature, therefore, comes from the minimum restrictions that it places on as to how the monetary shocks affect the economy. For the purposes of the present empirical exercise, the VAR model includes five endogenous variables in the following order: Index of Industrial Production (LIIP), Wholesale Price Index (LWPI), Non-Food Credit (LNFC), Broad Money (LM3) and Call Money Rate (CALL). The ordering of output and prices before the monetary policy variables appears reasonable in view of the well-accepted lags of the monetary policy actions on to output and prices; given the use of the monthly data, the ordering is all the more appropriate. Since the operating framework of the monetary policy has undergone changes during the period, as discussed earlier in this Chapter, from a monetary targeting approach to a multiple indicator approach in 1998, both money and interest rate are included in the VAR to capture the monetary policy shock. To assess the changes in the transmission that could have occurred in the aftermath of the structural reforms initiated in the economy during the 1990s, the VAR is estimated for the pre-reform (1981:04 to 1990:06) and the post-reform (1994:04 to 2002:12) periods separately. The intervening period 1990:07 to 1994:03 was marked by external payments imbalances, subsequent macroeconomic stabilisation and structural reforms and was, therefore, excluded from the analysis. In addition to the endogenous variables, the primary articles price index is included as an exogenous variable in the VAR, given the dominance of supply shocks as well as the procurement pricing approach in respect of agricultural commodities. The Bombay Stock Exchange index (LBSES) and the exchange rate of the rupee vis-à-vis the US dollar (LEXCH) are also included as exogenous variables in the VAR as a control for the growing globalisation and financial integration across various segments of the market. Finally, appropriate dummies have been used to control for abrupt oil price changes, spikes in the call money market (induced by the foreign exchange market volatility) and the impact of mergers. The prefix ‘L’ denotes the logarithms of the variables. All the five variables in the VAR are found to be non-stationary. The ADF test statistics (with lag selection criteria based on the AIC criterion) were: 1.6 for LIIP (12 lags), 2.4 for LWPI (8 lags), 1.8 for LNFC (12 lags), 1.6 for LM3 (12 lags) and 0.5 for CALL (13 lags) for the period 1981:04 to 1990:06. For the second period (1994:06-2002:12), the corresponding t-statistics were: 2.3 (10 lags), 1.5 (6 lags), 0.8 (3 lags), 0.4 (1 lag) and 2.5 (3 lags). The 1%, 5% and 10% critical values are 3.5, 2.9 and 2.6, respectively. Given the non-stationarity of the variables, the option of differencing of series produces no gain in asymptotic efficiency and throws away information. However, if the variables are cointegrated, the VAR can be estimated in levels. Since the cointegration tests using the Johansen-Jusselius framework reveal that there exists at least one co-integrating vector for each of the sample periods, the VAR is, therefore, run in levels rather than the differenced form. |
5.85 The results of the empirical exercise in terms of impulse responses for both the periods are generally on the expected lines. A positive shock to broad money (i.e. , expansion) over time leads to higher output while a positive shock to the call money rate ( i.e., increase) produces the reverse effect. The effect is, however, more pronounced and sharp during the first period as compared with the post-1994 period. In recent years, shocks to the call money rate take almost one year to have the expected negative effect on output, reflecting the monetary policy lags. A positive shock to non-food credit ( i.e., expansion) has the expected positive effect on output and the response during the post-1994 period is quicker. This indicates the role of a narrow credit channel in the Indian context and hence supports the continuingpolicy stress on the provision of adequate liquidity to meet genuine credit requirements to support investment demand. As regards prices, a positive broad money shock results in higher prices in the post-1994 period. However, in the pre-reform period, the outcome is a counter-intuitive fall in prices and, at no horizon does the effect become positive, perhaps reflecting the greater degree of administered pricing in the 1980s. The monetary policy tightening through a positive shock to the interest rate has the expected stabilising influence on prices in both the periods. The shocks to non-food credit have a positive impact on the prices, with the effect being weaker in the post-1994 period, supporting the policy rationale of meeting credit requirements with continuous vigil on prices (Chart V.22).
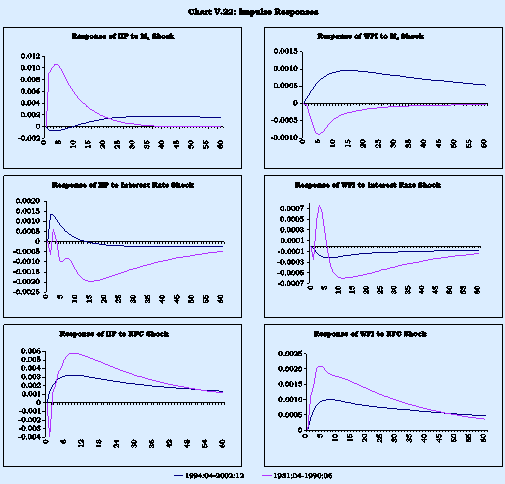
5.86 An assessment of the impulse responses brings out certain differences in the lag structure of monetary transmission. The peak effect of the money shock on output occurs after 35 months in the post-1994 period (compared to three months in the 1980s) while the peak effect of the interest rate shock takes 32 months (14 months in the 1980s). On the other hand, the peak effect of non-food credit at nine months in the post-1994 period was the same as during the 1980s. As regards the lags on to prices, the maximum effect in the case of the interest rate shock occurs after six months in the post-1994 period (11 months in the 1980s); for non-food credit shocks, the peak effect takes place after seven months (four months).
5.87 Apart from impulse responses, the VAR analysis is also undertaken through variance decomposition. This measures the percentage of forecast error variance in one variable that can be attributed to innovations in a particular variable under consideration. The proportion of output variance due to innovation to broad money, at 60 months horizon, shows a perceptible decline from 19.7 per cent during the 1980s to 2.8 per cent during the second period. Similarly, the proportion of output variance due to interest rate shocks declined from 2.0 per cent to 0.2 per cent over the same period (Table 5.10). These results indicate that the role of monetary policy shocks in output variability has been substantially lower during the post-reform period. In other words, the monetary policy has been stabilising over the period in the sense that the endogenous response of monetary policy to macroeconomic developments has been to minimise fluctuations in economic activity. This result is consistent with the evidence emerging from the studies in the context of the US (Boivin and Giannoni, 2002). Another viewpoint, however, interprets the decline in the role of the monetary policy shocks as suggestive of the view that the monetary policy does not matter and the improved outcome is attributed to better inventory management (Kahn et al, 2002). As regards the role of monetary policy shocks on prices, the evidence is inconclusive. While the contribution of the interest rate shocks to the variability of prices declined from 4.1 per cent during the 1980s to 0.7 per cent during the second period, that of the money supply shocks increased from 2.1 per cent to 23.6 per cent over the same period.
Table 5.10: Variance Decomposition Analysis | ||||||||||||
(Per cent) | ||||||||||||
Proportion of Forecast Error Variance in | ||||||||||||
Innovations to | Out | Prices | Out | Prices | Out | Prices | Out | Prices | Out | Prices | Out | Prices |
put | put | put | put | put | put | |||||||
1 | 2 | 3 | 4 | 5 | 6 | 7 | 8 | 9 | 10 | 11 | 12 | |
Period: 1981:04-1990:06 | Period: 1994:04-2002:12 | |||||||||||
12 months | 24 months | 60 months | 12 months | 24 months | 60 months | |||||||
Non-food Credit | 7.3 | 22.5 | 13.2 | 30.3 | 17.0 | 34.8 | 2.8 | 11.6 | 4.9 | 16.8 | 7.4 | 20.9 |
Broad Money | 21.4 | 2.5 | 20.9 | 2.3 | 19.7 | 2.1 | 0.1 | 7.6 | 0.5 | 15.8 | 2.8 | 23.6 |
Interest Rate | 0.4 | 1.8 | 1.3 | 3.2 | 2.0 | 4.1 | 0.2 | 0.5 | 0.2 | 0.6 | 0.2 | 0.7 |
5.88 In brief, the preliminary evidence from the above VAR analysis throws some interesting results. The impulse responses are more consistent with a priori theory during the post-reform period vis-à-vis the 1980s. The variance decomposition analysis shows that the role of monetary policy shocks has declined, at least, in regard to output fluctuations. At the same time, it is important to note that given the evolutionary, rather than discrete and abrupt, nature of financial and other structural reforms in the economy, their impact on the monetary transmission will become evident only over relatively long periods of time. The scope of the formal tests of structural change is rather limited and the assessment of the change in the transmission mechanism, as in this exercise, is confined to economic, rather than statistical, significance of the changes (Kuttner and Moser, 2002). Finally, the above empirical exercise is constrained by the use of industrial production as a measure of output in the absence of a reasonably long quarterly time series on total GDP of the economy. In view of the significant structural shifts towards the services sector and the interlinkages between agriculture, industry and services, the results of this empirical exercise should be considered as tentative and would need to be ratified with a comprehensive measure of output, as also by considering alternative techniques.
5.89 The monetary policy transmission mechanism in the future would have to grapple with the ongoing revolution in the payments and settlement system. The gradual e-monetisation can shrink cash demand and thus the monetary authority’s balance sheet, reducing seigniorage revenues and restricting open market operations. On the other hand, it is argued that the central bank’s ability to influence the nominal rate of interest is eventually an issue of political economy and the government can always require settlement through central bank money (Goodhart, 2000; RBI, 2002c). Besides, as long as monetary transactions take place through the banking channel - for example, a credit card payment is essentially an advance from a bank - the spread of e-monetisation does not, per se, require redefinition of monetary and financial aggregates (RBI, 1998b).
5.90 The 1990s marked a fundamental shift in the role of the monetary and financial system from a passive channel of resource mobilisation and disbursal guided by the planning process to an active role in resource allocation in accordance with market signals. The reforms were enabled by fundamental shifts in the monetary-fiscal interface. Moreover, in the context of the growing openness of the Indian economy, the absorption of excess foreign exchange supply in the market led to significant compositional shifts in the Reserve Bank balance sheet and the reserve money analytics. This necessitated recourse to open market operations to achieve the monetary policy objectives. Coupled with the ongoing financial deregulation and its possible implications for stability of money demand, the monetary targeting framework evolved into a multiple indicator approach in 1998-99. In addition, a framework for liquidity management in the form of Liquidity Adjustment Facility was put in place in June 2000.
5.91 The monetary policy reforms facilitated a significant reduction in pre-emption of resources. A noteworthy development was the lowering of inflation in the economy in the second half of the 1990s attributable, inter alia, to better monetary management. This, in turn, led to a concomitant softer interest rate environment, especially in the government securities market. The LAF was able to maintain stability in money market conditions. Finally, monetary policy was successful in sterilisation of capital flows in consonance with domestic requirements. An empirical assessment of the monetary transmission mechanism suggests that the output and inflation variations are largely on account of non-monetary factors and the contribution of the monetary policy shocks declined further during the 1990s as compared with the 1980s.
5.92 A few issues emerge from the analysis. An important factor determining the effectiveness of the monetary transmission process is the degree of ‘pass-through’. In view of the weak sensitivity of the bank lending rates to changes in the Bank Rate, the efficacy of the monetary policy in reinvigorating growth runs up against a constraint. Second, the shrinking net domestic assets of the Reserve Bank in the context of sustained capital flows brings into focus the limits of sterilisation on an ongoing basis.
5.93 Finally, a key objective of macroeconomic policy, including monetary policy, must be the avoidance of resurgence of inflationary expectations. In this context, despite a significant improvement in the monetary-fiscal interface during the 1990s, fiscal dominance continues to persist with growing volume of gross market borrowings. The burden of directly financing the fiscal deficit could easily revert back to the Reserve Bank in case of a reversal in the liquidity conditions, especially as banks’ investments in Government securities are already far in excess of their statutory SLR requirements. Therefore, the issue of separation of debt management function from the monetary authority needs to be addressed. The proposed Fiscal Responsibility and Budget Management Legislation and the need to accord greater operational flexibility to the Reserve Bank, as indicated in the Union Budget, 2000-01 could have far-reaching ramifications on the operational framework of monetary policy in India.
1. | See, for example, Goldfeld and Sichel (1990). Recently, some studies have argued that money demand function continues to be stable, once appropriate opportunity cost of money (Ball, 2001 and 2002) or decline in transactions costs induced by financial innovations are taken into account (Duca, 2000). |
2. | The Working Group on Money Supply recommended that in line with the residency criteria evolved by the International Monetary Fund (IMF), non-resident foreign currency repatriable fixed deposits should not be directly accounted in the monetary aggregates so that the monetary impact of capital flows depends on their net effect on the monetary base (RBI, 1998b; Rath and Sen Gupta, 1999). It is, therefore, necessary to adjust the existing monetary data for inflows, such as, Resurgent India Bonds and India Millennium Deposits. |
3. | DINFLX = -0.46 DINFLX(-1) + 0.40 YGAP(-1) + 0.22 DINFFOOD + 3.67 DUM88 – 5.60 DUM97 |
DINFLX = -0.49 DINFLX(-1) + 0.37 YGAP(-1) + 0.21 DINFFOOD + 0.86 MGAP +4.09 DUM88 – 4.95 DUM97 | |
DINFLX, YGAP, MGAP, DINFFOOD are change in WPI inflation rate, output gap (HP filtered), nominal broad money gap (HP filtered) and change in foodgrains inflation rate, respectively. DUM88 and DUM97 are dummies for 1987-88 and 1996-97 to capture drought effect and sharp disinflation, respectively. The equations have been estimated over the period 1984-85 to 2001-02; t-ratios are in parantheses. | |
4. | The volatility measures for this exercise focus on intra-year variation, with coefficient of variation calculated from growth rates based on 12-month moving averages. |
5. | There is empirical evidence that sectoral credit aggregates (credit to the government and the commercial sector) can explain the behaviour of broad money with unidirectional causation from credit to money suggesting the feasibility of a balance sheet approach to money stock determination in India (Joshi and Bhattacharya, 1999). |
6. | Using a bivariate VAR of index of industrial production (IIP) and non-food credit (NFC) (with both variables in first-difference of logs) over the period April 1994 to December 2002, the null hypothesis of Granger non-causality of IIP can be rejected at p-value of 0.00 (with chi-square of 39.7). Similarly, the null hypothesis of Granger non-causality of NFC can be rejected at p-value of 0.00 (with chi-square of 33.1). The VAR was estimated with 13 lags, with lag selection based on Schwarz Bayesian Information Criterion (SBIC). |
7. | The cointegrating relationship between index of industrial production (IIP) and real non-food credit (NFCREAL) (the prefix L denotes that variables are in logs), over the period April 1994 to December 2002, with one lag in the VAR and a dummy for the impact of the mergers in the banking industry, is: LNFCREAL = 5.39 + 1.51 LIIP. |
8. | In a bivariate VAR of net foreign exchange assets (NFA) and net domestic assets (NDA) of the Reserve Bank (with both variables in first-difference) over the period April 1994 to December 2002, the null hypothesis of Granger non-causality of NDA can not be rejected (with chi-square of 0.37 at p-value of 0.54). On the other hand, the null hypothesis of Granger non-causality of NFA can be rejected (with chi-square of 9.35 at p-value of 0.00). The VAR was estimated with one lag based on Schwarz Bayesian Information Criterion (SBIC). |
9. | The estimated equation, using monthly data over April 1994 to December 2002, is: DNDA = -1243 – 0.84 DNFA + 139.9 DIIP(-1) + 87.2 DWPIA(-1) + 5513 DCRRAVG. |
(1.7)*** (10.3)* (1.7)*** (1.2) (11.7)* –DW =2.3 R2 = 0.78 | |
The figures in brackets are t-values; *,** and *** denote significance at 1,5 and 10 per cent level, respectively. DNDA, DNFA, DIIP and DCRRAVG denote monthly variations in net domestic assets, net foreign assets, index of industrial production and average CRR, respectively. DWPIA is year-on-year inflation rate. In addition, monthly dummies for March, April, May, October and November turned out to be significant and were included in the estimated equation. The variable DCRRAVG captures the reduction in NDA over the sample period that was due to the lowering of CRR. | |
10. | YGAP = - 0.06 RLINTWTP(-1) – 0.07 DFUEL + 0.38 GDPAGRI + 0.89 YGAP(-1) (2.4) (4.4) (8.2) (5.5) Durbin’s h = 0.7; R2 = 0.69. |
YGAP, RLINTWTP, DFUEL and GDPAGRI are output gap, real weighted bank lending rate (nominal weighted average less WPI inflation rate), fuel inflation and agricultural growth. The equation has been estimated over 1972-73 to 2001-02 using annual data. The figures in brackets are t-values. | |
11. | Rudebusch (1998), for instance, points out that monetary policy shocks obtained from VAR are not a good indicator since they have a very low correlation with those emerging from the federal funds futures market. Nonetheless, Sims (1998) observes that VAR may provide a correct description of the economy. |
পেজের শেষ আপডেট করা তারিখ:


