V. State-wise Analysis of Fiscal Performance - আরবিআই - Reserve Bank of India


V. State-wise Analysis of Fiscal Performance
Macroeconomic slowdown and counter-cyclical measures in the form of reduction in tax rates impacted the States’ own tax revenue as well as tax devolution from the Centre during 2009-10. On the expenditure side, non-development expenditure increased more sharply than development expenditure, mainly on account of the Sixth Pay Commission awards. Consequently, the fiscal position of States deteriorated, with the majority of non-special category States showing revenue deficits and widening of fiscal deficits despite reduction in capital outlay of these States. In 2010-11(RE), however, there was some improvement in revenue accounts of States; the GFD-GDP ratio also witnessed an improvement at the consolidated, level with deterioration seen in fewer States than in the previous year. The capital outlay-GSDP ratio was higher in most States in 2010-11(RE). Development and social sector expenditure also improved, indicating that States resumed fiscal consolidation efforts without compromising on the quality of expenditure. This move towards fiscal consolidation strengthened in 2011-12 (BE), with most of the States aiming to generate revenue surpluses and improve their GFD-GSDP ratios during the year. The uptrend in the capital outlay- GSDP ratio is budgeted to continue during 2011-12, though it is yet to reach the pre-crisis level in some of the States. Although most States have budgeted for revenue surpluses, thereby surpassing the ThFC target of revenue balance by 2011-12, GFD-GSDP ratios are expected to remain higher than the targets on account of higher capital outlays. 1. Introduction 5.1 State-wise assessment of fiscal performance assumes significance in the context of different time lines prescribed by the Thirteenth Finance Commission (ThFC) for different groups of State governments for returning to rule-based fiscal consolidation path after the deviation observed during 2008-09 and 2009-10 when fiscal imbalances had widened. The adjustment year, viz., 2010-11, saw the States revisiting fiscal consolidation, and most of them have budgeted further improvement in their fiscal balances during 2011-12. The amended Fiscal Responsibility and Budget Management (FRBM) Acts released by several States during 2011-12 reinforce their continued commitment to the path of mediumterm fiscal consolidation. Against this backdrop, this Chapter assesses the fiscal performance of the States based on data relating to their fiscal operations for 2009-10 (Accounts), 2010-11(RE) and 2011-12(BE). This assessment is done for non-special category (NSC) and special category States11. The assessment relates to three broad parameters viz., (i) deficit indicators; (ii) revenue receipts; and (iii) expenditure pattern. Most of the fiscal indicators are expressed in terms of Gross State Domestic Product (GSDP) at current prices, which are sourced from Central Statistics Office (CSO), State budget documents and the database of the State governments.12 The Statewise fiscal position in terms of deficit indicators for 2011-12 is also reviewed in the context of the revised roadmap benchmarked by the ThFC for various States. Data for two Union Territories with Legislature, viz., NCT Delhi and Puducherry, are also provided in the tables as a memo item. The detailed State-wise data on various fiscal indicators are set out in Statements 1 to 47. 2. Deficit Indicators of State Governments Non-Special Category States 5.2 The process of fiscal correction by NSC States, which had received a setback in 2008-09 due to the global crisis, weakened further in 2009-10, reflecting the impact of the Sixth Pay Commission awards and counter-cyclical fiscal measures undertaken to address the macroeconomic slowdown. With the revival in economic growth during 2010-11, NSC States revisited the path of fiscal correction. Amending their FRBM Acts in line with the revised fiscal roadmap suggested by the ThFC, the budgets of NSC States for 2011-12 indicate further progress in the fiscal consolidation process being pursued by these States (Table V.1). 5.3 Of the 13 NSC States whose revenue accounts were adversely affected in 2009-10, the revenue account position of three States viz., Goa, Maharashtra and Tamil Nadu slipped from surplus to deficit, while six States (Gujarat, Haryana, Kerala, Punjab, Rajasthan and West Bengal) witnessed an increase in their revenue deficit (RD)-GSDP ratios and four States (Bihar, Chhattisgarh, Karnataka and Odisha) recorded a decline in their revenue surplus (RS)-GSDP ratios. The deterioration in the revenue account during 2009-10 was caused by (a) an increase in revenue expenditure (RE)-GSDP ratios in three NSC States (Chhattisgarh, Goa and Karnataka); (b) a decrease in revenue receipts (RR)- GSDP ratios in five NSC States (Bihar, Kerala, Punjab, Tamil Nadu and West Bengal); and (c) a decline in RR-GSDP ratios as well as an increase in RE-GSDP ratios in five States (Gujarat, Haryana, Maharashtra, Odisha and Rajasthan). Despite the adverse economic environment, four NSC States (Andhra Pradesh, Jharkhand, Madhya Pradesh and Uttar Pradesh) recorded an increase in their RS-GSDP ratios in 2009-10. This improvement was brought about by an increase in the RR-GSDP ratios in three States (Jharkhand, Madhya Pradesh and Uttar Pradesh), and a decline in the RE-GSDP ratio in the case of Andhra Pradesh. 5.4 The gross fiscal deficit (GFD)-GSDP ratio increased in 13 States during 2009-10, of which four States (Goa, Haryana, Karnataka and Kerala) witnessed increases in both RD-GSDP ratio as well as capital outlay (CO)-GSDP ratio. In eight States viz., Bihar, Chhattisgarh, Gujarat, Maharashtra, Odisha, Punjab, Tamil Nadu and West Bengal, the deterioration in terms of GFD-GSDP ratio was attributable solely to the increase in RD-GSDP ratio. Madhya Pradesh was the only NSC State in which the GFD-GSDP ratio widened in 2009-10 on account of a higher CO-GSDP ratio and a substantial increase in net lending (loans and advances by the State government net of recoveries). In 2009-10, the GFDGSDP ratios of four NSC States were above the revised limit of 4.0 percent allowed by the Central government. In contrast to the trend witnessed by the majority of NSC States, Andhra Pradesh, Jharkhand, Punjab and Uttar Pradesh recorded a decline in their GFD-GSDP ratios. 5.5 Fourteen NSC States recorded an increase in their primary deficit (PD)-GSDP ratios, of which one State (Andhra Pradesh) recorded an increase in its PD-GSDP ratio despite a reduction in the GFD-GSDP ratio. The NSC States, except Haryana, Punjab and West Bengal, recorded a primary revenue surplus (PRS), although PRS-GSDP ratios declined in 11 NSC States during 2009-10. 5.6 In 2010-11(RE), there was a further deterioration in the revenue accounts of seven States, while the remaining NSC States showed an improvement in their revenue account over the previous year. During 2010-11(RE), the GFD-GSDP ratio also increased in eight NSC States and was above 3.0 percent in 10 NSC States. The PD-GSDP ratio moved in line with the GFD-GSDP ratio of the States. With improvement in the primary revenue balance of nine NSC States, all NSC States barring Haryana and West Bengal recorded primary revenue surpluses. 5.7 During 2011-12, the majority of NSC States have budgeted for an improvement in their fiscal situation which is evident across all the deficit indicators (Tables V.1 and V.2). Special Category States 5.8 The revenue surplus of special category States at the consolidated level declined in 2009-10; their consolidated GFD-GSDP ratio, as a result, increased during the year. All special category States except Meghalaya and Tripura recorded primary deficit. The PRS-GSDP ratio of special category States also declined to 4.7 percent in 2009-10 from 7.3 percent 2008-09. 5.9 The special category States witnessed an improvement in their revenue account at the consolidated level during 2010-11(RE), with all of them barring Assam and Himachal Pradesh showing surpluses in their revenue accounts. Despite the correction in the revenue account, the GFD-GSDP ratio of special category States taken together was marginally higher at 4.8 percent during 2010-11(RE) on account of an increase in the CO-GSDP ratio in seven special category States. While the PD-GSDP ratio at the consolidated level deteriorated marginally in 2010-11(RE), Arunachal Pradesh, Himachal Pradesh, Jammu and Kashmir, Nagaland and Uttarakhand recorded a primary surplus during the year. The PRB-GSDP ratio of special category States, at consolidated level, however, improved during 2010- 11(RE). Assam was the only special category State which recorded a primary revenue deficit during the year. 5.10 The revenue account of special category States is budgeted to improve further during 2011- 12. With a turnaround from deficit to surplus in two States, all the special category States expect to record surpluses in their revenue accounts during 2011- 12(BE). Consequently, the consolidated RS-GSDP ratio is budgeted to increase to 3.3 percent in 2011- 12. A corresponding improvement is also expected in the consolidated GFD-GSDP ratio of special category States to 3.4 percent in 2011-12 (BE) from 4.8 percent in 2010-11(RE) (Table V.2). This is not with standing the fact that the CO-GSDP ratio is budgeted to increase in four States. The PD-GSDP ratio is budgeted to improve from 1.8 percent in 2010- 11(RE) to 0.7 percent in 2011-12, with six States expected to record primary surpluses.
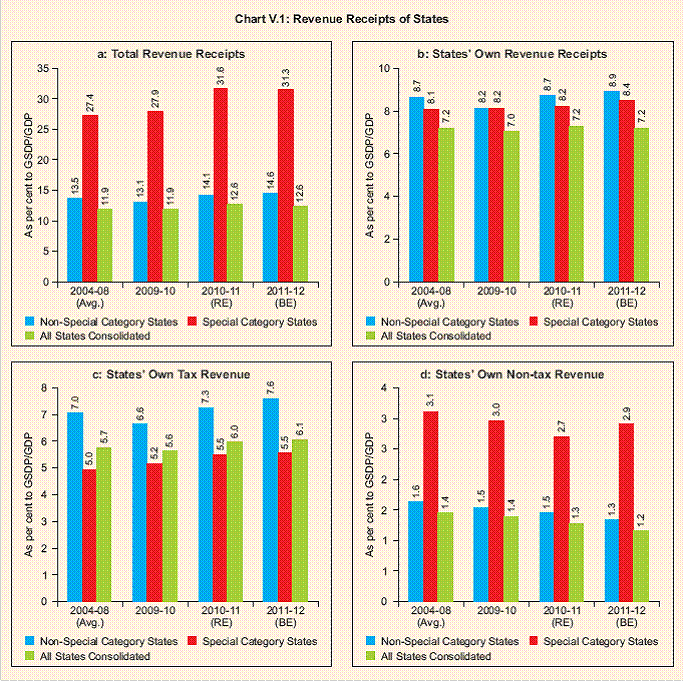
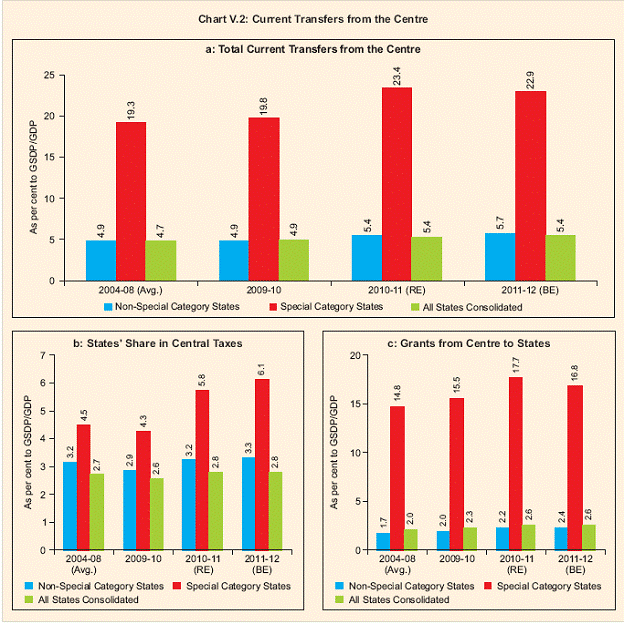
3. Revenue Receipts of State Governments 5.11 The revenue collections of States remained subdued in 2009-10 in the wake of economic moderation and counter-cyclical measures taken by the States such as exemption/reduction in State tax rates. However, revenue collections recovered in 2010-11(RE) and are budgeted to improve further during 2011-12. Various indicators pertaining to the revenue receipts of States are presented in Table V.3, while those pertaining to revenue expenditure are set out in Table V.4. Non-special Category States 5.12 NSC States, with their contribution of around 90 percent of the total revenue receipts drive the trend in consolidated State finances. Thus, the fiscal policy stance of NSC States has a significant bearing on the consolidated position of State finances. In 2009-10, RR-GSDP ratios recorded a decline in NSC States at the consolidated level, with sharper decline seen in States like Andhra Pradesh, Bihar, Gujarat, Kerala, Maharashtra, Odisha, Rajasthan, Tamil Nadu and West Bengal. Tax receipts from both own tax collections as well as States’ share in Central taxes declined in 2009-10, reflecting the impact of subdued economic activity, though it reversed somewhat during the second half of the year. Gujarat, Maharashtra, Odisha and Tamil Nadu witnessed decline in all the components of revenue receipts in terms of GSDP. It may be mentioned that States’ share in Central taxes as a ratio to GSDP (SCT-GSDP) declined in all the NSC States during 2009-10 which was, however, compensated by an increase in grants-in-aid as a ratio to GSDP (GR-GSDP) in some States (Table V.3, and Chart V.2).
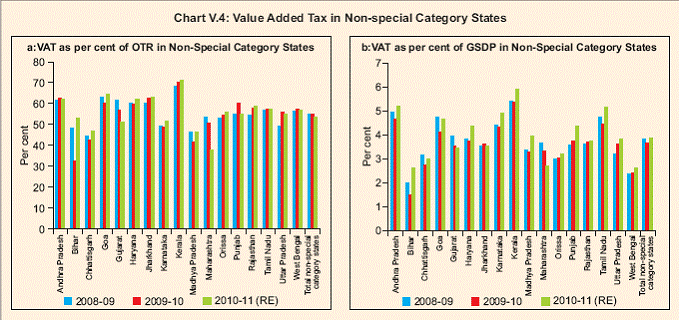
5.13 With the revival in economic activity, all the NSC States barring Jharkhand showed an increase in their RR-GSDP ratios in 2010-11(RE). While the own tax revenue (OTR)-GSDP ratio increased in 14 NSC States, own non-tax revenue (ONTR)-GSDP ratio remained subdued in majority of the States. Current transfers as a ratio to GSDP (CT-GSDP) also recorded an increase in 2010-11(RE) at the consolidated level for NSC States. The improvement was seen across all the NSC States except Jharkhand and Karnataka. Within current transfers, the SCT-GSDP ratio increased in 13 NSC States (except Chhattisgarh, Gujarat, Jharkhand and Kerala) while the GR-GSDP ratio was higher in 14 NSC States (except Jharkhand, Karnataka and Uttar Pradesh). 5.14 In 2011-12, the RR-GSDP ratio is budgeted to rise to 14.6 percent from 14.1 percent in 2010- 11(RE), attributable to an improvement in the own revenues(OR)-GSDP ratio (0.2 percentage points) and the CT-GSDP ratio (0.3 percentage points) (Table V.3, Chart V.1 and V.2). 5.15 As regards States’ own tax receipts, revenue collections from value added tax (VAT) were adversely affected by the slowdown in economic activity and reduction in tax rates in some States during 2009-10. Consequently, the increasing trend in VAT-GDP ratio as well as in VAT-OTR ratio of all States, which was evident in earlier years, reversed in 2009-10. Among the NSC States, 11 States recorded a decline in the VAT-GSDP ratio while eight States registered a decrease in the VAT-OTR ratio during 2009-10. However, both the VAT-GSDP and the VAT-OTR ratios improved in the majority of NSC States during 2010- 11(RE). The improvement in both the ratios is expected to continue in 2011-12 (BE) (Chart V.4).
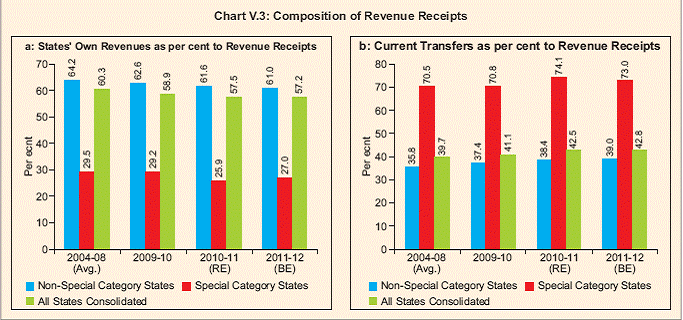
Special Category States 5.16 Current transfers comprising States’ share in Central taxes and grants-in-aid account for over 70 percent of total revenue receipts of special category States (Chart V.3). Therefore, revenue receipts of special category States are driven largely by the revenue performance of the Central government. The RR-GSDP ratio decreased in 2009-10 in seven special category States, though it was slightly higher at the consolidated level. While the SCT-GSDP ratio declined across all special category States in consonance with subdued mobilisation of tax revenue by the Central Government, five special category States also recorded a decline in their GR-GSDP ratios. The OTR-GSDP and ONTR-GSDP ratios declined during 2009-10 for three special category States & eight special category States, respectivily. With the revival in economic growth, the consolidated RRGSDP ratio increased to 31.6 percent in 2010-11 (RE), which is largely attributable to an increase in the CT-GSDP ratio in all special category States except Himachal Pradesh and Tripura. Within current transfers, the SCT-GSDP ratio increased in all States while GR-GSDP ratio increased in nine States. In 2011-12, although OTR, ONTR and SCT as ratios to GSDP are budgeted to increase in the majority of special category States, the RR-GSDP ratio is placed lower in seven special category States, mainly due to a decline in the GR-GSDP ratio.
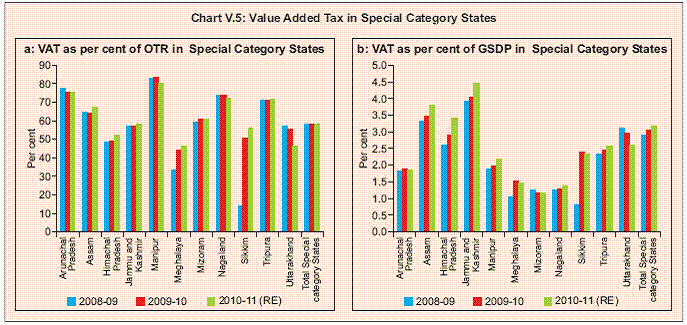
5.17 Not with standing the macroeconomic slowdown, the consolidated VAT-GSDP ratio of special category States registered a marginal increase in 2009-10. In line with the revival in economic activity, the consolidated VAT-GSDP ratio increased in 2010-11 (RE) which is budgeted to improve further in 2011-12 (Chart V.5). 4. Expenditure Pattern of State Governments Revenue Expenditure 5.18 The expenditure pattern of the State governments had undergone significant change during the fiscal consolidation phase (2004-05 to 2007-08). During this period, efforts made by the Central government through the introduction of the Debt Swap Scheme (DSS) and provision of Debt Consolidation and Relief Facility (DCRF) based on the Twelfth Finance Commission recommendations led to a decline in both the interest payments (IP)- GSDP and IP-RR ratios of the States. State governments had also laid considerable emphasis on rationalisation of their expenditure during this period. Consequently, there was a gradual decline in the (RE)- GSDP ratios of the States while development expenditure, capital outlay, and social sector expenditures improved across States during this period. However, the implementation of the Sixth Pay Commission award and fiscal stimulus measures taken in the post-global financial crisis period led to a sharp increase in the RE-GSDP ratios of States during 2008-09 and 2009-10, while capital outlays and development expenditure were affected adversely during these years. Not with standing some improvement in capital outlays and development expenditure (DE)- GSDP ratios in 2010-11 (RE) and 2011-12 (BE), these are yet to reach their pre-crisis levels.
5.19 The RE-GSDP ratio of NSC States at the consolidated level recorded 13.8 percent in 2009- 10, with 11 NSC States recording an increase in their RE-GSDP ratios during the year. The trend of an increasing RE-GSDP ratio persisted during 2010-11, with only four States viz., Gujarat, Kerala, Rajasthan and West Bengal showing reduction in RE-GSDP ratios. However, the RE-GSDP ratio is budgeted to decline in major States in 2011-12 which is reflected in a turn around in the consolidated revenue account of all States into a surplus position after a gap of two years (Table V.4). The RE-GSDP increased across all special category States, except Mizoram and Sikkim, in 2009-10 mainly due to the impact of Sixth Pay Commission awards. The consolidated REGSDP ratio of special category States increased further during 2010-11(RE), reflecting the increase in development revenue expenditure (DRE) - GSDP ratio. It may be mentioned that nine special category States have budgeted for a decline in their RE-GSDP ratio during 2011-12, though this is mainly on account of a decline in the DRE-GSDP ratio in eight of these States (Table V.4). 5.20 The DRE accounted for 60 percent of the total revenue expenditure of NSC States at the consolidated level during 2009-10. In 2009-10, the DRE-GSDP ratio increased in eight of the 17 NSC States. Bihar recorded the highest DRE-GSDP ratio, followed by Chhattisgarh, while the same was the lowest in Punjab. In 2010- 11(RE), all NSC States, with the exception of Gujarat, posted increase in DREGSDP ratios, with Bihar continuing to record the highest ratio. In 2011-12, The DRE-GSDP ratio is budgeted to increase in 10 States. It may be mentioned that three NSC States (Chhattisgarh, Goa and Rajasthan) recorded a steady increase in their DRE-GSDP ratios in each of the years during the period 2009-10 to 2011-12 (BE). Although the DREGSDP ratio of consolidated special category States increased in 2009-10 and 2010-11(RE), it is budgeted to decline in 2011-12.
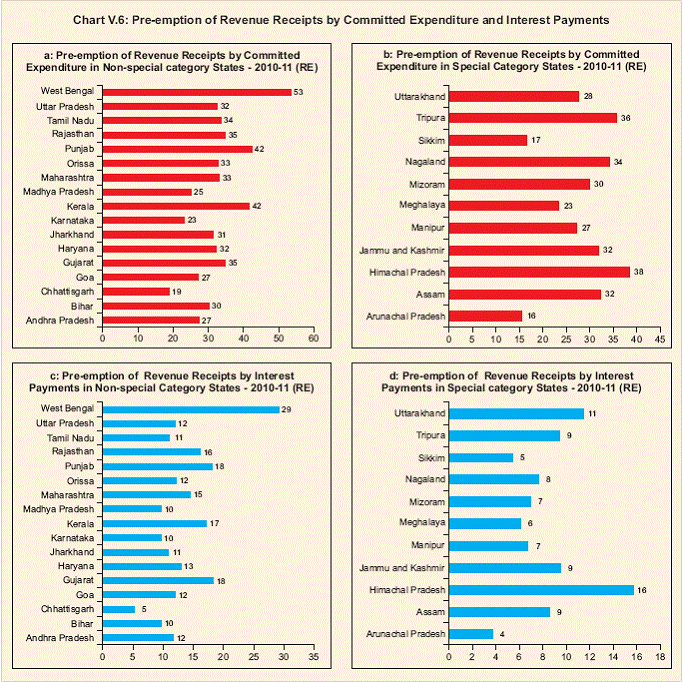
5.21 The non-development revenue expenditure- GSDP (NDRE-GSDP) ratio, with a share of around 37.5 percent in total revenue expenditure of NSC States, increased in 11 NSC States in 2009-10. Punjab recorded the highest NDRE-GSDP ratio despite a decline in its ratio over the previous year. In 2010- 11(RE), the NDRE-GSDP ratio increased in nine NSC States, with Uttar Pradesh recording the highest ratio. In 2011-12(BE), the NDRE-GSDP ratio at the consolidated level is budgeted to decline slightly, though it is expected to be higher in 9 NSC States. The NDRE-GSDP ratio for consolidated special category States increased steadily during 2009-10 to 2011-12(BE). 5.22 Committed expenditure13 (CE) is a major component of non-development revenue expenditure. CE-GSDP ratio of NSC States declined from average of 5.0 percent during 2004-08 to 4.6 percent during 2010-12 (BE). Committed expenditure accounted for 53 percent of the total revenue receipts of West Bengal, followed by Punjab and Kerala in 2010- 11(RE) (Chart V.6). Pension payments as a proportion of GSDP (PN-GSDP) increased in 15 NSC States during 2010-11(RE) over the previous year. It is budgeted to increase in nine States in 2011-12, with Bihar registering the maximum increase of 0.4 percentage point to 3.1 percent of its GSDP. 5.23 Contrary to the position of NSC States, the CE-GSDP ratio of consolidated special category States maintained an up trend and reached as high as 9.8 percent in 2011-12 (BE).The CE of consolidated special category States to pre-empt nearly one-third of their revenue receipts.Among the special category States, Himachal Pradesh recorded the highest committed expenditure-revenue receipts ratio in 2010-11(RE) (Chart V.6).
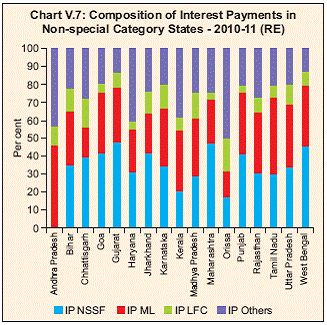
5.24 With respect to the IP-GSDP ratio, there has been an improvement across NSC States since 2004- 05 which was facilitated by the DSS and the DCRF on the one hand, and progressive reduction in the GFD-GSDP ratio on the other. The IP-GDP ratio for all States declined from an average of 2.3 percent during 2004-08 to 1.7 percent in 2009-10 and budgeted to decline further to 1.6 percent in 2011-12 (BE). During 2010-11 (RE), the pre-emption of revenue receipts by interest payments was the highest in West Bengal, followed by Gujarat and Punjab. Among the special category States, Himachal Pradesh recorded the highest IP-RR ratio in 2010- 11(RE) followed by Uttarakhand. 5.25 The composition of interest payments of the NSC States for 2010-11(RE) shows that despite the larger share of market loans in total liabilities (33.5 percent) than securities issued to NSSF (27.4 percent), interest payments to the NSSF was higher, reflecting the high cost of funds raised from the NSSF (Chart V.7).
Development Expenditure14 5.26 Social sector expenditure (SSE) as a ratio to GSDP of NSC States at the consolidated level increased during 2009-10. Reflecting the improvement in the SSE-GSDP ratios of 14 NSC States in 2010-11(RE), the SSE-GSDP ratio at the consolidated level increased further by 0.6 percentage points to 7.4 percent and is budgeted to remain stagnant at this level during 2011-12. Three NSC States, viz., Chhattisgarh, Goa and West Bengal witnessed a persistent rise in their SSE-GSDP ratios from 2009-10 to 2011-12 (BE). The SSE-GSDP ratios of special category States at the consolidated level increased during 2009-10 and 2010-11 (RE) but it is budgeted to decline in 2011-12 (Table V.6). 5.27 The CO-GSDP ratio of NSC States at the consolidated level decreased in 2010-11 (RE) over the previous year but it is budgeted to increase in 2011-12. In contrast, the CO-GSDP ratio of special category States at the consolidated level increased in 2010-11 (RE), but it is budgeted to decline in 2011- 12 (BE). There were considerable differences across special category States in terms of the CO-GSDP ratio, which seem to have persisted over the years (Table V.6). 5. Budgetary Stance of States for 2011-12 vis-àvis the ThFC Benchmark 5.28 A comparison between the budgeted revenue and fiscal deficits relative to GSDP for 2011-12 and the respective ThFC targets for the year, applying the GSDP projection by the ThFC, is presented in Table V.7. Most NSC States (with the exception of Goa, Haryana, Kerala, Punjab and West Bengal) and all special category States have budgeted for better performance on their revenue accounts than the ThFC targets. The GFD-GSDP ratios are, however, budgeted to exceed the ThFC targets for most States (barring Gujarat, Maharashtra, Rajasthan and West Bengal in the non-special category States and Assam, Himchal Pradesh, Meghalaya and Mizoram in the special category States). The extent to which the increase in the budgeted GFD-GSDP ratio is on account of increased capital outlay indicates that the quality of public expenditure is sought to be maintained by the States. West Bengal is the only State which has budgeted for a lower GFD-GSDP ratio despite a higher RD-GSDP ratio, indicating a lower capital outlay than was expected by the ThFC. As most States have amended their FRBM Acts after the presentation of their budgets and 2011-12 is the first year earmarked by the ThFC for fiscal consolidation, the States can be expected to gradually move further towards fiscal consolidation in the coming years so as to attain the targets by 2014-15.
6. Conclusion 5.29 The analysis of State finances during 2009- 10 to 2011-12 (BE) reveals that State governments faced considerable fiscal stress during 2009-10. Twelve States recorded a revenue deficit in 2009-10 as against seven States in 2008-09, reflecting the marked deterioration in the revenue account of States. Despite a decline in CO-GSDP ratio across the majority of States, GFD-GSDP ratio widened in 20 States. Twelve States recorded GFD-GSDP ratios higher than the enhanced limit of 4 percent for 2009-10. In 2010-11(RE), State governments resumed their fiscal consolidation process, with the revenue account of 17 States showing improvement during the year. However, the CO-GSDP ratio increased in a large number of States which contributed to widening the GFD-GSDP ratio in 14 States. Nonetheless, the GFD-GSDP ratio exceeded 3.0 percent in only 16 States in 2010- 11(RE) as against 19 States in 2009-10. Based on budgetary data for 2011-12, fiscal consolidation is expected to be more pronounced, with turn around/ improvement in the revenue account position of the majority of the States. In line with the correction in revenue account, the GFD-GSDP ratio is budgeted to decline in 18 States during 2011-12, even though CO-GSDP ratio is placed higher in 17 States during the same period. Most States have budgeted to eliminate their revenue deficit by 2011-12 as envisioned by the ThFC, though their GFD-GSDP ratios remain higher than the ThFC targets for the year on account of increases in capital outlays. In view of these developments, it is expected that States would revert to the medium-term fiscal consolidation path through continued improvement in their revenue accounts, which is essential to create space for meeting higher capital outlays while reducing their borrowing requirements. 11 Special category States are distinguished from NSC States by their geographical condition (hilly terrain) and socio-economic status and are heavily dependent on the Centre for transfers. 12 The GSDP data, wherever unavailable, has been projected based on average growth of previous three years. 13 Comprising interest payments, pension and administrative services. 14 Include total expenditure on social and economic services. |
|||||||||||||||||||||||||||||||||||||||||||||||||||||||||||||||||||||||||||||||||||||||||||||||||||||||||||||||||||||||||||||||||||||||||||||||||||||||||||||||||||||||||||||||||||||||||||||||||||||||||||||||||||||||||||||||||||||||||||||||||||||||||||||||||||||||||||||||||||||||||||||||||||||||||||||||||||||||||||||||||||||||||||||||||||||||||||||||||||||||||||||||||||||||||||||||||||||||||||||||||||||||||||||||||||||||||||||||||||||||||||||||||||||||||||||||||||||||||||||||||||||||||||||||||||||||||||||||||||||||||||||||||||||||||||||||||||||||||||||||||||||||||||||||||||||||||||||||||||||||||||||||||||||||||||||||||||||||||||||||||||||||||||||||||||||||||||||||||||||||||||||||||||||||||||||||||||||||||||||||||||||||||||||||||||||||||||||||||||||||||||||||||||||||||||||||||||||||||||||||||||||||||||||||||||||||||||||||||||||||||||||||||||||||||||||||||||||||||||||||||||||||||||||||||||||||||||||||||||||||||||||||||||||||||||||||||||||||||||||||||||||||||||||||||||||||||||||||||||||||

এই পেজটি শেয়ার করুন:


রিজার্ভ ব্যাঙ্ক অফ ইন্ডিয়া মোবাইল অ্যাপ্লিকেশন ইনস্টল করুন এবং সাম্প্রতিক সংবাদগুলিতে দ্রুত অ্যাক্সেস পান!


