 IST,
IST,
VI. Price Situation
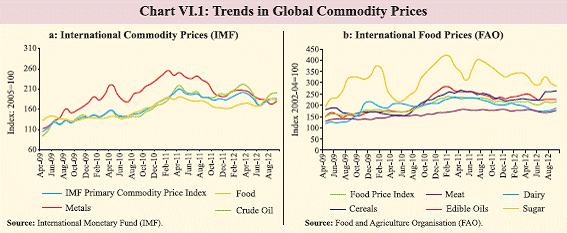
WPI inflation has stayed around 7.5 per cent during 2012-13 so far. This reflects a combination of factors: the spillover impact from fiscal imbalances, some pass-through from earlier exchange rate depreciation and feeble supply response. Persistence in the non-food manufactured products inflation, even as growth has slowed, has emerged as a concern. While the late revival of monsoon has helped cool the price pressure from commodities like vegetables, the projected shortfall in the kharif crop is likely to exert pressure on food prices, especially cereals, pulses and oilseeds. Though the administered price revisions effected in September 2012 will raise inflation in the near-term, they will also help in reducing the medium-term inflationary pressures by containing the fiscal deficit. The pressures on fuel inflation could soften if crude prices remain range-bound and rupee maintains a strengthening bias. Overall, the inflation path is expected to remain sticky in the near-term, barring major supply shocks. As global inflation conditions ease, India remains an outlier VI.1 Tepid growth, high unemployment and negative output gap along with weak demand have eased the inflation environment in the Advanced Economies (AEs). The average inflation for OECD countries declined to 2.0 per cent in August 2012 from 2.8 per cent in January 2012. India remains an outlier, with higher inflation than most Emerging and Developing Economies (EDEs), which reflects the role of structural as well as country-specific factors. Further quantitative easing by AE central banks adds to global liquidity VI.2 The monetary policy stance in most AEs remains accommodative of growth recovery (Table VI.1). The recent round of monetary easing by some central banks of AEs, notably the European Central Bank (ECB), US Federal Reserve (US Fed) and the Bank of Japan (BoJ) during September 2012 temporarily reduced financial market stress and contributed to asset price build-up, particularly in equity markets as sentiments improved (for details see Chapter V). The exceptionally easy monetary policy of the US Fed and the BoJ is expected to weaken the dollar and yen and trigger gains in EDE currencies. This could feed into lower inflation in EDEs through exchange rate pass-through effects. However, the liquidity glut in AEs could get transmitted to EDEs given the interest rate differential, which may push up demand and lead to higher commodity prices. VI.3 Given the spare capacity in the US and the global economy, subdued wage pressures and limited impact of commodity prices on core inflation in AEs, pressures on inflation in the near-term may remain low. However, the medium-term impact of easing of liquidity on inflation and inflationary expectations cannot be overlooked. The impact of quantitative easing on commodity prices through the financialisation of commodity markets is also likely to be a source of risk to inflation. Global commodity prices remain volatile with uncertain outlook VI.4 International commodity prices increased markedly in Q2 of 2012-13, reverting from the moderation observed during Q1 (Chart VI.1a). The uptick in commodity prices in recent months has been driven by crude oil and food prices. However, metal prices have continued to decelerate since February 2012, except for the recent period, due to weak demand conditions in both AEs as well as EDEs. Taking into account the relatively subdued demand, given the growth slowdown and possible increases in oil production in OPEC countries, Brazil, Kazakhstan, and the Russian Federation and the impact of shale gas on energy supplies in the US, crude oil prices are expected to remain range-bound. However, the near-term path of energy prices could be conditioned by the Middle East geopolitics.
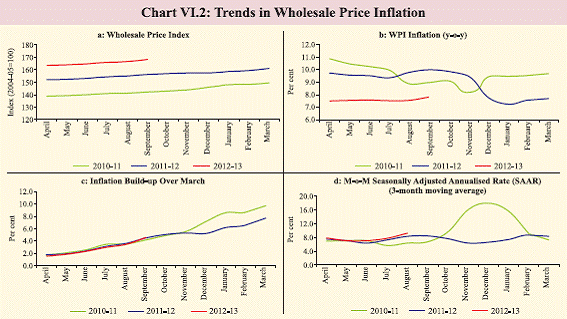
VI.5 Food prices, especially of wheat and coarse cereals, increased in recent months following supply disruptions in a number of countries (Chart VI.1b). The Food and Agriculture Organisation (FAO) estimates that world cereal production in 2012 will be 2.6 per cent down from the previous year’s record crop, but suggests that fears of serious global supply shortages are now behind us. Notwithstanding the early indications of improved crop conditions in 2013, the near-term price pressures on global food continue to remain significant and could turn out to be a source of inflation especially for countries that are net importers. Inflation pressures persist in India despite weakening of growth momentum VI.6 Headline WPI inflation (y-o-y) has remained sticky at around 7.5 per cent throughout the current financial year (7.8 per cent, provisional in September 2012). The build-up in price pressures continues to remain persistent as seen from the secular upward trend in the index (Chart VI.2). The momentum of price changes, as indicated by the 3-month moving average seasonally adjusted month-over-month changes in WPI, also indicates some uptick in the recent months (Chart VI.2d).
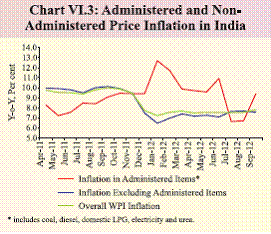
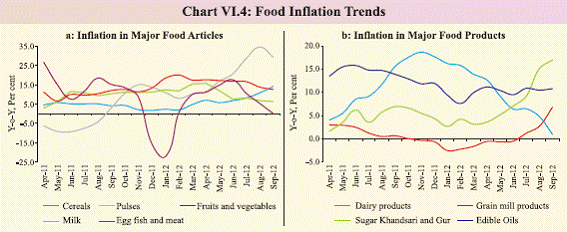
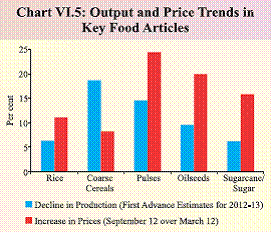
VI.7 In the recent period, changes in administered prices have been a major driver of inflation (Chart VI.3). Revisions in coal prices in January 2012 and electricity prices in June 2012 led to higher inflation. The revision in diesel and LPG prices would add to inflation during the course of the year though it will help moderate inflationary pressures in the mediumterm, by way of fiscal consolidation Food inflation remains elevated reflecting poor supply elasticities VI.8 Food inflation concerns persist. Although there has been some moderation in the inflation in fruits and vegetables in recent months following the late revival of the monsoon, a number of items within the primary food articles group witnessed significant price pressures (Chart VI.4a). Inflation in cereals has reached double digits after more than two years, while pulses inflation has remained above 20 per cent since June 2012. Apart from the trends in primary food articles, there has been significant pressure on some manufactured food products like sugar and edible oils (Chart VI.4b). The deficiency of the monsoon during June and July 2012 impacted the crop prospects of key food products, which has translated into an increase in prices (Chart VI.5).
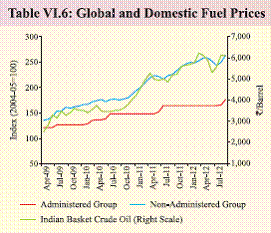
VI.9 Since 2008-09 the average food inflation at 10.3 per cent has been much above the overall headline inflation of 7.6 per cent. Both supply and demand side factors could have played a role in keeping food inflation high. Significant increases in rural wages in recent years have contributed substantially to the increase in cost of production as productivity growth remains low. This has also led to a significant increase in the Minimum Support Prices for most crops. At the same time, increases in wages, both in rural and urban areas, could have pushed up demand for food, given that the share of food in total consumption basket is higher for wage earners than for other segments of the population. VI.10 The recently released key results of the NSSO 68th round survey (2011-12) on household consumption expenditure indicate that real per capita consumption expenditure in rural and urban areas grew at an average rate of 8.7 per cent and 6.7 per cent per annum, respectively, during the period 2009-10 to 2011-12, compared with a growth of 1.4 per cent and 2.4 per cent per annum, respectively, during 2004-05 to 2009-10. Although these results could have been influenced by the fact that 2009-10 was a drought year, which could have led to underestimation of consumption, thereby giving a low base, the fact that real consumption expenditure expanded during a period of high food inflation indicates that the demand remains strong, feeding into higher price levels as supply elasticities remain low. Fuel inflation reflects lagged pass-through; under-recoveries remain high VI.11 Inflation in the fuel and power group remained in double digits since February 2010, except for July and August 2012. The uptick in fuel inflation to double digits in September 2012 was driven by revision in price of diesel and increase in prices of a number of freely priced fuel products. Electricity price increase since June 2012 also contributed to the pick-up in inflation in this segment. VI.12 Freely priced product prices moved in line with the changes in international prices, while administered fuel prices were not changed during June 2011- August 2012 (Chart VI.6). This has led to substantial build-up of underrecoveries to the tune of `856 billion during April-September 2012, with about 62 per cent of the under-recoveries coming from diesel.
VI.13 Against this background, in September 2012 the government revised diesel prices by `5 per litre (excluding VAT) and capped the supply of subsidised LPG cylinders (of 14.2 kg) to each consumer to six cylinders per annum. Although the revision could put upward pressures on fuel inflation in the coming months, it will help in price stability over the medium term through fiscal consolidation. VI.14 However, even after the recent revision in oil prices, pass-through, which remains incomplete, has impacted the subsidies and the fiscal deficit (for details, see Chapter II). Currently (effective October 16, 2012), the estimated under-recovery by domestic oil marketing companies (OMCs) is `9.8 per litre for diesel, `33.9 per litre for PDS kerosene and `468.5 per cylinder for subsidised domestic LPG.
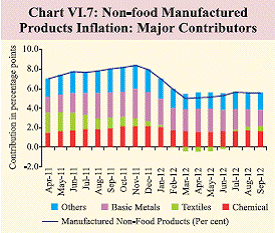
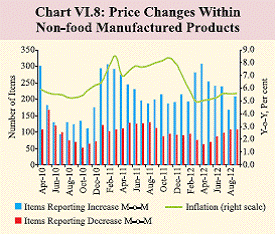
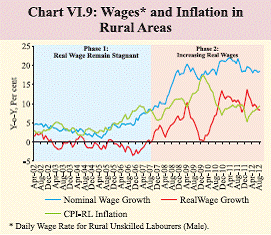
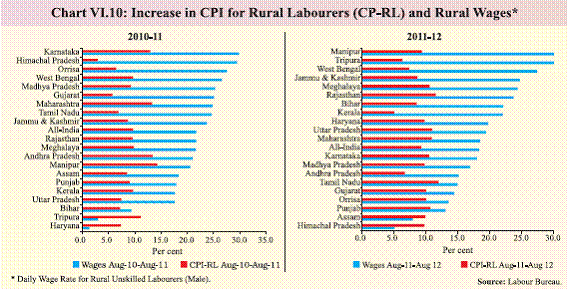
VI.15 Trends in global prices and exchange rates significantly impact domestic fuel prices, as more than 85 per cent of India’s oil consumption is met through imports. Global crude oil prices (Indian Basket), which averaged US$112 per barrel during 2011-12 declined by 4.3 per cent to US$107 per barrel during 2012- 13 (up to September). Though crude prices have moderated from the levels witnessed in March 2012, the depreciation of the rupee, partly offset the favourable impact (Table VI.2). VI.16 A stable rupee since the second half of September 2012 resulted in some moderation in the prices of freely priced fuel products in October 2012, as crude oil prices continued to remain range-bound. Pressure on fuel inflation could soften if crude prices remain range-bound and rupee maintain a strengthening bias. VI.17 The increase in electricity prices could further add to input cost pressures. The uncertainty regarding coal supply prospects following the de-allocations of many coal blocks by the government could also be a source of price pressures, if they are not compensated by imports. One positive impact of the revision in electricity prices is the improvement in the financial conditions of the State Electricity Boards (SEBs). With more grid power forthcoming as a result of financial improvement in the SEBs, there will be less dependence on genset power, thereby possibly reducing overall energy costs for producers. Generalised inflationary pressures persist VI.18 Non-food manufactured products inflation, the indicator of generalised inflationary pressures, remained above 5 per cent during 2011-12 so far (5.6 per cent in September 2012). The month-over-month seasonally adjusted annualised changes (3-month moving average) in WPI non-food manufacturing, though showed some moderation in the latest month, remain strong. VI.19 Within non-food manufactured products, the ‘basic metals and metals products’ and chemicals groups have been the major drivers of inflation (Chart VI.7). It is seen that the contribution of these product groups to inflation in non-food manufacturing has been significantly high compared to their weights. The recent pick-up in inflation in this segment has also been driven by the increase in the contribution of the textiles group, which had declined significantly and turned negative during the period of decline in non-food manufactured products inflation. Inflation in certain items contributes hugely to core inflation VI.20 The contribution of individual commodities to the increase in non-food manufactured products prices has also been asymmetric. A few items, most notably gold and ornaments, ammonium phosphate and grey cement, have been contributing disproportionately to the inflation in non-food manufactured products inflation. While assessing the generalised price pressures from the movements in non-food manufactured products index, such disproportionate influences need to be taken into account. Price adjustments have remained sticky downwards VI.21 Manufactured non-food products inflation has remained persistent during 2012-13 so far. The number of items showing a price increase significantly outnumbered the number of items showing a price decline during the period where non-food manufactured products inflation remained elevated. Such a trend amidst the economic slowdown reflects the rigidities in relative price adjustments, which could keep core inflation high even when demand pressures remain muted. However, the reported price changes within non-food manufactured products in recent months indicate that the number of items reporting price increases has declined, while the number of items reporting price decreases has increased. This has not translated into a decline in overall inflation, as large positive changes in a few discrete items drive the overall change (Chart VI.8) VI.22 Although the growth slowdown has been significant, the input cost pressures continued to remain persistent as seen from the HSBC Markit Purchasing Managers Index (PMI). Firms would be forced to pass on increase in input costs to output prices as the absorbing capacity has declined with significant decline in the profit margins of corporates. This could also translate to persistence of non-food manufactured products inflation even with growth slowdown. Wage pressures remain persistent and could constrain inflation moderation VI.23 A major factor in high food prices and overall inflation is increase in rural wages; both in nominal and real terms. However, indications are that the pace of increase in rural wages moderated from a peak of about 22 per cent (y-o-y) in August 2011 to about 18 per cent in August 2012. This, along with an increase in inflation in rural areas in recent months, led to a moderation in real wage growth to about 8 per cent in August 2012 from 11 per cent in August 2011(Chart VI.9). There is a large variation in inflation and wage growth in rural areas across the major states, pointing to the presence of state specific factors in conditioning the wage-price dynamics (Chart VI.10).
VI.24 It is observed that even in the organised sector, the growth in staff costs grew at the rate of about 17 per cent during 2011-12 indicating persistent pressure from wage costs. After some moderation in the preceding quarters, the growth in staff costs again picked up in the recent quarter (Table II.3).
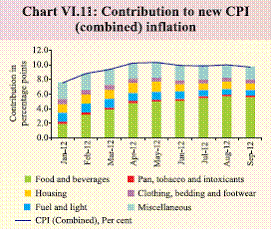
CPI inflation continues to be above WPI VI.25 Inflation, as per the all-India new Consumer Price Index (CPI-combined (rural+urban)) remained elevated, with inflation for September 2012 at 9.7 per cent. The new CPI shows some moderation in recent months when the food and fuel components are excluded (Table VI.3). However, new CPI inflation excluding food and fuel component continues to remain higher than the comparable component of WPI. The contribution of the food and beverage group to overall inflation has increased in recent months, albeit marginally declining in September 2012. This has kept the overall inflation high even with a decline in inflation in the core component (Chart VI.11). The contribution of fuel & power and miscellaneous items (which includes services) in CPI inflation has declined in recent months.
VI.26 Notably, significant divergences in inflation as measured by the WPI and the new CPI were observed in certain product groups such as condiments & spices, fruits & vegetables and clothing & bedding. A comparison of similar item groups under the two inflation measures indicates that except for fuel and power, CPI inflation is much higher than WPI inflation in most of the product groups. Differences in the weighting pattern, area coverage and coverage of markets could explain part of the divergence. This could also indicate that inflation is generally higher at the retail level than at the wholesale level, which could be due to factors such as higher transport and labour costs and rigidities within the supply chain.
Inflation path remains sticky; better supply response and enhancing productivity are critical for medium-term price stability. VI.27 Persistent inflation, even when growth has slowed significantly, has turned India into an outlier in a benign global inflation environment. From the supply side, high inflation in India reflects the lagged adjustments in prices of fuel as well as the role of structural factors. From the demand side, growth of real wages in excess of increase in productivity and high fiscal deficit have added to inflationary pressures. A sustained moderation in inflation, therefore, can be achieved through policy initiatives to address the structural constraints. Also there is a need to reduce unit labour costs by improving productivity levels in the economy so as to enable growth in real wages in a noninflationary manner. VI.28 Going forward, the deficient and uneven monsoon and spikes in global food prices have added to concerns on food inflation. The revision in administered prices of oil could add to nearterm price pressures, but could help improve the macroeconomic fundamentals. Although manufactured products inflation moderated during last quarter of 2011-12, it has remained sticky, as sustained input cost pressures, passthrough effects and significant wage pressures offset the impact of the slowdown in growth. Inflation could remain around the current level in the near term and any significant moderation in inflation is conditional on improvements in structural factors. The inflation path for the current year in the face of moderation in growth and the negative output gap continues to be a concern. |
|||||||||||||||||||||||||||||||||||||||||||||||||||||||||||||||||||||||||||||||||||||||||||||||||||||||||||||||||||||||||||||||||||||||||||||||||||||||||||||||||||||||||||||||||||||||||||||||||||||||||||||||||||||||||||||||||||||||||||||||||||||||||||||||||||||||||||||||||||||||||||||||||||||||||||||||||||||||||||
পেজের শেষ আপডেট করা তারিখ:


