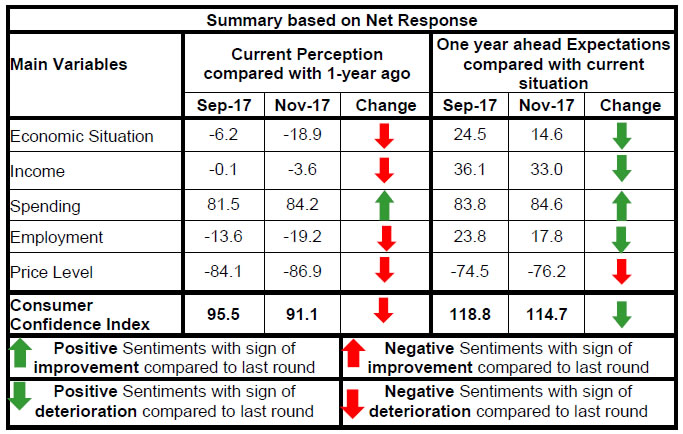
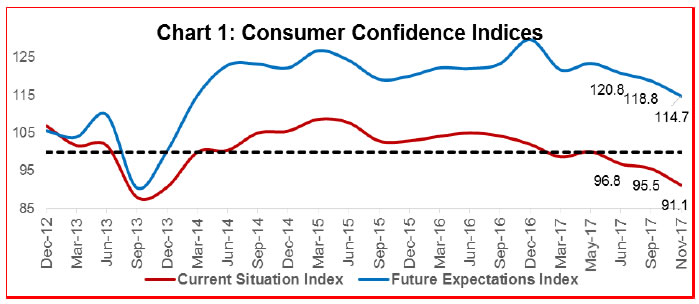
Today, the Reserve Bank released the results of the November 2017 round of the Consumer Confidence Survey (CCS)1. The survey was conducted in six metropolitan cities - Bengaluru; Chennai; Hyderabad; Kolkata; Mumbai; and New Delhi - and obtained 5,244 responses on households’ perceptions and expectations on the general economic situation, the employment scenario, the overall price situation and their own income and spending. Highlights: I. Consumer confidence on major economic parameters (viz., general economic situation, employment scenario, income and prices) moderated in the latest survey round. II. Both the current situation index (CSI)2 and the future expectations index (FEI) recorded a significant drop, mainly due to decline in optimism on the general economic situation and the employment scenario; CSI remained in the pessimistic zone for the fourth successive survey round (Chart 1). III. Households’ current perceptions on the general economic situation deteriorated further into the pessimistic zone for the fifth successive round; their one year ahead outlook was also tempered but it stayed in positive terrain (Table 1). IV. The employment situation continued to be a major concern of the respondents, with current sentiment plummeting further into the pessimistic zone and continued weakening of the outlook (Table 2). V. Respondents’ current assessment and outlook on the price situation and inflation continued to deteriorate (Table 3 and 4). VI. Sentiments on income dipped further into the pessimistic zone as an increased number of respondents perceived their income declining during the last one year; their outlook on income were also downbeat, underpinned by feeble sentiments on employment (Table 5). VII. An overwhelming majority of respondents reported higher expenditure despite subdued sentiments on income, which could be partly attributed to higher prices (Table 6). VIII. Both essential and non-essential spending picked up and are expected to remain at elevated levels over the next one year (Table 7 and 8). | Table 1: Perceptions and Expectations on General Economic Situation | | Survey Round | Current Perception | One year ahead Expectation | | Improved | Remained Same | Worsened | Net Response | Will improve | Will remain same | Will worsen | Net Response | | Jun-16 | 40.2 | 27.9 | 31.9 | 8.2 | 54.2 | 25.5 | 20.4 | 33.8 | | Sep-16 | 44.6 | 30.1 | 25.3 | 19.4 | 57.7 | 24.3 | 18.0 | 39.6 | | Nov-16 | 49.5 | 26.6 | 23.9 | 25.6 | 63.0 | 18.7 | 18.3 | 44.8 | | Dec-16 | 45.7 | 24.1 | 30.3 | 15.4 | 66.3 | 16.6 | 17.1 | 49.2 | | Mar-17 | 35.6 | 24.4 | 40.0 | -4.5 | 52.1 | 21.4 | 26.5 | 25.6 | | May-17 | 36.4 | 25.9 | 37.7 | -1.3 | 52.4 | 23.5 | 24.1 | 28.3 | | Jun-17 | 32.4 | 27.7 | 39.9 | -7.5 | 48.6 | 25.9 | 25.5 | 23.1 | | Sep-17 | 34.6 | 24.7 | 40.7 | -6.2 | 50.8 | 22.8 | 26.3 | 24.5 | | Nov-17 | 28.9 | 23.3 | 47.9 | -18.9 | 45.2 | 24.1 | 30.6 | 14.6 |
| Table 2: Perceptions and Expectations on Employment | | (Percentage responses) | | Survey Round | Current Perception | One year ahead Expectation | | Improved | Remained Same | Worsened | Net Response | Will improve | Will remain same | Will worsen | Net Response | | June-16 | 35.6 | 28.7 | 35.7 | -0.2 | 51.1 | 29.6 | 19.3 | 31.8 | | Sept-16 | 31.7 | 36.4 | 31.9 | -0.2 | 50.5 | 30.5 | 19.0 | 31.5 | | Nov-16 | 37.6 | 30.9 | 31.4 | 6.2 | 55.7 | 26.6 | 17.7 | 37.9 | | Dec-16 | 31.0 | 29.8 | 39.2 | -8.3 | 57.3 | 24.1 | 18.6 | 38.7 | | Mar-17 | 32.6 | 28.4 | 39.0 | -6.4 | 52.8 | 24.5 | 22.7 | 30.1 | | May-17 | 32.5 | 28.3 | 39.2 | -6.8 | 52.7 | 26.7 | 20.7 | 32.0 | | Jun-17 | 30.8 | 30.3 | 38.9 | -8.1 | 49.6 | 29.3 | 21.2 | 28.4 | | Sep-17 | 30.1 | 26.3 | 43.7 | -13.6 | 49.9 | 24.0 | 26.1 | 23.8 | | Nov-17 | 27.5 | 25.7 | 46.8 | -19.2 | 45.1 | 27.5 | 27.4 | 17.8 |
| Table 3: Perceptions and Expectations on Price Level | | (Percentage responses) | | Survey Round | Current Perception | One year ahead Expectation | | Increased | Remained same | Decreased | Net Response | Will increase | Will remain same | Will decrease | Net Response | | Jun-16 | 78.1 | 12.5 | 9.4 | -68.7 | 80.5 | 11.5 | 8.0 | -72.6 | | Sep-16 | 78.2 | 17.2 | 4.6 | -73.6 | 77.8 | 15.4 | 6.9 | -70.9 | | Nov-16 | 82.2 | 14.3 | 3.6 | -78.6 | 82.9 | 11.9 | 5.2 | -77.7 | | Dec-16 | 73.9 | 18.3 | 7.7 | -66.2 | 69.5 | 16.0 | 14.5 | -55.0 | | Mar-17 | 85.8 | 9.1 | 5.1 | -80.7 | 81.0 | 10.4 | 8.6 | -72.4 | | May-17 | 83.3 | 11.3 | 5.4 | -78.0 | 79.7 | 11.5 | 8.8 | -70.9 | | Jun-17 | 85.2 | 11.4 | 3.4 | -81.8 | 76.1 | 13.8 | 10.1 | -66.0 | | Sep-17 | 87.7 | 8.7 | 3.6 | -84.1 | 81.0 | 12.5 | 6.5 | -74.5 | | Nov-17 | 89.9 | 7.1 | 3.0 | -86.9 | 82.9 | 10.4 | 6.7 | -76.2 |
| Table 4: Perceptions and Expectations on Rate of Change in Price Level (Inflation)* | | (Percentage responses) | | Survey Round | Current Perception | One year ahead Expectation | | Increased | Remained same | Decreased | Net Response | Will increase | Will remain same | Will decrease | Net Response | | June-16 | 85.3 | 12.4 | 2.3 | -83.0 | 83.3 | 13.0 | 3.7 | -79.6 | | Sept-16 | 61.8 | 22.4 | 15.8 | -45.9 | 64.3 | 22.4 | 13.3 | -51.0 | | Nov-16 | 64.5 | 18.2 | 17.3 | -47.2 | 66.8 | 18.6 | 14.6 | -52.1 | | Dec-16 | 57.8 | 18.0 | 24.2 | -33.5 | 62.4 | 17.1 | 20.6 | -41.8 | | Mar-17 | 80.5 | 12.5 | 7.0 | -73.5 | 79.9 | 13.8 | 6.3 | -73.6 | | May-17 | 82.0 | 10.0 | 8.0 | -74.0 | 82.6 | 10.9 | 6.5 | -76.1 | | Jun-17 | 79.9 | 11.5 | 8.5 | -71.4 | 78.7 | 13.5 | 7.9 | -70.8 | | Sep-17 | 80.6 | 10.4 | 9.0 | -71.5 | 78.6 | 14.1 | 7.2 | -71.4 | | Nov-17 | 82.9 | 9.0 | 8.1 | -74.8 | 80.4 | 12.1 | 7.5 | -72.9 | | *Applicable only for those respondents who felt price has increased/price will increase. |
| Table 5: Perceptions and Expectations on Income | | (Percentage responses) | | Survey Round | Current Perception | One year ahead Expectation | | Increased | Remained same | Decreased | Net Response | Will increase | Will remain same | Will decrease | Net Response | | Jun-16 | 29.9 | 51.8 | 18.4 | 11.5 | 51.2 | 39.9 | 8.9 | 42.3 | | Sep-16 | 31.2 | 48.6 | 20.2 | 11.1 | 52.3 | 36.4 | 11.3 | 41.1 | | Nov-16 | 37.3 | 45.5 | 17.2 | 20.1 | 57.1 | 33.4 | 9.4 | 47.7 | | Dec-16 | 27.1 | 47.1 | 25.8 | 1.3 | 54.8 | 33.5 | 11.7 | 43.1 | | Mar-17 | 27.7 | 47.3 | 25.0 | 2.7 | 51.8 | 36.5 | 11.7 | 40.1 | | May-17 | 28.2 | 48.0 | 23.8 | 4.4 | 52.8 | 38.1 | 9.1 | 43.6 | | Jun-17 | 23.8 | 53.8 | 22.4 | 1.4 | 47.1 | 43.5 | 9.4 | 37.7 | | Sep-17 | 26.6 | 46.8 | 26.6 | -0.1 | 48.5 | 39.0 | 12.5 | 36.1 | | Nov-17 | 24.4 | 47.6 | 28.0 | -3.6 | 45.6 | 41.8 | 12.6 | 33.0 |
| Table 6: Perceptions and Expectations on Spending | | (Percentage responses) | | Survey Round | Current Perception | One year ahead Expectation | | Increased | Remained same | Decreased | Net Response | Will increase | Will remain same | Will decrease | Net Response | | Jun-16 | 82.7 | 8.4 | 8.8 | 73.9 | 82.2 | 10.2 | 7.6 | 74.6 | | Sep-16 | 70.3 | 24.1 | 5.7 | 64.6 | 79.1 | 17.0 | 3.9 | 75.2 | | Nov-16 | 73.2 | 23.6 | 3.2 | 70.0 | 77.3 | 20.3 | 2.5 | 74.8 | | Dec-16 | 73.5 | 20.8 | 5.6 | 67.9 | 78.3 | 15.8 | 5.9 | 72.4 | | Mar-17 | 84.4 | 13.4 | 2.1 | 82.3 | 88.5 | 8.3 | 3.1 | 85.4 | | May-17 | 83.4 | 14.9 | 1.6 | 81.8 | 86.0 | 11.9 | 2.0 | 84.0 | | Jun-17 | 81.3 | 17.2 | 1.5 | 79.8 | 83.5 | 13.7 | 2.8 | 80.7 | | Sep-17 | 83.2 | 15.0 | 1.8 | 81.5 | 85.8 | 12.3 | 2.0 | 83.8 | | Nov-17 | 85.6 | 13.1 | 1.3 | 84.2 | 86.8 | 11.0 | 2.3 | 84.6 |
| Table 7: Perceptions and Expectations on Spending- Essential Items | | (Percentage responses) | | Survey Round | Current Perception | One year ahead Expectation | | Increased | Remained same | Decreased | Net Response | Will increase | Will remain same | Will decrease | Net Response | | Jun-16 | 83.0 | 8.2 | 8.8 | 74.3 | 81.1 | 10.6 | 8.3 | 72.8 | | Sep-16 | 79.1 | 16.9 | 4.0 | 75.1 | 82.5 | 12.7 | 4.8 | 77.6 | | Nov-16 | 81.7 | 15.2 | 3.1 | 78.6 | 85.1 | 10.9 | 4.0 | 81.1 | | Dec-16 | 76.9 | 18.4 | 4.7 | 72.2 | 77.5 | 14.9 | 7.7 | 69.8 | | Mar-17 | 85.8 | 11.1 | 3.1 | 82.7 | 87.0 | 9.2 | 3.8 | 83.2 | | May-17 | 85.7 | 11.6 | 2.8 | 82.9 | 86.9 | 9.6 | 3.5 | 83.4 | | Jun-17 | 82.2 | 15.3 | 2.5 | 79.7 | 81.9 | 13.5 | 4.6 | 77.2 | | Sep-17 | 85.0 | 12.6 | 2.4 | 82.6 | 86.1 | 10.9 | 3.0 | 83.1 | | Nov-17 | 86.8 | 11.3 | 1.9 | 85.0 | 86.2 | 10.7 | 3.2 | 83.0 |
| Table 8: Perceptions and Expectations on Spending- Non-Essential Items | | (Percentage responses) | | Survey Round | Current Perception | One year ahead Expectation | | Increased | Remained same | Decreased | Net Response | Will increase | Will remain same | Will decrease | Net Response | | Jun-16 | 43.9 | 32.3 | 23.8 | 20.1 | 51.2 | 30.3 | 18.5 | 32.7 | | Sep-16 | 50.2 | 37.6 | 12.2 | 38.0 | 60.6 | 29.5 | 9.9 | 50.7 | | Nov-16 | 52.2 | 36.8 | 11.1 | 41.1 | 62.7 | 27.6 | 9.7 | 53.0 | | Dec-16 | 37.3 | 44.7 | 18.1 | 19.2 | 49.6 | 35.8 | 14.7 | 34.9 | | Mar-17 | 48.9 | 36.4 | 14.7 | 34.2 | 57.8 | 30.3 | 11.8 | 46.0 | | May-17 | 51.9 | 34.6 | 13.5 | 38.3 | 59.9 | 31.1 | 9.0 | 50.9 | | Jun-17 | 51.6 | 35.5 | 13.0 | 38.6 | 56.3 | 32.6 | 11.1 | 45.2 | | Sep-17 | 54.0 | 34.4 | 11.7 | 42.4 | 60.2 | 30.6 | 9.2 | 50.9 | | Nov-17 | 56.5 | 32.5 | 11.0 | 45.5 | 60.6 | 31.1 | 8.3 | 52.3 |
|  IST,
IST,