Annexures |
| |
Annexure I |
| |
Methodology for Analysis of Financial Performance of SRTC’s
The financial performance of any organisation is closely linked to its physical performance which, in turn, depends on the efficiency of operations and policy related variables. In this section, the methodology for analysing the financial performance of SRTC’s based on physical performance and related policy variables is spelt out. The same methodology was adopted for projections relating to financial performance in terms of Profits/ Losses for the period 2000 - 2005. The relationships used in the methodology are given below.
FU ( %)= [(Number of buses on road) / (Number of buses in fleet)] * 100 (VU - Kms) = ( Total Effective Km. operated on a day) / (Total buses on road an average day)
(LF)(%) =[( Passenger Kilometres ) / (Capacity Kilometres) ]* 100
Dead Kilometrage (%) =[( Dead Kilometres ) / (Total Effective Km)]*100
Average Wage per employee (Rs.) = Personnel Cost / (Staff Strength)
Average fare (paise) = Traffic Revenue/ (Passenger Kilometres)
Staff Bus ratio (S/B) = Staff Strength /(Number of buses held)
Buses on Road = Average buses held * Fleet Utilisation
Effective Kilometres = Buses on road * Vehicle-Utilisation rate.
Gross Kilometres = Effective- Kilometres + Dead Kilometres.
Diesel Consumption = Gross- Kilometres/KMPL
Traffic Revenue = Average- fare *( Capacity* Effective-Kms* Load-Factor)
Total Revenue = Traffic-Revenue + Non-Traffic-Revenue
Personnel Costs = Buses held* (S/B)* (Average Wage/Employee)
Diesel Cost = Price of Diesel* Diesel Consumption.
Passenger tax rate = Passenger tax/Traffic Revenue
Break- even fare = Total cost/Passenger-Kilometres.
Passenger Kilometres = Load factor* Capacity* Effective Kilometres.
Other Material Cost rate = Other Material costs/ Traffic Revenue. |
| |
Physical productivity measures as reflected through Fleet utilisation (FU), Vehicle Utilisation (VU), Fuel Efficiency (KMPL) and Staff / Bus ratio (S/B) are the major supply -level parameters while Load factor (LF) is a significant demand variable. The average fare charged is taken to be a policy variable since it is almost always fixed exogeneously.
The model provides for a disaggregate look at the costs in terms of fixed and variable costs. The Fixed cost components are the interest and depreciation provisions. The variable cost components include wages, diesel costs, other material costs and passenger taxes. Wherever motor vehicle tax and passenger taxes are compounded (as in Andhra Pradesh, for example) and are a function of total revenue, the compounded tax is included as part of the variable cost. The model provides variable cost and fixed cost per Effective (bus) Kilometre.
As far as projections are concerned, fleet expansion, wage increases, interest and depreciation provisions are assumed on the basis of past trends. Tax levels are assumed to remain at 1997-98 levels. Diesel costs, which form a significant part of the total costs, are computed on the basis of recent and expected revision of the price of fuel.
Given below is the format of the model specified the way it is in MS Excel. The model provides the estimation of base year relationships and resultant estimates, which tally exceptionally well with actual figures for the base year (in this case, for Gujarat State Road Transport Corporation for the year 1997-98). Given these relationships estimates based on higher performance levels (in terms of physical parameters- optimal) were worked out to find the impact of such changes on financial performance. The projection exercise incorporates these levels of performance on a gradual basis over the forecast period 2000-05. This is necessary to provide the SRTC’s with time to bring about changes to achieve higher efficiency levels. Past performance- achievements or otherwise, comparable situations in other States, the need to provide for an emerging private sector role in road passenger transport, have influenced fixation of optimal levels of performance. |
| |
Format of the Model |
Base Year Figures |
Actuals |
|
Estimates |
Actuals |
REVENUES |
Estimates |
Actuals |
Buses Held |
8990 |
Buses on Road |
7911.2 |
7907 |
Traffic Rev. (Rs. lakhs) |
82714.65176 |
82714 |
Fleet Utilisn. (%) |
88 |
Effective (Bus)Kms. |
9959.291 |
9954.93 |
Tr.Rev/bus km(paise) |
830.527511 |
830.8848 |
Vehicle Utilisn.(KMs.) |
344.9 |
Dead Kms. |
95.671893 |
95.63 |
Ntraff. Rev. (Rs.lakhs) |
|
3494 |
KMPL |
5.01 |
Gross Kms. |
10054.963 |
10050.56 |
Total Rev. (Rs.lakhs) |
86208.65176 |
86208 |
Load Factor (%) |
59.51 |
Diesel Consmn. |
200697.86 |
200783 |
Tot.Rev/ buskm(pse) |
865.6103296 |
865.983 |
Dead Km.(%) |
0.96063 |
Pass.Kms. |
397093.86 |
397533 |
COSTS |
|
|
Av.Fare (Rs.) b.yr.est |
0.208068 |
|
|
|
Pers.Cost (Rs.lakh) |
45705 |
45705 |
Diesel Rate (Rs.) |
10.5 |
|
|
|
Diesel Cost (Rs.lakh) |
21073.27555 |
21005.57 |
Diesel Wkshp. |
|
|
|
|
Ot.Mat.Cost (Rs.lakh) |
9744.266856 |
9740 |
Capacity |
67 |
|
|
|
Pass.Tax (Rs.lakh) |
12934.10192 |
12934 |
Av.Wage/ emp(Rs.) |
78872.44 |
|
|
|
Misc.Taxes (Rs.lakh) |
64.42 |
64.42 |
Staff Strength |
57948 |
|
|
|
Misc. (Rs.lakhs) |
9714 |
9714 |
St.Govt. Cont.Rs.cr) |
140.2 |
|
|
|
Tot.Var. Cost (Rs.lakh) |
99235.06432 |
99162.99 |
Cent.Gov Cont(Rs.cr). |
61.07 |
Pass.Tax Rate |
15.637014 |
|
Interest (Rs.lakhs) |
3214 |
3214 |
Av.fare(paise) (used) |
20.83 |
Oth.Mat. Rate |
11.775516 |
|
Depr.(Rs. lakhs) |
4033.32 |
4033.32 |
Staff/Bus Ratio |
6.445829 |
MV tax per bus |
5616.129 |
|
MV Tax (Rs.lakhs) |
504.89 |
504.89 |
|
|
|
|
|
O.Taxbuses (Rs.lakh) |
362.57 |
362.57 |
|
|
O.Malcost/ bkm(Rs.) |
0.9784097 |
|
ToT.Fix.Cost (Rs.lakh) |
8114.78 |
8114.78 |
|
|
(Base Yr) |
|
|
Total Costs (Rs.lakhs) |
107349.8443 |
107277.8 |
|
|
V.Cost/ bkm(paise) |
996.40691 |
996.1194 |
|
|
|
|
|
F.Cost/ bkm(paise) |
81.479495 |
81.51519 |
Var.cost/ Tot.Cost(%) |
92.44080879 |
92.43573 |
|
|
T.Cost/ bkm(paise) |
1077.8864 |
1077.635 |
Fix.Cost/ Tot.cost(%) |
7.559191214 |
7.56427 |
|
|
Pr/lo onTr. Rev(rslakh) |
-24635.19 |
-24563.8 |
|
|
|
|
|
Pr/loonTot Rev(rslakh) |
-21141.19 |
-21069.8 |
|
|
|
|
|
P/lon Trrev/ bkm(pse) |
-247.3589 |
-246.75 |
|
|
|
|
|
P/lonTorev/ bkm(pse) |
-212.2761 |
-211.652 |
|
|
|
|
|
Breakevenfare (paise)(or cost/ pass.km) |
0.2703387 |
0.269859 |
|
|
|
|
| |
Annexure II |
| |
The International Experience With Privatisation of Transport Infrastructure and Services
Several useful lessons emanate from an examination of transport privatisation experience across the world. Here, the focus of the examination would be the mode-wise experience in different countries. We begin with the urban transit system.
Urban Bus Transit
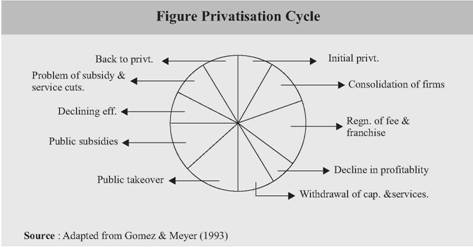
Privatisation relating to this public transport mode has been always nearly of the third variety. For quite some time, the basic form of ownership of bus systems has been a public authority in many countries. Where bus companies have been privately held, extensive regulation has been a characteristic feature. But in both cases, subsidies to keep fares low or services more extensive have been prominent. However, according to Gomez and Meyer (1993), the private sector had been largely responsible for urban bus services before the advent of the public authority. But over a period of time the process of provision has involved the public sector in a minor way to begin with which was then followed by a gradual and complete take over by the government in many countries. But the cycle seems to have been further extended to include the involvement of private sector once again following what is popularly termed as ‘ government failure’. The different stages in the cycle can be observed from Figure given below.
This system of urban bus system development and decay has been as common in the industrialised countries as in the developing world.
In the U.K., the urban bus transit industry was privatised and deregulated while still preserving, through competition contracting, the possibility of subsidising’ socially worthwhile’ but unprofitable services. A key issue in the process was whether the market would prove to be competitive. It is widely recognised that actual competition may not be |
| |
|
| |
essential if markets are contestable. Given the fact of entry in the network of almost every county and effective measures at reduction of costs, the threat of entry has been seen to be credible. Gomez and Meyer (1993) observe that the clearest winners from the combined package of deregulation, privatisation and subsidy cuts are the British taxpayers who saw government expenditures in metropolitan counties cut by almost a quarter in real terms. Thus, it may be reasonable to say that the privatisation of much of the UK bus transit industry has clearly demonstrated that significant cost savings can be achieved by a combination of private ownership and competition. But it must be noted that it is competition for the market (via franchising/contracting) rather than competition in the market that appears to be the primary cause of increased cost efficiency among bus operators.
The most common form of private involvement in the US urban bus transit system in recent decades has been the system of contracting with private companies. But such a system has also involved considerable subsidy payments. The key difficulty to achieving higher levels of commercialisation in the U.S. is the relatively low demand for public transport as a result of which the fare box recovery ratios averaged less than 40 percent.
In many developing countries, the most common scheme for providing urban bus services has been a mixed system of publicly and privately provided services. But this mixed system has often emerged in response to the inadequate services provided by the state -owned, deficit ridden companies and has most often operated within a framework of fare regulation. Such a process has enabled a reduction in subsidies (if not total elimination) while still maintaining or expanding services largely because the costs of private companies are often much lower than their public counterparts. This has been found to true in cities like Jakarta, Accra, Calcutta and Bangalore. In the absence of fare regulation, the experience has not been as successful as in the case of Colombo, Santiago, etc. In Colombo, the role of public sector agency in providing effective competition was significant but it must be noted that the public operator continued to receive subsidies, which were not available to the private operator. In Santiago, the competitive market eventually evolved into a system of anti competitive controls of the route associations, which resulted in steep fare increases.
The striking feature of the bus transit systems in major urban areas of the developing world is the enormous number of private operators especially where the local government has not severely restricted entry. Moreover, this has involved extensive innovation and experimentation which has made the experience with urban bus privatization fascinating while at the same time giving rise to concern. The use of smaller vehicles suited the existing network of narrow roads but also gave rise to congestion and greater pollution. Moreover, unrestricted entry of many operators was the source of several other problems as in Delhi (Ramasamy, 1996). Although the original intention of introducing private buses was to supplement public sector efforts, the private operators were allowed to cut into the revenues of the public sector operator by operating unauthorisedly on profitable routes. Moreover, the inability to effectively deal with a large number especially in matters relating to safety regulations ultimately got reflected in the high accident rates on Delhi roads. |
| |
Privatisation of Highways
Highway privatisation experiments which have been primarily motivated by the need to find alternative (additional) sources of financing for needed new investments have been far more limited.
Though private tolled roads were fairly common in the U.S. in the 19th century, in the modern era. France and Spain have been the pioneers since the sixties when the private sector was encouraged to build an intercity highway network based on tolls. The French experience at least initially, suggested that private companies could build and operate roads more cheaply than public companies. Moreover, toll financing appeared to have improved the quality of investment decisions in both countries. The French experience also pointed out that benefits from toll roads could be enhanced by the adoption of coherent program designed to produce an integrated toll road network. Such a network allowed exploitation of economies of scale in operation and finance: spreading of risks across a portfolio of roads in different location and at varying stages in their life cycle and cross subsidisation between roads. By reducing investment risk, a network lowers finance costs and can significantly cut overall costs. However, over a period of time, the provision of incentives by way of low equity requirements, loan guarantees, foreign exchange insurance resulted in a situation where private parties were more interested in building than operating a toll road. These problems have been less serious in Spain than in France perhaps because government assistance/ support terms in Spain were less generous with the result that only 3 of the 8 major private companies granted concessions in Spain were taken over by the state while in France 3 of the four private companies went into government hands. |
| |
The Latin American experience is more recent. When Argentina began commissioning its major roads in 1990, it had a mature, well-connected, but poorly maintained network. The objective of road reforms were reconstruction and maintenance of existing roads. The general strategy was to unbundle viable roads into BOT concessions awarded through competitive bidding. In return for the right to collect tolls, the concessionaires were required to undertake a program of maintenance, rehabilitation and capacity improvements in order to achieve specified service levels. To begin with government provided no guarantees to concessionaires. But later, due to renegotiations arising due to indexation of tolls, tolls were drastically reduced and subsidies had to be provided. On the other hand, the Mexican private toll road programme virtually doubled the toll road network. The investment for this programme was sourced from local commercial banks, concessional equity, federal and state grants and equity contribution. By1995, a significant number of the planned toll roads had been built. But a combination of macroeconomic and project level factors (which turned all investment costs and operating revenues awry) led to an unsustainable set of operating conditions for these limited resource financing plans. As in the case of France and Spain, the project award criteria limited the pool of potential candidates to a handful of local construction companies that were more interested in the construction work than in the long -term viability of the project. Further, tolls were supposed to have been set high with a view to keep the concession short. This led to serious under utilisation of some roads. Some segments were unprofitable met only because of low traffic but because of strong competition from untolled alternatives. But an interesting aspect of Mexico’s aggressive private road programme, according to Gomez & Meyer (1993) was the way it has forced the Mexican capital markets to device new financial instruments to tap additional sources of funds. The commercial banks (mostly nationalised) have broadened the pool of domestic investors involved in toll roads. To begin with, most banks financed their share of commercial loans, drawing on existing savings. Later, their contributions were refinanced by issuing medium- term infrastructure bonds which were guaranteed by the bank since toll revenues were not adequate (especially during the initial stages operation of the road) to serve as security to back these bonds. Some banks even ventured to sell certificates of participation, which were secured only by a claim against toll revenues. But it was also the case that when many projects became increasingly unable to meet their debt service obligations, many banks that had underwritten huge amounts (of non- recourse finance)- such a behaviour being guided by an implicit understanding that even if the projects proved commercially non viable, ultimate recourse was indeed to the government for these projects were unable to refinance these amounts. “Whatever the diagnosis for the poor performance of the sector, from a private investment perspective, the impact was to shut off capital flows to the sector and to add to the Mexican banking system’s non performing loan portfolio” (Ruster, 1997, p.117). |
| |
The Asian experiment with privatisation of highways began in the mid-eighties in Malaysia and Thailand. The Malaysian decision to go in for private finance was preceded by a decade of activity aimed at building the North-South expressway. In the absence of an effective planning and finance strategy that was required to be taken by the public highway authority (which was created in 1980 to finance the road with govt guaranteed loans from the private capital market), costs proved higher and construction of the facility much shower than expected which resulted in the bankruptcy of the authority. In the face of rejection of a loan request by the World Bank, the government decided to privatise the road in order to compete it. Traffic flows were guaranteed and some of foreign exchange and interest rates risks were to be borne by the government Even on these terms, the private sector companies found it difficult to raise the required finances (on foreign or domestic capital markets). However, with the entry of new private party, the availability of land from the Government for the purpose of operation & maintenance of the express way and financial support by way of a soft loan from the govt, the new concessionaires was able to complete the projects for operation in 1994. Observers have criticised the expressway for two reasons. One relates to the lack of transparency in awarding the concession. Some bids were more competitive than the firm that got the concession. Further, inappropriate sequencing of the stages of construction was followed: low- traffic segments were taken up first while heavily trafficked stretches were completed at the end of project (Naidu, 1997). As the World Bank had suggested - the highway may have been so over designed and planned so as to be financially risky even with heavy government support. |
| |
The Thai experiment has been limited to urban tollways ( which are most difficult to undertake due to very high traffic flows in urban areas) around Bangkok. In this case, a good part of the equity came from private sources with the remaining coming from Thai banks. Most of the debt was raised in Thai domestic capital market with a portion of it guaranteed by international banks. However, govt assurances on tolls and land acquisition were critical to the agreement.
The Indonesian programme of toll roads was essentially undertaken by the public sector (as in the United States where private sector activity in toll roads began only in past decade). The Indonesian highway construction was initially charged with financing, constructing, operating and maintaining toll roads all over the state country. But by the 1980’s joint ventures schemes in which construction costs were financed by private equity and debt were in place. While, the governments support was initially limited to compensation for land acquisition, in a variety of forms, which included virtually all the debt supplied by the national government development banks. Thus, even the limited attempt at attracting private capital involved significant Govt,. Support.
Attempts made in Eastern Europe to involve the private sector (BOT) have not quite taken off. The issue that has been raised is: whether BOTs reduce claims on government. Blackshaw et. al. (1994) have shown ( with the help of hypothetical but not representative example) that for non -urban motorways ( toll roads ) in the countries, there is a distinct likelihood that, compared with the alternation of a public sector toll road, BOTs will not reduce the net call on the government budget even during the first ten years of the projects. They conclude that a public toll road authority seems a much better option than a BOT since under the then prevailing circumstances, a public authority enabled private finance to be tapped via bond markets probably on better terms (lower interest rates and longer maturities) than the commercial loans used by a BOT. |
| |
Railways:
Argentina privatised many of its railway services by a series of concession contracts during the early 1990s. The strategy was to break up the network into monopoly franchises that combine track and services operations- identifying the profitable and unprofitable segments in the freight and passenger traffic markets, awarding concession to the private sector through competitive bidding. The single - operator strategy meant that competition would not arise from several operators using the same track but several potential operators bidding for the exclusive right to provide a service during the life of concession. Within about three years of award of concessions, commuters railway concession showed a very healthy trend while freight and inter city passenger services were not as fortunate. But one objective of privatisation which was minimisation or elimination of fiscal drain from the railway deficits was achieved to some extent by reducing subsidies to the minimum possible level and which was confined to the commuter network. But this was made possible by inducing the private sector to take over profitable segments of the freight market and also in exchange for the lowest minimum subsidy, the commuter railway lines. A good number of the inter-city passenger seems were taken over by the provinces which agreed to subsidise them and run these services over the network concessioned to the freight and commuter rail operators, paying a fee to the operators for access and use of the track.
The U.K programme has been different. Legislation in the form of the Railways Act 1993 was introduced to provide the statutory framework for
privatisation and liberalisation of the railways in Great Britain. Almost all of the rail industry has been transferred to the private sector including 100% of passenger services. Under the new industry structure, British Rail’s track and infrastructure has moved to the private sector and is the responsibility of Rail Track. Passenger services are managed and operated by the private sector through a franchising system and a Rail Regulator has been set up to oversee the industry and ensure no party abuses any access rights to infrastructure. Train operating companies, both passengers and freight, gain access to the rail network through commercial access agreements with the Rail Track. Infrastructure charges for franchised passenger operators are essentially determined through the award of the franchise. The public interest will continue to be protected by the Rail Regulator and through Rail Track’s network license and other statutory provisions. Recognising the need to maintain certain unprofitable services-or socially necessary services - the franchising system has been designed to ensure that private operators who operate services which are loss making, can be compensated. The govt pays compensation payments for rail services via the Franchising Director. According to a note circulated (ECMT, 1998), it is difficult to assess the results as the railways had only then been recently restructured and privatised. But early indications showed that they are favorable. The organisation, Rail Track, has been able to fully exploit the potential of the rail network, to deliver improvements to operators and hence to rail users. One issue that has remained open is the one relating to coordination between potential investments required by way of investments and the amounts that are forthcoming. In the case of the U.K, the office of the Rail Regulator is expected to expected to exert pressure on Rail Track to make investments and the Office of Passenger Rail Franchising could shape franchises to encourage investments. |
| |
The Japanese government decided to privatise the Japanese National Railways in 1987, breaking the monopoly into six regional companies and one freight company. Two factors hastened the collapse of the public sector monopoly: emergence and proliferation of private vehicles during the 1960s and pressures during the 1970s, which forced the govt to freeze, rail tariffs. In an extensive study of this experience, Fukui (1992) provided some lessons especially for developing countries. One related to huge debt (25 trillion Yen) that the JNR Settlement Corporation inherited but which had not diminished significantly. The companies managing the railways systems in the islands have not been as viable as the one in the mainland as a result of which they are not in a position to became financially independent. Moreover, such a performance meant that raising capital in the market would not be easy. But in general, it could be shown that the breakup was more successful than envisaged. There has been an increasing demand for railway services, which can be, attributed partly due to economic expansion in the late 80’s and partly due to the constancy of rail tariffs. According to Namibu (1997), perhaps most crucial to the services (however limited) was the smooth relationship between the labour union and the railways. |
| |
Seaports
Seaports reforms in Argentina have sought to deregulate, decentralise and privatise. These reforms have attempted to introduce competition not only among ports but also for the ports- by inviting operators to bid for port concessions and within ports by dividing large ports into terminals and offering each as a separate concession. Bidders were asked to set their own charges subject to maximum price cap for cargo and concessions were awarded on the basis of highest rental offered for infrastructure and equipment. The results have been generally positive with increased productivity, higher cargo volumes and big reduction in tariffs.
Colombia has had a similar experience. Since privatisation in the early 1990,s, tariffs have fallen substantially and the quality of port services has improved significantly with productivity rises of 60%(or more) and detention times cut by more than half. It must be noted that interventions continue and temporary price caps and floors have been assigned to prevent competition from the undermining the position of the highest cost port.
However, the approach here has aimed at attracting project financing for new facilities leaving existing assets in state hands. This is similar to the model adopted by Asian countries. While this approach has been useful in attracting substantial private capital, it has made the whole process more complex and potentially less sustainable because of the lack of clarity surrounding the private and public roles in regulation operation and investment. More recently the country has moved towards privatising assets - a move which is felt could provide a more enduring basis for reform. |
| |
In Malaysia, the guidelines on privatisation issued in 1985 identified the provision of port services as an important area for private participation. This strategy has so far been confined to federal government ports. To begin with, a container terminal in the biggest port was privatised with the terminals moveable assets sold to a private party KCT, while the immoveable assets were leased to the same party. The rest of the facilities at the port were privatised in 1992 to another party, which also developed the container terminal that competes with KCTs terminal. Higher productivity has been reported after privatisation. The process of privatisation of other federal ports is on with the corporatisation of the ports taking places - as a first step towards complete private takeovers. This process may not be sustained due to over provision, which characterises the Malaysian port scene. The basic problem is excessive number of ports that has spread the cargo to thinly among them. This has serious implications for further private sector involvement in the port sector. |
 IST,
IST,