4.1
Overview of Municipal Finances
This chapter presents an overview
of municipal finances in India. The first section analyses the pattern and trends
in municipal finances using all-India fiscal aggregates obtained from secondary
sources3 to provide a macro picture across the country . The second, third and
fourth sections provide indepth analysis of the structure of municipal finances
of select 35 Municipal Corporations (MCs). The analysis is based on data gathered
from the budget documents of these selected MCs, covering the period 1999-2000
to 2003-2004.
4.2 Size of the Municipal Sector
As per the Report of the Twelfth Finance Commission, India has 3,723 ULBs, of
which 109 are MCs, 1432 are municipalities and 2182 are Nagar Panchayats.
The total revenue of the municipalities grew from Rs.11,515 crore in 1998-99
to Rs.15,149 crore in 2001-02 at a compounded average growth rate (CAGR) of 9.6
per cent. The total expenditure increased from Rs 12,035 crore to Rs 15,914 crore
during the same period, registering a CAGR of 9.8 per cent. In spite of the growth
of the municipal sector in the country, it accounts for a very small proportion
of both Gross Domestic Product (GDP) (at current prices) as well as revenue and
expenditure of the upper tiers of Government.
Total revenue of the municipal
sector accounts for about 0.75 per cent of GDP of the country. In contrast, the
ratio is 4.5% for Poland, 5% for Brazil and 6% for South Africa [Buckley (2005)].
Similiarly, municipal revenue forms a little more than 2 per cent of
Table
13: Revenue Significance of Municipal Sector | Year | Municipal | Percentage | Relative
share of Municipal Revenue | | Revenue | of
GDP at | | (as
per cent of Total Revenue of) | | (Rs.
Crore) | Factor
Cost | State
Govt. | Central
Govt. | Combined
State &
Central Govt. | 1998-99 | 11,515 | 0.72 | 4.4 | 4.1 | 2.5 |
1999-00 | 13,173 | 0.75 | 4.2 | 4.4 | 2.5 |
2000-01 | 14,581 | 0.77 | 4.2 | 4.5 | 2.4 |
2001-02 | 15,149 | 0.73 | 4.1 | 4.2 | 2.3 |
Source : (i)
Reports of Eleventh and Twelfth Finance Commission, (ii) Economic Survey, GoI
2004-05. | combined revenue of
State and Central Governments. Total revenue of ULBs has been growing at a lower
rate (9.7 per cent during 1998-99 to 2001-02) than the growth of combined revenue
of Central and State Governments (10.8 per cent during 1998-99 to 2001-02). This
reflected in a marginal decline in the share of municipal revenue in total government
revenues from 2.5 per cent in 1998-99 to 2.3 per cent in 2001-02. Table 13 provides
an overview of the relative importance of municipal revenues in relation to revenues
of the States and the Centre.
In terms of total expenditure, the municipal
sector accounts for about 0.79 per cent of the GDP of the country. While, municipal
expenditure accounts for little over 2 per cent of the combined expenditure of
State and Central Governments, it declined further between 1999-2000 and 2001-2002.
Table 14 provides an overview
Table
14: Expenditure Significance of Municipal Sector | Year | Municipal | Percentage | Relative
share of Municipal Expenditure | | Expenditure | of
GDP at | (as
per cent of Total Expenditure of) | | (Rs.
Crore) | Factor
Cost | State
Govt. | Central
Govt. | Combined
State & Central Govt. | 1998-99 | 12035 | 0.75 | 4.52 | 4.31 | 2.21 |
1999-00 | 14452 | 0.82 | 4.60 | 4.85 | 2.36 |
2000-01 | 15743 | 0.83 | 4.53 | 4.84 | 2.34 |
2001-02 | 15914 | 0.76 | 4.22 | 4.39 | 2.15 |
Source: (i)
Reports of Eleventh and Twelfth Finance Commission (ii) Handbook of Statistics
on Indian Economy, RBI 2005-06 | of the relative
importance of municipal expenditure in relation to the expenditures of the States
and Centre.
4.3 Finances of Select Municipal Corporations
This and subsequent sections undertake indepth analysis of municiple finances
based on primary data obtained from the budget
Table
15: Study Sample - Cities with more than 1 million population in 2001 |
S. No.
| Name of the
City | Name
of the State | UA/City
Population | MC
Population | | | | (2001)
(million) | (2001) |
1 | Greater
Mumbai | Maharashtra | 16.37 | 11914398 |
2 | Kolkata | West
Bengal | 13.22 | 4580544 |
3 | Delhi
| Delhi | 12.79 | 9817439 |
4 | Chennai | Tamil
Nadu | 6.42 | 4216268 |
5 | Bangalore
| Karnataka | 5.69 | 4292223 |
6 | Hyderabad
| Andhra Pradesh | 5.53 | 3449878 |
7 | Ahmedabad | Gujarat
| 4.52 | 3515361 |
8 | Pune | Maharashtra
| 3.75 | 2540069 |
9 | Surat
| Gujarat | 2.81 | 2433787 |
10 | Kanpur
| Uttar Pradesh | 2.69 | 2532148 |
11 | Jaipur | Rajasthan | 2.32 | 2324319 |
12 | Lucknow
| Uttar Pradesh | 2.27 | 2207340 |
13 | Nagpur
| Maharashtra | 2.12 | 2051320 |
14 | Patna
| Bihar | 1.71 | 1376950 |
15 | Indore
| Madhya Pradesh | 1.64 | 1597441 |
16 | Vadodara | Gujarat
| 1.49 | 1306035 |
17 | Bhopal
| Madhya Pradesh | 1.45 | 1433875 |
18 | Coimbatore
| Tamil Nadu | 1.45 | 930882 |
19 | Ludhiana
| Punjab | 1.40 | 1395053 |
20 | Kochi
| Kerala | 1.35 | 596473 |
21 | Visakhapatnam
| Andhra Pradesh | 1.33 | 982940 |
22 | Agra
| Uttar Pradesh | 1.32 | 1259979 |
23 | Varanasi
| Uttar Pradesh | 1.21 | 1100748 |
24 | Madurai
| Tamil Nadu | 1.19 | 928869 |
25 | Meerut
| Uttar Pradesh | 1.17 | 1074229 |
26 | Nashik | Maharashtra
| 1.15 | 1076967 |
27 | Jabalpur
| Madhya Pradesh | 1.12 | 951469 |
28 | Jamshedpur
| Jharkhand | 1.10 | 570349 |
29 | Asansol | West
Bengal | 1.09 | 475439 |
30 | Dhanbad | Jharkhand | 1.06 | 198963 |
31 | Faridabad
| Haryana | 1.05 | 1054981 |
32 | Allahabad
| Uttar Pradesh | 1.05 | 975393 |
33 | Amritsar
| Punjab | 1.01 | 1011327 |
34 | Vijayawada
| Andhra Pradesh | 1.01 | 851282 |
35 | Rajkot
| Gujarat | 1.00 | 967476 |
Source :
(i) http://urbanindia.nic.in/mud-final-site/programs/urbandevelopment/nurm.htm
Website of MUD (accessed on November 15, 2005);
(ii) http://www.censusindia.net/results/millioncities.html
Census of India website (last accessed on March 24, 2006)
(iii) Secondary
sources, including budget documents of the MCs | documents
of 35 major MCs of the country whose population was 1 million and above as per
2001 Census. Table 15 shows the sample of MCs and the States to which they belong.
4.4 Municipal Revenues
4.4.1 Structure
of Municipal Revenues
The revenue base of MCs can be broadly
categorized into: (a) tax revenues, (b) non-tax revenues, (c) assigned (shared)
revenue, (c) grants-in-aid, (d) loans and (e) other receipts. Table16 lists out
revenue sources under each major revenue head. It may be mentioned that composition
as well as relative importance of revenue sources of MCs varies across the States.
Table 17 sets out the major components of tax revenue of selected MCs in India.
While, property tax is the major revenue source in most of the MCs, octroi is
the major source in the MCs of Maharashtra and Gujarat. Octroi has been abolished
in all other States excepting Maharashtra and Gujarat.
Table 18 illustrates
the major user charges and fees levied by the select MCs in India. There is considerable
heterogeneity in the levy of user charges by MCs across states.
Table
16: Revenue Sources of Municipal Corporations in India 1998-2002 |
Revenue
Head/Category | Sources
of revenue | Tax
revenue | Property Tax, Octroi,
Advertisement Tax, Tax on Animals, Vacant Land Tax, | | Taxes
on Carriages and Carts | Non-Tax
revenue | User Charges, Municipal
Fees, Sale & Hire Charges, Lease amounts | Other
receipts | Sundry receipts,
Law charges costs recovered, Lapsed deposits, Fees, Fines | | &
Forfeitures, Rent on Tools & Plants, Miscellaneous Sales etc. |
Assigned (Shared) revenue | Entertainment
Tax, Surcharge on Stamp duty, Profession Tax, Motor Vehicles Tax |
Grants-in-aid | (i)
Plan Grants made available through planned transfers from upper tier |
| of
Government under various projects, programmes and schemes | | (ii)
Non-Plan Grants made available to compensate against the loss of income |
| and
some specific transfers | Loans | Loans
borrowed by the local authorities for capital works etc. – HUDCO, |
| LIC,
State and Central Governments, Banks and Municipal Bonds | | |
Source:
Budgets of Municipal Corporations. |
Table
17: Sources of Major Tax Revenues of Selected Municipal Corporations |
| in
India 1998-2002 | |
Name of State | Name
of Municipal
Corporation | Major
Taxes | Andhra Pradesh | Hyderabad
| Property Tax, Profession Tax |
Bihar | Patna
| Property Tax, Profession Tax |
Delhi | Delhi
| Property Tax, Advertisement Tax |
Gujarat | Surat
| Property Tax, Octroi |
Karnataka | Bangalore
| Property Tax, Advertisement Tax |
Kerala | Kochi
| Property Tax, Profession Tax |
Madhya Pradesh | Indore
| Property Tax, Advertisement Tax |
Maharashtra | Mumbai | Octroi,
Property Tax | Punjab | Ludhiana
| Octroi, Property Tax |
Rajasthan | Jaipur | Octroi,
Property Tax | Tamil nadu | Chennai | Property
Tax, Profession Tax | Uttar
Pradesh | Varanasi | Property
Tax, Advertisement Tax | West
Bengal | Kolkota | Property
Tax, Advertisement Tax | | | |
Source: Budgets
of Municipal Corporations. | |
Shared tax revenue, which varies in terms of composition and
nature across states, also forms significant proportion of MC resources (Table
19). Entertainment tax is an important tax, not levied by the MCs, but collected
and assigned to the MCs by State Governments. In Andhra Pradesh and Tamil Nadu,
in addition to entertainment tax, profession tax and surcharge on stamp duty are
also assigned to local bodies.
Table
18: Sources of Major User Charges and Fees of Selected Municipal |
Corporations
in India 1998-2002 | Name
of State | Name of Municipal
Corporation | User Charges
and Fees | | | |
Maharashtra | Greater
Mumbai | Water Charges, Sewerage Charges,
Building | | | Licence
Fees | West Bengal | Kolkata | Planning
Fees, Car Parking Fees, Mutation | | | Fees |
Karnataka | Bangalore
| Betterment Charges, Building Licence
Fees, | | | Penalty
for Late Tax payment | Orissa | Bhubaneswar
| Building Licence Fees, Market Fees |
Gujarat | Surat
| Water Charges, Building-related Fees, |
| | Betterment
Charges | Tamil Nadu | Chennai | Building
Licence Fees, Market Fees, Other | | | Licence
Fees, Parking Fees | Andhra
Pradesh | Hyderabad | Dangerous
and Offensive Trade Licence | | | Fees,
Market Fees, Slaughter House Fees | Uttar
Pradesh | Kanpur | Building
Licence Fees, Market Fees | | | |
Source: Budgets
of Municipal Corporations. | |
Table
19: Sources of Shared Revenues of Selected Municipal Corporations in |
India
1998-2002 | Name
of State | Name
of Municipal
Corporation | Shared
Municipal
Taxes | Maharashtra
| Greater Mumbai | Non-agricultural
Assessment
Tax, | | | Entertainment
Tax | West Bengal | Kolkata | Motor
Vehicles Tax, Entertainment Tax | Karnataka | Bangalore
| Entertainment Tax, Surcharge on Stamp |
| | Duty |
Gujarat | Surat
| Entertainment Tax |
Tamil Nadu | Chennai | Surcharge
on Sales Tax, Duty on Transfer | | | of
Property, Entertainment Tax | Andhra
Pradesh | Hyderabad | Surcharge
on Stamp Duty, Profession | | | Tax,
Entertainment Tax | Source:
Budgets of Municipal Corporations. | |
Apart from their own revenue sources, i.e., tax
and non-tax revenue sources, the MCs depend upon grants from State Governments.
These grants are primarily intended to compensate for the mismatch of functions
and finance. Most of the MCs receive financial support in the form of revenue
grants from State Governments to meet current expenses. Similiarly, capital grants
are also provided for meeting project related expenditure. Table 20 shows the
composition of grants-in-aid in selected MCs.
In addition to own revenues,
shared revenues, user charges & fees and grants-in-aid, loans also constitute
an important source of municipal revenues in some ULBs.
4.4.2
Composition and Trends of Municipal Revenues
Relative contribution
of various components in the total revenue over the years has been presented in
Tables 21(a) and 21(b). Between 1999-00 to 2003-04, while the share of non-tax,
assigned revenue, non-plan and plan grants improved, the share of tax revenue
in total revenue receipts of MCs declined.
The average shares of major
revenue components (average of 2000-04) based on the data of 35 Municipal Corporations
are shown
Table
20: Major Sources of Grants-in-Aid of Selected Municipal Corporations |
in
India 1998-2002 | Name
of State | Name
of Municipal | Grants-in-Aid
provided to | | Corporation | Municipal
Corporations | Maharashtra
| Greater Mumbai | Primary
Education Grant and Secondary | | | Education
Grant | West Bengal
| Kolkata | Dearness
Allowance Grant, Grant to | | | Implement
Recommendations of Pay | | | Commission
and Water Supply, Sewerage | | | and
Drainage Grants | Karnataka | Bangalore
| Octroi Compensation, Motor-Vehicle
Tax | | | Compensation
and Family Planning | | | Scheme
Grants | Orissa | Bhubaneswar
| Salary and Dearness Allowance
Grants, | | | Road
Development Grant, Primary | | | Education
Grant and Secondary | | | Education
Grant | Gujarat
| Surat | Education
Grant, Family Planning Grant | | | and
Small Savings Grant | Tamil
Nadu | Chennai | Revenue
Grant, Contributions and | | | Compensation
for Toll | Andhra
Pradesh | Hyderabad | Property
Tax Compensation, Octroi | | | Compensation,
Per Capita Grant, Motor | | | Vehicle
Tax Compensation and Road Grant | Uttar
Pradesh | Kanpur | Octroi
Compensation, Salary Grant, | | | Education
Grant (Primary & Secondary | | | Education),
Medical Grant, Road Grant | Source:
Budgets of Municipal Corporations. | |
in the Figure 2. Among the various revenue sources, tax revenue
assumes greater importance in terms of both size and share. The
Table
21(a): Composition of Municipal Revenue and Trends |
(Rs.in
Lakh) | Sl. | Revenue
| 1999- | 2000- | 2001- | 2002- | 2003- | Average |
No. | component
| 2000 | 2001 | 2002 | 2003 | 2004 | Growth
Rate % | 1 | Tax
revenue | 458509 | 554597 | 461895 | 573952 | 599387 | 8.23 |
2 | Non-Tax
revenue | 238670 | 297890 | 296487 | 421422 | 434905 | 17.42 |
3 | Assigned
revenue | 87557 | 115909 | 110146 | 132588 | 131076 | 11.66 |
4 | Non-Plan
grants | 26667 | 34145 | 33341 | 54876 | 50161 | 20.42 |
5 | Other
revenue
receipts | 98600 | 86769 | 48024 | 64177 | 63271 | -6.11 |
| Revenue
Receipts | 910003 | 1089310 | 949893 | 1247015 | 1278800 | 10.18 |
6 | Plan
grants | 16753 | 15665 | 31712 | 30027 | 49898 | 39.20 |
7 | Loans | 19917 | 47245 | 31805 | 28520 | 32835 | 27.33 |
8 | Other
capital receipts | 11228 | 18101 | 18622 | 25785 | 33948 | 33.55 |
| Capital
Receipts | 47898 | 81011 | 82139 | 84332 | 116681 | 27.89 |
| Total
Receipts | 957901 | 1170321 | 1032032 | 1331347 | 1395481 | 11.04 |
Source:
Based on the Budgets of Municipal Corporations. |
Table
21(b): Composition of Municipal Revenue and Trends |
(Per cent to Total) |
Sl.No. | Revenue
component | 1999- | 2000- | 2001- | 2002- | 2003- | Average
% | | | 2000 | 2001 | 2002 | 2003 | 2004 | |
1 | Tax
revenue | 47.87 | 47.39 | 44.76 | 43.11 | 42.95 | 45.21 |
2 | Non-Tax
revenue | 24.92 | 25.45 | 28.73 | 31.65 | 31.17 | 28.38 |
3 | Assigned
revenue | 2.78 | 2.92 | 3.23 | 4.12 | 3.59 | 3.33 |
4 | Non-Plan
grants | 9.14 | 9.90 | 10.67 | 9.96 | 9.39 | 9.87 |
5 | Other
revenue receipts | 10.29 | 7.41 | 4.65 | 4.82 | 4.53 | 6.34 |
| Revenue
Receipts | 95.00 | 93.08 | 92.04 | 93.67 | 91.64 | 93.08 |
6 | Plan
grants | 1.75 | 1.34 | 3.07 | 2.26 | 3.58 | 2.40 |
7 | Loans | 2.08 | 4.04 | 3.08 | 2.14 | 2.35 | 2.74 |
8 | Other
capital receipts | 1.17 | 1.55 | 1.80 | 1.94 | 2.43 | 1.78 |
| Capital
Receipts | 5.00 | 6.92 | 7.96 | 6.33 | 8.36 | 8.36 |
| Total
Receipts | 100.00 | 100.00 | 100.00 | 100.00 | 100.00 | 100.00 |
Source: Based
on the Budgets of Municipal Corporations. | aggregate
tax revenue of the 35 MCs constituted 45 per cent of average aggregate total revenue
(total receipts), which was followed by non-tax revenue constituting 28 per cent
of the average aggregate.
4.5 Municipal Expenditure
4.5.1 Structure of Municipal Expenditure The expenditure
incurred by the MCs can be broadly categorized into: (a) revenue expenditure and
(b) capital expenditure. 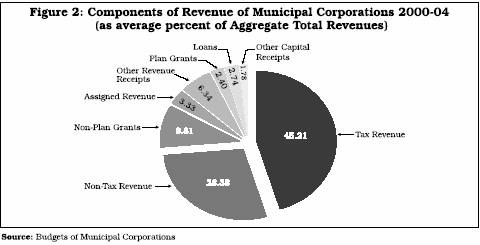
Table
22: Categorisation of Municipal Expenditures | Expenditure
Category | Expenditure
Items | Establishment
expenditure | Staff
salaries, Allowances, wages, Pensions & Retirement benefits etc. |
Administrative
expenditure | Rents,
rates & Taxes, Office maintenance, Communications, Books & |
| periodicals,
Printing & stationary, Travel expenditure, Law charges etc. |
Operations &
Maintenance | Power
& fuel, Bulk purchases, Stores, Hire charges, Repairs & expenditure Maintenance
and Interest payments made on loans | Capital
expenditure | Buildings,
Water supply & Sewerage, Energy/lighting, Solid waste management , Roads,
Bridges, Culverts, Causeways, Health & sanitation, Parks and recreation spaces,
Furniture & fittings, Tools & plant, Equipment etc., Principal
repayments of loans | Other
expenditure | Miscellaneous
expenses not accounted for in the above | Source:
Budgets of Municipal Corporations. | Further,
revenue expenditure broadly comprises (i) establishment expenditure, (ii) administrative
expenditure, (iii) operations and maintenance expenditure, and (iv) interest payments
on loans; the capital expenditure comprises (i) expenditure on capital formation
and (ii) principal repayment. The component of these major expenditure categories
are shown in table 22.
4.5.2 Composition and Trends of Municipal
Expenditure
The composition of aggregate expenditure of the
MCs, in terms of the above categories, and trends are shown in Tables 23(a) and
23(b).
Table
23(a): Composition and Trends of Municipal Expenditure |
(Rs.in Lakh) |
Sl. No | Expenditure
component | 1999- | 2000- | 2001- | 2002- | 2003- | Average |
| | 2000 | 2001 | 2002 | 2003 | 2004
Rate
% | Growth |
1 | Establishment
and administration expenditure | 279216 | 330414 | 329592 | 411432 | 402550 | 10.19 |
2 | Operation
and maintenance expenditure | 107383 | 128165 | 142174 | 164406 | 154400 | 9.96 |
3 | Other
revenue expenditure | 51830 | 56120 | 55954 | 58190 | 56265 | 2.17 |
4 | Revenue
Expenditure | 438429 | 514699 | 527720 | 634028 | 613215 | 9.20 |
5 | Capital
Expenditure | 96933 | 105942 | 119463 | 124817 | 150424 | 11.76 |
6 | Other
Expenditure (not classified) | 209744 | 266611 | 210685 | 399205 | 470925 | 28.40 |
| Total
Expenditure | 745106 | 887252 | 857868 | 1158050 | 1234564 | 14.34 |
Source: Budgets
of Municipal Corporations. |
Table
23(b): Composition and Trends of Municipal Expenditure
| (Percent
to Total) | Sl.
No. | Expenditure
component | 1999- | 2000- | 2001- | 2002- | 2003- | Average% |
| | 2000 | 2001 | 2002 | 2003 | 2004 | |
1 | Establishment
and | 37.47 | 37.24 | 38.42 | 35.53 | 32.61 | 36.25 |
| administration
expenditure | | | | | | |
2 | Operation
and maintenance expenditure | 14.41 | 14.45 | 16.57 | 14.20 | 12.51 | 14.43 |
3 | Other
revenue expenditure | 6.96 | 6.33 | 6.52 | 5.02 | 4.56 | 5.88 |
4 | Revenue
Expenditure | 58.84 | 58.01 | 61.52 | 54.75 | 49.67 | 56.56 |
5 | Capital
Expenditure | 13.01 | 11.94 | 13.93 | 10.78 | 12.18 | 12.37 |
6 | Other
Expenditure (not classified) | 28.15 | 30.05 | 24.56 | 34.47 | 38.15 | 31.07 |
| Total
Expenditure | 100.00 | 100.00 | 100.00 | 100.00 | 100.00 | 100.00 |
Source: Budgets
of Municipal Corporations. | The average shares
of different components in aggregate expenditure during the period of 2000-04
are shown in Figure 3.
Among all the components of municipal expenditure,
the expenditures on capital works, establishment & administration, and operations
& maintenance assume importance. The establishment & administrative expenditure
constituted 36.25 per cent of the aggregate total expenditure, during 2000-2004.
Capital expenditure, which is an important component, constituted less than 13
per cent of the total expenditure, during the same period. 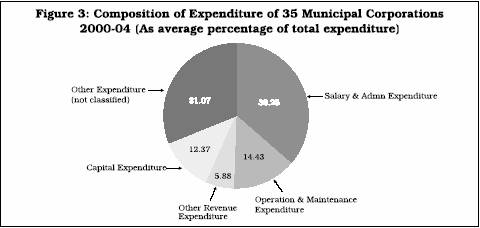
The
above expenditure pattern indicates that the MCs’ spending on capital works
has been significantly low which is critical for building civic infrastructure
for planned urban development.
The under-investment in public works is
reflected in inadequate availability of civic amenities such as water supply,
sewerage, transportation networks and storm drainage system as discussed in the
next chapter.
4.5.3 Expenditure on Public Works
The expenditure on public works is an important component of the expenditure
incurred by the Municipal Corporations. It includes both the expenditure on capital
formation as well as the current expenditure incurred on public works by the MCs.
The current expenditure comprises expenditure on staff, administration and operations
& maintenance. The trends and compostion of expenditure on public works are
shown in Tables 24(a) and 24(b). The total expenditure on all public works of
the MCs accounted for 46.5 per cent of the total expenditure, on an average, during
2000-2004. Among the components, expenditures on health & sanitation and street
lighting have grown the fastest, followed by expenditures on roads, education
and sewerage. The growth in expenditures
Table
24(a): Composition of Expenditure on Public Works and its Trends |
(Rs.in Lakhs) |
Public Works | 1999- | 2000- | 2001- | 2002- | 2003- | Average |
| 2000 | 2001 | 2002 | 2003 | 2004 | Growth |
| | | | | | Rate
% | Health & Sanitation | 14593 | 33708 | 38339 | 47695 | 49443 | 43.20 |
Water supply | 28803 | 31742 | 34694 | 40792 | 40976 | 9.38 |
Roads | 58730 | 85658 | 83420 | 92270 | 97390 | 14.85 |
Parks & Playgrounds | 72658 | 77040 | 83298 | 88722 | 90533 | 5.68 |
Education | 48500 | 57782 | 60533 | 72218 | 74885 | 11.72 |
Sewerage | 20963 | 22742 | 27783 | 31013 | 32860 | 12.06 |
Solid waste management | 42440 | 50696 | 50886 | 57511 | 57614 | 8.26 |
Energy/lighting | 27436 | 43150 | 32092 | 81495 | 69277 | 42.65 |
All Major Works | 314123 | 402518 | 411046 | 511716 | 512977 | 13.75 |
Source: Budgets
of Municipal Corporations. |
Table
24(b): Composition of Expenditure on Public Services and its Trends |
(as Percentage
of Total) | Public
Works | 1999- | 2000- | 2001- | 2002- | 2003- | Average |
| 2000 | 2001 | 2002 | 2003 | 2004 | Growth |
Health & Sanitation | 4.65 | 8.37 | 9.33 | 9.32 | 9.64 | 8.26 |
Water supply | 9.17 | 7.89 | 8.44 | 7.97 | 7.99 | 8.29 |
Roads | 18.70 | 21.28 | 20.29 | 18.03 | 18.99 | 19.46 |
Parks & Playgrounds | 23.13 | 19.14 | 20.26 | 17.34 | 17.65 | 19.50 |
Education | 15.44 | 14.36 | 14.73 | 14.11 | 14.60 | 14.65 |
Sewerage | 6.67 | 5.65 | 6.76 | 6.06 | 6.41 | 6.31 |
Solid waste management | 13.51 | 12.59 | 12.38 | 11.24 | 11.23 | 12.19 |
Energy/lighting | 8.73 | 10.72 | 7.81 | 15.93 | 13.50 | 11.34 |
All Major Works | 100.00 | 100.00 | 100.00 | 100.00 | 100.00 | 100.00 |
As share of Total Expenditure (%) | 42.16 | 45.37 | 47.91 | 44.19 | 41.55 | 44.24 |
Source: Budgets
of Municipal Corporations. | incurred on water
supply, parks and play grounds and solid waste management has been relatively
modest.
The MCs have been assigned some of the essential service delivery
functions as defined under the respective Municipal legislations. It was laid
down that they shall give primary attention to providing essential services like
water supply, sewerage, street lights, solid waste management and public (only
primary) health. A disproportionately high spending on non-discretionary items
like 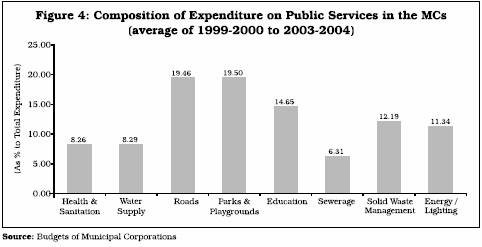
secondary
education or secondary health care may not be desirable, unless an MC has already
attained satisfactory levels of services on essential services.
The composition
of expenditure on various public services in the MCs (shown in Figure 4) clearly
indicates that the expenditure incurred on essential municipal functions (obligatory/non-discretionary
items) like provision of water supply, drainage, sewerage, health & sanitation
and solid waste management has been comparatively lower than the expenditure incurred
on non-essential functions (discretionary items) like provision of education and
parks. This calls for rationalising the discretionary spending by MCs through
suitable guidelines; and to improve public accountability of expenditure through
citizen’s charters and social audits which will be discussed in Chapter
6.
Although water supply and sewerage functions are handled by separate
boards in some metropolitan cities like Delhi, Hyderabad, Bangalore and Chennai,
this fact does not affect the findings on municipal expenditures. In fact, the
pattern of expenditure on public works, after deducting the corresponding figures
for water supply and sewerage, of the above four metropolitan cities, more or
less remains the same.
4.6 Summary Observations
The municipal sector in India has remained small with its total revenue accounting
for about 0.75 per cent of GDP. In terms of both revenue and expenditure they
account for a little above 2 per cent of the combined revenues and expenditure
of Central Government, State Governments and ULBs. Analysis of the data for 35
major MCs indicated higher growth of expenditure (14.3 per cent) during 200-04
compared to the growth of total receipts (11.0 per cent). Component-wise, tax
revenue accounted for 45.2 per cent of total revenue, followed by non-tax revenue
(28.7 per cent) during 2000-04. Establishment and administration expenditure accounted
for about 36 per cent of total expenditure during 2000-04. Expenditure on public
works accounted for about 44 per cent of the total expenditure with expenditure
on roads and parks and playgrounds accounting for about 19.5 per cent of the total
expenditure. |
 IST,
IST,


