 IST,
IST,


Pass-through of International Food Prices to Emerging Market Economies: A Revisit
Satyananda Sahoo, Sujeesh Kumar and Barkha Gupta* Sharp upturns in international food prices in 2007-08 and 2010-11 have motivated a close scrutiny of their volatility, transmission and supply chains. While global food prices have remained tame since 2012, the uptick in prices of major food groups in the second half of 2019 is expected to add to the upside risks of domestic food prices across emerging market economies (EMEs), which are already witnessing high food inflation pressures due to internal supply shock conditions. Against this backdrop, this study intends to re-examine whether global food prices hold any implications for domestic prices in EMEs which have higher shares of food in their overall consumption baskets. Using data from January 2007 to July 2019, the study finds that short-term elasticities, in the range of 0.02-0.16, are lower than long-term elasticities. Moreover, there are large cross-country divergences in long-term transmission elasticities. JEL Classification: F14, C22 Keywords: Food price transmission, law of one price, vector error correction model Introduction Headline consumer price index (CPI) inflation in India exhibited sharp rise in the second half of 2019, breaching monetary policy’s upper band level of 6.0 per cent in December 2019. This episode of high inflation is attributed to a spike in domestic food prices resulting from supply shocks across majorfood items. As India has transitioned along an inflation glide path1 since 2014-15 – a precursor to the explicit Inflation Targeting (IT) framework – such an uptrend in domestic inflation has caused resurfacing of concerns over food price volatility, raising questions on the role of the monetary authority in containing the same. While domestic supply conditions largely drive food inflation, shocks in international food prices are also among the important sources of domestic inflation in EMEs (Furceria et al., 2016). Although global food prices have remained tame since 2012, an uptick in the prices of major food groups in the second half of 2019 is expected to add further upside risks to already rising domestic food prices, not just in India but also across other major EMEs. The transmission of food price changes from international to domestic markets strengthened for EMEs due to the increased participation of these economies in global food markets and stronger market integration. Largeincreases in international food prices in 2007-08 and 2010-112 led to close scrutiny of food prices, their volatility, transmission and supply chain. Both advanced economies (AEs) and EMEs witnessed transmission of food price pressures although with different magnitudes. While a high transmission could promote comparative advantage and higher agricultural production, highly volatile prices could undermine the incentives for farmers to increase production in response to high prices, therefore undermining the scope to reduce domestic prices. The World Bank’s nominal food price index rose sharply in 2007-08 and 2010-11 registering an increase of 23.8 per cent on year-on-year (y-o-y) basis in 2007, 33.5 per cent in 2008 and 22.5 per cent in 2011. Such unanticipated increases in world food prices during these two episodes i.e., 2007-08 and 2010-11 were seen across all food groups and the effect was particularly serious across EMEs as the average household in many EMEs spends a substantial part of its income on food. While the share of disposable income spent on food is around 10-15 per cent for many AEs, it is more than 20 per cent for most EMEs. As a result, the weight of food in the CPI basket remains at high levels in EMEs. Moreover, inflation expectations in AEs are relatively better anchored than in EMEs, which has further helped limit global food price pass-through across the former (ibid). Though the major EMEs have adopted inflation targeting to limit the pass-through of supply shocks to inflation through better anchoring of inflation expectations, high weightage of food in the overall CPI basket still remains a challenge, and thus, keeps EMEs vulnerable to such shocks. Against this backdrop, this paper attempts to address the following issues: Are high and volatile global food prices a cause of concern for domestic inflation? If yes, to what extent do changes in world food prices get transmitted to domestic prices? While a few studies have been conducted to examine the degree of transmission at both individual and cross-country levels, no such study has been conducted in the recent past possibly because food prices have been relatively stable since 2012 until the second half of 2019, when they started showing signs of pickup again. Therefore, the present study is an attempt to re-examine whether the degree of pass-through is significant to EMEs and if any long-run relationship between world food prices and domestic food prices still holds. The pass-through of fluctuations in world food prices to domestic food prices was examined for six EMEs, viz. China, Brazil, Sri Lanka, Thailand, Turkey and India as food products hold higher weightage in the CPIs of these countries. Based on monthly data from January 2007 to July 2019, the study finds that while all the transmission elasticities are positive, they differ across countries. The short-term pass-through coefficients are limited to a range of 0.02-0.16. While the findings of this paper reaffirm that transmission from global food prices to domestic food prices is incomplete in case of EMEs, it finds that there has been a large cross-country divergence in transmission elasticities in the long term. Moreover, the paper contributes to the literature by examining whether the nature of pass-through from international to domestic food prices has changed over time with evolving global and domestic trade dynamics. The remaining of the paper is structured as follows. Section II briefly reviews the literature, while some stylised facts on global food prices are discussed in Section III. The methodology used in the paper is explained in Section IV. Empirical findings are presented in Section V. The concluding observations are set out in Section VI. Section II Global food price volatility has always been a matter of concern as it holds implications for domestic food inflation across economies and, therefore, poses a significant challenge in designing appropriate policy responses. Such concerns are specifically serious for EMEs than those for AEs since food forms a larger part of their consumption basket and their monetary policy may lack credibility to anchor inflation expectations and find it difficult to contain pass-through effects effectively (Furceria et al., 2016). A vast pool of studies could be found in the literature which analysed the transmission of global food price shocks to domestic food price inflation and volatility, both individual and cross-country experiences (Appendix Table A.1). Some of the earlier studies have examined the pass-through of global food price shocks to both AEs and EMEs and suggested that such pass-through could be incomplete across economies (Ianchovichina et al., 2012; IMF, 2011a; Sharma, 2003). Moreover, such transmission has also been found to be asymmetric across AEs and EMEs, with pass-through tending to be higher for the latter (IMF, 2011a). Dawe (2008), Imai et al. (2008) and Minot (2011) even found evidence of heterogeneity in transmission across different varieties of crops. While assessing the impact of various internal and external factors on domestic food price inflation, Lee and Park (2013) found evidence of transmission of global food price inflation and volatility to domestic economies. According to their findings, domestic food inflation, specifically in Asia, was found to be strongly related to past values of global food inflation, while volatility spillovers from global to domestic food prices were found to be contemporaneous. Moreover, the study suggested that the degree of pass-through of global food prices to domestic food prices differs across regions and internal factors play an important role in determining national food price inflation and volatility. While examining the implications of high international food prices for inflation in select Central Asian economies, viz. Tajikistan, Kazakhstan, Uzbekistan, and the Kyrgyz Republic, Al-Eyd et al. (2012) concluded that global food prices have significant short-run effects on headline inflation in these economies. Based on a simulation experiment, they found that administrative measures are ineffective in controlling domestic inflation in these economies. Similarly, Minot (2011) in his study based on 11 Sub-Saharan African countries for eight food items during 2007 and 2008 found evidence of transmission of global food prices to domestic prices of rice and, to some extent, maize. Imai et al. (2008) found a faster transmission of prices for crops like rice, maize and wheat than for fruits and vegetables in India and China. Among country-specific studies, the study by Barahona and Chulaphan (2017) examined the extent to which changes in global food price indices get transmitted to consumer price indices for diverse groups of consumers in Thailand in order to understand if the welfare of different types of consumers was equally affected by variations in world food prices. Their findings suggested that food inflation faced by the rural household was more responsive to changes in world food prices as their food basket consisted more of fresh agricultural commodities and essential food items which in turn were found to be highly sensitive to world price fluctuations. Selliah et al. (2015) empirically assessed the impact of the global food price surge on domestic inflation using monthly price series between 2003 and 2012 for Sri Lanka. Their results suggested a strong co-movement between global and domestic food prices. A similar study by Gomez Lopez and Gallardo (2013) on Mexican markets suggested that global food price pass-through exists in the long run and not in the short run for these markets. Shittu et al. (2017) examined the patterns, drivers and policy responses to food price spikes and volatility in Nigeria. They found that international food prices and crude oil prices, along with other domestic macroeconomic factors, viz. real exchange rate, monetary policy rate and narrow money, contributed to food price instability in Nigeria. In the Indian context, we found very few studies that particularly examined the pass-through of global food prices to Indian food prices. In most studies, the variations in global food prices have either been included as one of the factors affecting Indian food inflation (Bhattacharya and Sen Gupta, 2017; Mishra and Roy, 2012) or India has been considered as one of the EMEs in the cross-country analysis (Dawe, 2008; Imai et al., 2008; Sivabalasingam, 2018). Rajmal and Misra (2009) have, however, particularly looked into the pass-through of global food prices to the Indian food prices. In their analytical review, they suggested that domestic food price levels and volatility remained lower than that of international prices and were driven mainly by domestic factors which led to limited pass-through during the price hike episode of 2007-08. The findings of the above-mentioned studies have, however, been quite unanimous, showing limited pass-through from international food prices to domestic prices as local factors play a dominant role in driving food prices in India. With this background, the present study attempts to revisit the phenomenon of international food price pass-through to domestic prices in some of the major EMEs and to empirically examine whether international food prices, which have been relatively stable yet high over the past couple of years but have shown signs of firming up in the second half of 2019, drive domestic food prices. Section III Global food prices have eased since 2012 after witnessing a sharp increase in 2007-08 and 2010-11 and remained relatively stable since 2015, until recently when global food prices showed signs of pickup in second half of 2019. The rise was particularly significant between 2000 and 2008, as reflected in an increase of more than 80 per cent in real terms in the World Bank’s food price index (Chart 1). During the first episode of 2007-08, world food prices firmed up by 24 per cent in 2007. This increase accelerated further in the first half of 2008 on demand-supply imbalances in the global market, resulting in an overall increase of around 34 per cent in 2008. Besides, the rise in demand for biofuels, increased agricultural input prices due to high oil prices, adverse weather conditions in some major producing countries and speculative transactions in commodity markets further added to the upward pressure on food prices during that period. The upturn in international food prices resulted in increased food price inflation around the world, thereby raising concerns over food security and its impact on health and nutrition, specifically for countries with a larger proportion of low-income consumers who spend a substantial portion of their income on food commodities (Table 1). Although food prices declined in the second half of 2008, the uptrend resumed in mid-2010, marking a second consecutive spike within a decade, thus reviving concerns over high prices and the associated volatility. 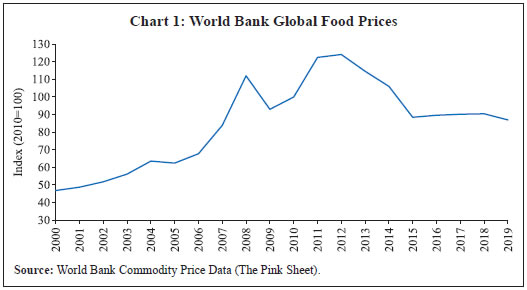 In both the episodes (2007-08 and 2010-11), movements in the world and domestic food prices were in line with earlier episodes of high prices seen in 1970s, where domestic prices adjusted gradually to rapidly rising world prices. However, the major difference between these two episodes of 2007-08 and 2010-11 was that the food price increase in 2007-08 followed a long period of stability in prices, while in 2010-11, the food price spike episode occurred when world markets and domestic polices were still in the phase of recovery from the 2007-08 price shock (Laborde et al., 2019; World Bank, 2019). The unanticipated spikes were witnessed across all food groups with grains contributing to the highest increase in price followed by oils and meals (Chart 2). While the extent of price hike in both episodes was more or less the same, the affected commodities were not the same. During 2007-08, while sugar prices remained low, prices of rice, wheat, oil and other cereals remained elevated. World rice prices increased by almost 100 per cent in 2008 (y-o-y) following export restrictions by major producers amid concerns over food security, while a weak dollar and rising oil prices added further upward pressures (World Bank, 2019). During 2010-11, however, rice prices increased merely by around 15 per cent - much less than that during the first episode (Chart 3a). Rice prices were particularly high in Asia, while the rise in wheat and maize prices was much more prominent in Central and South America (Rajmal and Misra, 2009). World wheat prices increased sharply by around 70 per cent between 2006 and 2008 on supply disruptions caused by drought in major exporting countries, while in 2011 it increased by 41 per cent (y-o-y), driven by supply-demand imbalances (Chart 3b). Similarly, world maize prices increased by around 57 per cent in 2011 compared to 36 per cent increase in 2008 (Chart 3f), largely driven by adverse weather conditions in major maize exporting countries and increased demand from the United States (US) to meet mandatory targets of ethanol production (World Bank, 2019). In contrast to cereals, sugar prices remained relatively stable during the first episode, picking up gradually to register a sharp rise in 2011 due to demand pressures emerging out of rising biofuel production (Chart 3c). A similar trend was witnessed for palm oil and soybean (Charts 3d and 3e). 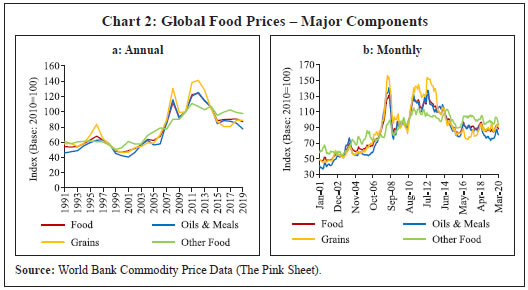 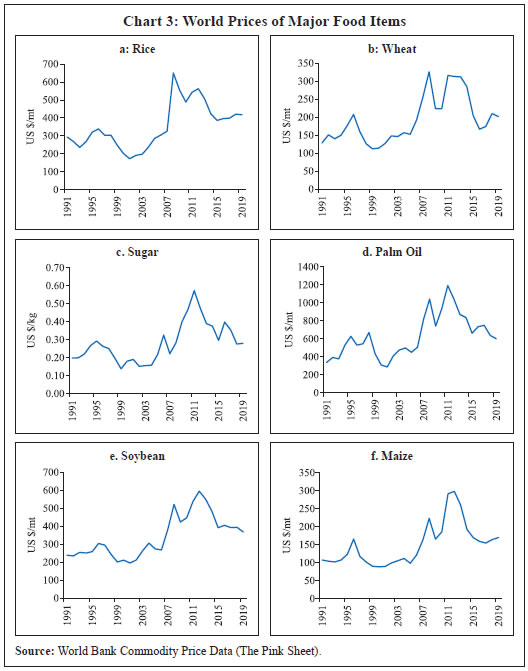 III.1 Transmission of Global to Domestic Food Prices International food prices can get transmitted to domestic prices through different channels. First, and the most direct, is the import channel which operates (a) when economies are either highly dependent on imported food items to meet their domestic demand or (b) in situations of internal supply shocks where economies attempt to contain the price rise through imports. In such situations, the possibility of pass-through from elevated global prices to domestic prices increases. Second, an increase in prices of imported food items encourages import substitution with locally produced goods, thereby adding upward pressure to the local prices of those goods (Jalil and Tamayo Zea, 2011). Furthermore, high global prices incentivise local producers to increase their share of exports in total production to earn higher profits, which in turn pushes domestic prices upwards on the back of internal supply shortages (Chart 4). While there are various channels through which changes in international prices get transmitted to domestic prices, country-specific factors play an important role in determining the effectiveness and magnitude of these pass-through channels, thereby explaining the differential impact of international food price shocks on different economies. Moreover, the extent of pass-through also varies across countries, depending on the strength of the policy framework and other structural factors (IMF, 2011b). For instance, a country’s prevailing market structure and design for distribution chains determine the market power of the sellers and their ability to transmit price shocks to the consumers. Other country-specific factors, viz. policy interventions, transport facility, transaction cost and exchange rate regime, also determine the magnitude and intensity of the transmission process (Cachia, 2014). 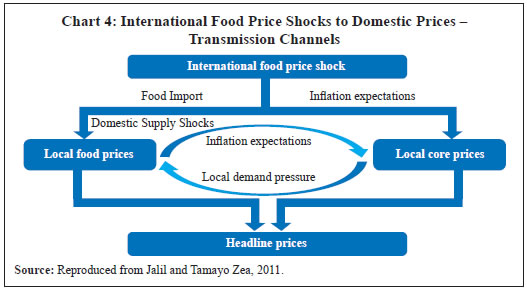 III.2 India’s Experience In the Indian context, the share of food exports in world food exports has remained higher than the share of food imports in world food imports, implying the dominance of the export channel. However, as India’s share in world food trade in terms of both exports and imports has remained very low, the pass-through might have been weak (Chart 5). The movement of Indian food prices versus global food prices during the last two decades could broadly be classified into three distinct phases. Generally, Indian food prices moved in tandem with international food prices in the first two phases, between 2001 and 2013. In the first phase between 2001 and 2005, while international and domestic prices moved in close sync, they exhibited intermittent divergent movements in the second phase, i.e., between 2006 and early 2013 as the rise in world food prices was much sharper than the rise in Indian food prices (Chart 6a). Global food prices spiked sharply twice, i.e. in 2007-08 and 2010-11, while Indian food prices registered a steady increase, rising by almost 90 per cent between July 2006 and December 2012 – much higher than that in the first phase. Therefore, the upward pressure on Indian food prices that started building up in early 2006 on domestic factors was further accentuated by episodes of global food price shocks. Such shocks in global food prices led to a sharp rise in global food inflation by around 70 per cent in early 2008 and 35 per cent in early 2011 (Chart 6b). Domestic food inflation also picked up during this period, reaching to almost 20 per cent in early 2010 – much higher than the level which prevailed between 2001 and 2005. In the third phase, beginning 2013, however, global and domestic food prices showed signs of divergence as global prices fell sharply on the back of excess supply leading to deflation, while domestic prices remained slightly elevated. Although Indian food prices also moderated during this period, leading to disinflation in Indian food prices, the extent of the decline was not as sharp as in global food prices. During this phase, Indian food prices were supported by an administered price policy and low import content which delinked domestic prices from global prices to some extent. 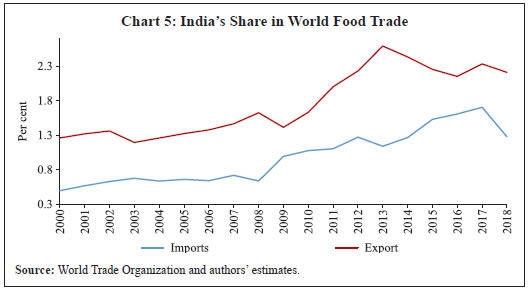 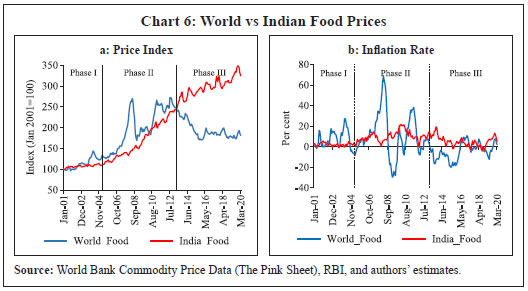 At the commodity level, significant variations could be found across different commodity prices (Chart 7). Palm oil and sugar prices – both being tradeable goods in world markets – co-moved with international prices. As a net importer of palm oil, India is a price-taker in the world market and thus domestic prices are highly influenced by global prices. In the case of sugar, while Indian prices are highly administered, a certain degree of co-movement in international and domestic sugar prices is visible due to the possibility of global sugar prices being taken as the benchmark while deciding on domestic sugar prices. However, in the case of rice and wheat, such co-movement could not be traced as the prices of these commodities are highly influenced by domestic factors and the policies of the government at different points of time to limit the fluctuations in their prices, viz. public distribution system, minimum support price and interventions through different trade policy instruments. 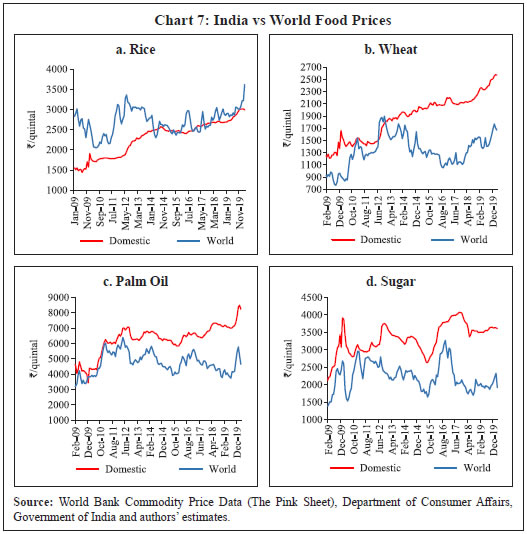 In sum, while world food prices have decreased since 2012, they continue to remain higher than the levels observed before 2007-08. Also, as mentioned earlier, world food prices showed signs of uptick in last few months of 2019. Moreover, domestic food prices across some major EMEs have also edged up in recent months on supply-demand imbalances. Therefore, if global food prices continue to rise, they may add upside risks to the domestic food prices, which will in turn pose challenges in containing inflation. Thus, with this background, we examine whether global food prices still have implications for domestic prices of EMEs which have a higher share of food in their overall consumption basket. The pass-through effect of global food prices on domestic prices could be drawn from the principle of the Law of One Price (LOP) (Ardeni, 1989; Selliah et al., 2015). According to the LOP principle, in efficient markets, assuming there is no transport cost or hindrances to trade, prices for a single homogenous commodity, when expressed in a common currency, are defined as follows3 (RBI, 2019): 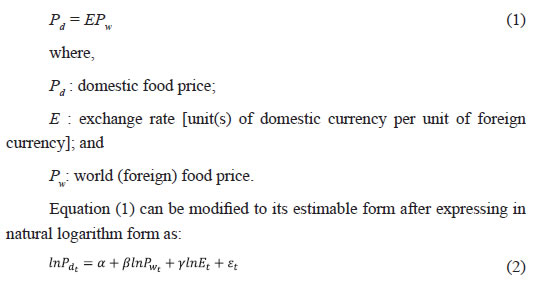 In equation (2), lnPw is assumed to be exogenous as EMEs are usually price-takers. The coefficient β is expressed as the long-term price transmission elasticity when the long-term relationship is empirically established through cointegration test. It may be noted that LOP expressed in equation (1) is in its strict form based on the theory of purchasing power parity (PPP) which states that the exchange rate is proportional to the ratio of price levels in two countries. Equation (2) is an estimable version of equation (1) or a weak form of LOP under the belief that PPP holds in the long run. Short-term price elasticity is derived from the estimated error correction model (ECM) of the following form:  In the above equation, ECT is defined as the error correction term and Δ is the first difference operator. The parameters φ and γ are the short-term transmission elasticities and ρ is the persistence parameter. To estimate the degree of pass-through from international food prices to domestic food prices, this study uses the data on six EMEs which have higher shares of food products in their respective consumer price indices, viz. China, Brazil, India, Sri Lanka, Turkey and Thailand. The estimated model also included the share of each country’s food imports (barring Sri Lanka and Thailand) to world merchandise import and share of food exports to world merchandise exports as control variables. Data are sourced from the Food and Agriculture Organization (FAO), CEIC, the Bloomberg database and official websites of individual countries. The monthly data from January 2007 to July 2019 were used for the analysis. Further, in order to make a common base, the data were spliced wherever required. For estimation purposes, all variables were transformed to the natural logarithm. The descriptive statistics of CPI-food and exchange rates of all six countries (Appendix Tables A.2 and A.3) indicate that the statistical properties of the series were not the same across countries. While volatility in the CPI-food measured by standard deviation was highest for Brazil, it was the lowest for Thailand. The Sri Lankan rupee exhibited the highest volatility, while volatility in the Chinese yuan was the least. Before estimating the transmission elasticity through the ECM model, the stationarity property of the time series variables was tested by conducting unit root tests. The Augmented Dickey-Fuller (ADF) and Phillips-Perron (PP) tests were used to test the stationarity of the series. All variables of interest were found to be stationary in the first difference, i.e. I (1) (Tables 2 and 3). Given that all the variables were I(1), Johansen’s cointegration test was performed which confirmed the presence of one cointegrating relationship between the international food prices and domestic food prices of individual countries based on maximum eigen value and trace tests. Subsequently, vector error correction models (VECM), with optimal lag lengths based on Akaike Information Criteria (AIC), were used to examine if any relationship exists in the long run and the short run. The estimated VECM model for each country satisfies the condition that there is no serial correlation in the residuals. V.1. Food Price Pass-through The dynamics of food price pass-through were analysed by estimating long-term coefficients and short-term coefficients using the VECM framework. The short-term and long-term coefficients were obtained from the error correction models and cointegration equations, respectively. The estimated error correction term for each country was found to be negative and statistically significant, implying that the system was not explosive and thus ensured long-run equilibrium (Appendix Table A.4). The pass-through coefficient of world food prices was positive and statistically significant for all six countries, viz. China, Brazil, India, Sri Lanka, Turkey and Thailand (Table 4). The estimated price transmission elasticities from the VECM confirm the heterogeneity of price transmission across countries but at a lower magnitude. The pass-through coefficient ranged from 0.02 to 0.16 and the largest value 0.16 was found for Turkey. The results of the study are in line with the empirical findings of Selliah et al. (2015) and Sivabalasingam (2018). In the case of India, the short-term price transmission elasticity for food price is 0.07, which implies that a 10 per cent increase in world food prices could lead to an increase of 0.7 per cent in Indian food CPI. The long-term transmission elasticities were obtained from the estimated cointegrating equations. There was a high degree of heterogeneity in the pass-through of world food prices to domestic food prices. The long-term transmission elasticity of world food price ranged from a low of 0.25 for China to a high of 1.97 for Brazil (Appendix Table A.5). 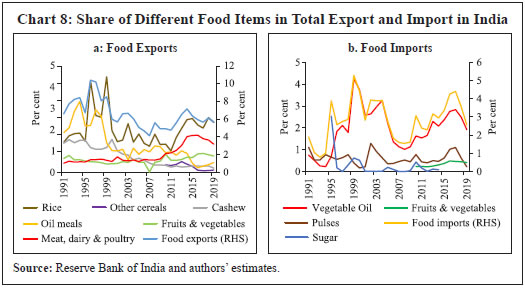 The heterogeneity in the degree of pass-through of international food prices to domestic prices could be due to divergences in the import of food items across countries. For example, a muted pass-through for India could be reflective of a very low share of food imports to total imports (Chart 8). The share of import of three major food items, viz. vegetable oil, pulses, and fruits and vegetables, was very low at 2.6 per cent of total imports in 2018-19. India’s export of major food items was 5.0 per cent of total exports in 2018-19. However, during periods of a very sharp increase in international food prices of more than 20 per cent or so, as witnessed during 2007-08 and 2010-11, the transmission elasticity of 0.07 could lead to an increase in domestic food prices by over 1.0 per cent. This, therefore, signifies the need for examination of the extent of the pass-through from international to domestic prices for it might have serious implications for domestic inflation in EMEs when global prices witness sudden shocks. Such an examination would help these economies to respond with appropriate policies. The main objective of this paper was to examine, in a cross-country context, the following: (i) the degree of pass-through of global food price variations to domestic food prices; and (ii) whether a long-run relationship exists between global food prices and domestic food prices. Using cointegration tests, the paper found that while there exists a significant degree of global food price transmission to domestic prices in the long-run, such pass-through is relatively weak in the short-run. The short-run price transmission elasticities are of lower magnitude, ranging from 0.02 to 0.16, and differ across countries. The long-run transmission elasticities of world food prices range from 0.25 to 1.97. As the weight of food is substantial in the CPI baskets of many EMEs, it is crucial that authorities design appropriate policy measures to limit the impact of high and volatile international food prices on domestic markets. Moreover, countries with a high degree of transmission need to shift policy attention towards ensuring food security by increasing food production, investing in agricultural research, facilitating grain trade, and promoting diversification. While the study signifies the importance of monitoring the impact of global food prices on domestic prices at an aggregate level, it may be useful to examine pass-through at the commodity level as well to further explore the cross-country variations in pass-through. References Ardeni, P. G. (1989). Does the law of one price really hold for commodity prices? American Journal of Agricultural Economics, 71(3), 661-69. Al-Eyd, A., Amaglobeli, D., Shukurov, B., & Sumlinski, M. (2012). Global food price inflation and policy responses in Central Asia. IMF Working Paper, WP/12/86. Barahona, J. F., & Chulaphan, W. (2017). Price transmission between world food prices and different consumer food price indices in Thailand. Kasetsart Journal of Social Sciences. https://www.sciencedirect.com/science/article/pii/S2452315117300206?via%3Dihub. Bhattacharya, R., & Sen Gupta, A. (2017). Drivers and impact of food inflation in India. Munich Personal RePEc Archive, No. 88721. https://mpra.ub.unimuechen.de/88721 Cachia, F. (2014). Regional food price inflation transmission. ESS Working Paper No. 14-01. FAO Statistics Division. http://www.fao.org/3/a-i3718e.pdf Dawe, D. (2008). Have recent increases in international cereal prices been transmitted to domestic economies? The experience in seven large Asian countries. ESA Working Paper No. 08-03. Agricultural Development Economics Division, FAO. http://www.fao.org/3/a-ai506e.pdf Furceria, D., Lounganib, P., Simonc, J., & Wachterd. S. M. (2016). Global food prices and domestic inflation: Some cross-country evidence. Oxford Economic Papers, 68(3), 665-87. Gomez Lopez, A. S., & Ortiz Gallardo, M. A. (2013). Transmission of international food price changes to Mexican markets. http://www.sobremexico.mx/conference/past.php?getfile=5&h=8a98fbf9f364aa2f0ad7c5744f8e8214. Ianchovichina, E., J. Loening, & Wood, C. (2012). How vulnerable are Arab countries to global food price shocks? World Bank Policy Research Working Paper Series 6018, World Bank, Washington, DC. Imai, K., Gaiha, R., & Thapa, G. (2008). Transmission of world commodity prices to domestic commodity prices in India and China. Brooks World Poverty Institute (BWPI) Working Paper No. 45, BWPI, Manchester. International Monetary Fund (IMF). (2011a). Target what you can hit: Commodity price swings and monetary policy. World Economic Outlook: Slowing growth rising risks, September 2011. Washington, DC: IMF. —. (2011b). Regional Economic Outlook, April 2011, Western Hemisphere: Watching out for overheating. Washington, DC: IMF. Jalil, M., & Tamayo Zea, E. (2011). Pass-through of international food prices to domestic inflation during and after the great recession: Evidence from a set of Latin American economies. Development and Society Magazine, (67), 135-179. Laborde, D., Lakatos, C., & Martin, W. (2019). Poverty impact of food price shocks and policies. Policy Research Working Paper No. 8724, World Bank. Lee, H. H., & Park, C. Y. (2013). International transmission of food prices and volatilities: A panel analysis. Asian Development Bank Economics Working Paper Series 373. http://dx.doi.org/10.2139/ssrn.2323056 Minot, N. (2011). Transmission of world food price changes to markets in Sub-Saharan Africa. IFPRI Discussion Paper 1059, International Food Policy Research Institute, Washington, DC. Mishra, P., & Roy, D. (2012). Explaining inflation in India: The role of food prices. India Policy Forum, 8, 139-224. Rajmal & Misra, S. (2009). Transmission from international food prices to domestic food Prices: The Indian evidence. RBI Staff Studies, 6/2009. Reserve Bank of India (RBI). (2019). International food prices – Pass-through to EMEs. Monetary Policy Report-October 2019. 70-71 Selliah, S., Applanaidu, S., & Hassan, S. (2015). Transmission of global food prices to domestic prices: Evidence from Sri Lanka. Asian Social Science, 11(12), 215-228. Sharma, R. (2003). The transmission of world price signals: The concept, issues, and some evidence from Asian cereal markets. Agricultural Trade and Poverty: Making Policy Analysis Count. Paris: Organisation for Economic Co-operation and Development. Shittu, A., Akerele, D., & Haile, M. (2017). Food price spikes and volatility in local food markets in Nigeria. ZEF Discussion Papers on Development Policy No. 242. Sivabalasingam, V. (2018). Global food price transmission to domestic prices in South Asia (Master’s thesis), University of Oslo, Oslo. World Bank. (2019). Commodity markets outlook. Special focus. Food price shocks: Channels and implications. April. Washington, DC. Appendix * Satyananda Sahoo (ssahoo@rbi.org.in), Sujeesh Kumar (sujeeshks@rbi.org.in) and Barkha Gupta (barkhagupta@rbi.org.in) are Director, Assistant Adviser, and Manager, respectively, in the Monetary Policy Department, Reserve Bank of India (RBI). The authors are grateful to Sitikantha Pattanaik, Binod Bhoi and an anonymous referee for their valuable comments/ suggestions. We thank participants for their comments in the DEPR Study Circle seminar conducted at the RBI. The views expressed in the paper are those of the authors and not necessarily of the institution to which they belong. 1 The Reserve Bank followed a glide path to bring down inflation in a phased manner – 8.0 per cent by January 2015; 6.0 per cent by January 2016 and 5.0 per cent by Q4:2016-17. 2 Refers to as the two episodes of unprecedented global food price spike. 3 The methodology used in this paper is from the authors’ earlier work (RBI, 2019). |

Share this page:


Install the RBI mobile application and get quick access to the latest news!
Scan the QR code to install our app


Page Last Updated on: September 12, 2023


