Preliminary data on India’s balance of payments (BoP) for the second quarter (Q2) i.e., July-September 2009 of the financial year 2009-10, are now available. These preliminary data and the partially revised data for the first quarter (Q1) i.e., April-June 2009, have been taken into account for compiling the BoP data for the first half of the current financial year i.e., April-September 2009. Full details of these data are set out in the standard format of BoP presentation in Statements I and II.
As per the revision policy, the data on India’s BoP for previous two years are revised only once in a year when the data of July-September quarter are published in end-December (i.e., December 31). For example, the data for the financial years 2007-08 and 2008-09 have been revised now. The data for 2007-08 is now final and is frozen, except in extraordinary circumstances in the event of methodological changes in respect of data collection and compilation procedures and/or significant changes indicated by data sources that could cause structural shift in the data series. The data for the financial year 2008-09 is now partially revised. This will be finalized and frozen in December 2010. Data revisions for the previous quarters of the same financial year are also undertaken while compiling data for the current quarter. Accordingly, the revisions of the data on BoP for the first quarter of 2009-10 have been undertaken.
1. Major Highlights
-
Growth in exports and imports continued their declining trend during Q2 of 2009-10.
-
Trade deficit, however, was lower reflecting larger fall in imports, especially oil imports, on account of lower oil prices as compared to last year.
-
Private transfer receipts continued to be sustained through Q2 of 2009-10. Software services exports, however, were lower.
-
Despite lower trade deficit, current account deficit at US$ 12.6 billion in Q2 of 2009-10 was almost at the same level as last year, mainly on account of lower net invisibles surplus. During April-September 2009, the current account deficit stood higher at US$ 18.6 billion.
-
Net capital flows were higher during April-September 2009 mainly driven by foreign investment inflows, particularly reflecting the turnaround in FII inflows. NRI deposits also witnessed higher inflows.
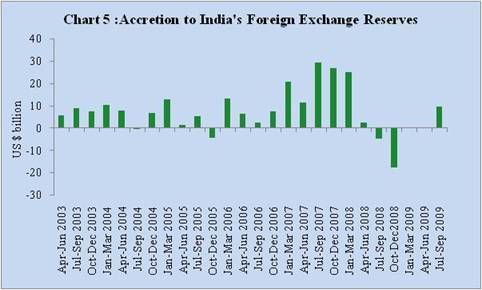
- Higher capital inflows along with the allocations of SDRs by the IMF resulted in an increase in the India’s foreign exchange reserves by US$ 9.5 billion on a BoP basis (i.e. excluding valuation) during April-September 2009. Including the valuation changes, the increase in reserves was higher at US$ 29.3 billion during the same period.
2. Balance of Payments (BoP) for July-September (Q2) of 2009-10
The major items of the BoP for Q2 of 2009-10 are set out below in Table 1.
Table 1 : Major Items of India's Balance of Payments |
(US $ million) |
Item |
April-June |
July-September |
2008-09 (PR) |
2009-10 (PR) |
2008-09 (PR) |
2009-10 (P) |
1 |
2 |
3 |
4 |
5 |
1. Exports |
57,454 |
38,789 |
53,630 |
42,350 |
2. Imports |
82,731 |
64,804 |
92,752 |
74,552 |
3. Trade Balance (1-2) |
-25,277 |
-26,016 |
-39,121 |
-32,201 |
4. Invisibles, net |
22,003 |
20,022 |
26,546 |
19,576 |
5. Current Account Balance (3+4) |
-3,274 |
-5,993 |
-12,575 |
-12,625 |
6. Capital Account* |
5,509 |
6,108 |
7,841 |
22,043 |
7. Change in Reserves#
(-Indicates increase; + indicates decrease) |
-2,235 |
-115 |
4,734 |
-9,418 |
*: Including errors and omissions. #: On BoP basis (i.e., excluding valuation).
P: Preliminary. PR: Partially Revised. |
Merchandise Trade
-
The decline in exports which started since October 2008 continued during the second quarter of 2009-10. On a BoP basis, India’s merchandise exports recorded a decline of 21.0 per cent in Q2 of 2009-10 as against an increase of 39.6 per cent in Q2 of 2008-09.
-
Import payments, on a BoP basis, registered a decline of 19.6 per cent in Q2 of 2009-10 as against a higher growth of 54.8 per cent in the corresponding period of last year.
-
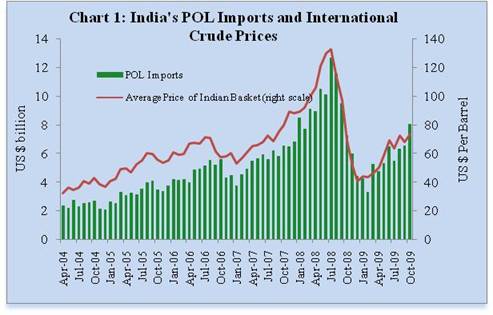
According to the data released by the Directorate General of Commercial Intelligence and Statistics (DGCI&S), both oil imports and non-oil imports witnessed a decline during Q2 of 2009-10 by 45.7 per cent and 27.5 per cent, respectively. The decline in oil imports was mainly due to significant decline in oil prices to US$ 67.6 per barrel during Q2 of 2009-10 from its peak of US$ 132.5 per barrel in July 2008 (Chart 1). Oil imports in Q2 of 2009-10 accounted for about 28.7 per cent of total imports (35.0 per cent in Q2 of 2008-09).
Trade Deficit
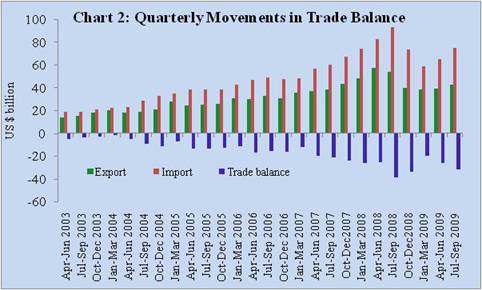
- Trade deficit on a BoP basis was lower at US$ 32.2 billion in Q2 of 2009-10 as compared to US$ 39.1 billion in Q2 of 2008-09 (Chart 2).
Invisibles
-
Invisible receipts, comprising services, current transfers and income, registered a decline of 15.1 per cent in Q2 of 2009-10 (as against a higher growth of 33.1 per cent in Q2 of 2008-09). Major categories of services exports registered a decline during the quarter. Receipts under non-software miscellaneous services including business services, construction and royalties, copy rights and licence fees declined. Private transfers receipts, however, increased by 3.6 per cent during the quarter.
-
Invisible payments recorded a marginal increase during Q2 of 2009-10 mainly on account of payments under business and financial services.
-
Net invisibles (invisibles receipts minus invisibles payments) turned out to be lower at US $ 19.6 billion in Q2 of 2009-10 (US $ 26.5 billion in Q2 of 2008-09) mainly due to decline in services exports, particularly non-software services receipts (Table 2). At this level, net invisibles surplus financed 60.8 per cent of trade deficit in Q2 of 2009-10 (67.9 per cent in Q2 of 2008-09).
|
(US $ million) |
Item |
April-June |
July-September |
2008-09 (PR) |
2009-10 (PR) |
2008-09 (PR) |
2009-10 (P) |
1 |
2 |
3 |
4 |
5 |
A. Services (1 to 5) |
10,710 |
9,098 |
14,400 |
6,273 |
1.Travel |
341 |
282 |
75 |
126 |
2.Transportation |
-713 |
-287 |
-710 |
346 |
3.Insurance |
123 |
73 |
71 |
43 |
4. Govt. not included elsewhere |
19 |
-3 |
-14 |
-29 |
5. Miscellaneous |
10,940 |
9,033 |
14,978 |
5,787 |
Of Which: |
|
|
|
|
Software |
11,237 |
10,373 |
11,185 |
10,207 |
Non-Software |
-297 |
-1,340 |
3,793 |
-4,420 |
B. Transfers |
12,143 |
12,878 |
12,942 |
13,702 |
Private |
12,102 |
12,939 |
12,988 |
13,757 |
Official |
40 |
-61 |
-46 |
-54 |
C. Income |
-849 |
-1,953 |
-796 |
-399 |
Investment Income |
-676 |
-1,843 |
-755 |
-248 |
Compensation of Employees |
-174 |
-110 |
-41 |
-152 |
Invisibles (A+B+C) |
22,003 |
20,022 |
26,546 |
19,576 |
P: Preliminary. PR: Partially Revised. |
Current Account Deficit
- Despite lower trade deficit, current account deficit at US$ 12.6 billion in Q2 of 2009-10 was almost at the same level as last year, mainly on account of lower net invisibles surplus. The invisibles surplus, however, continued to be driven by private transfers and software exports.
Capital Account and Reserves
- Both gross capital inflows and outflows remained strong during Q2 of 2009-10. The gross capital inflows to India during Q2 of 2009-10 amounted to US $ 98.1 billion (US $ 90.0 billion in Q2 of 2008-09) mainly on account higher foreign investment inflows of US$ 55.8 billion.
- Net capital flows were also substantially higher at US $ 23.6 billion in Q2 of 2009-10 than that of US $ 7.1 billion in Q2 of 2008-09 mainly due to large net foreign investment inflows and SDR allocations by the IMF during the quarter (Table 3).
Table 3: Net Capital Flows |
(US $ million) |
Item |
April-June |
July-September |
2008-09 (PR) |
2009-10 (PR) |
2008-09 (PR) |
2009-10 (P) |
1 |
2 |
3 |
4 |
5 |
1.Foreign Direct Investment |
8,964 |
7,025 |
4,903 |
7,116 |
Inward FDI |
11,876 |
9,651 |
8,778 |
11,326 |
Outward FDI |
2,912 |
2,626 |
3,876 |
4,209 |
2.Portfolio Investment |
-4,207 |
8,268 |
-1,311 |
9,678 |
Of which |
|
|
|
|
FIIs |
-5,177 |
8,227 |
-1,437 |
7,038 |
ADRs/GDRs |
999 |
43 |
136 |
2,664 |
3.External Assistance |
351 |
84 |
518 |
487 |
4.External Commercial Borrowings |
1,479 |
-441 |
1,687 |
1,186 |
5. NRI Deposits |
814 |
1,817 |
259 |
1,047 |
6. Banking Capital excluding NRI Deposits |
1,882 |
-5,183 |
2,016 |
3,376 |
7. Short-term Trade Credits |
4,503 |
-1,463 |
402 |
845 |
8. Rupee Debt Service |
-30 |
-23 |
-3 |
-1 |
9. Other Capital* |
-8,904 |
-4,131 |
-1372 |
-121 |
Total (1 to 9) |
4,853 |
5,955 |
7,099 |
23,613 |
P: Preliminary. PR: Partially Revised. *: SDR allocations are included. |
- Foreign direct investments (FDI) broadly comprise equity, reinvested earnings and inter-corporate loans. Net FDI flows (net inward FDI minus net outward FDI) were higher at US $ 7.1 billion in Q2 of 2009-10 as compared with US $ 4.9 billion in Q2 of 2008-09. Net inward FDI remained buoyant at US $ 11.3 billion during Q2 of 2009-10 (US $ 8.8 billion in Q2 of 2008-09) reflecting relatively better growth prospects of the Indian economy. Net outward FDI amounted to US $ 4.2 billion in Q2 of 2009-10 (US $ 3.9 billion in Q2 of 2008-09).
- Portfolio investment primarily comprising foreign institutional investors’ (FIIs) investments and American Depository Receipts (ADRs)/Global Depository Receipts (GDRs) continued their strong upward trend to record a net inflow of US $ 9.7 billion in Q2 of 2009-10 (as against net outflows of US $ 1.3 billion in Q2 of 2008-09) mainly due to revival of FII inflows since the Q1 of 2009-10. Inflows under portfolio investment were led by large purchases of equities (amounting to US$ 7.0 billion during Q2 of 2009-10) by FIIs in the Indian stock market and revival in net inflows under ADRs/GDRs due to growth of stock prices of Indian companies.
- According to the guidelines given in the Sixth Edition of the Balance of Payments Manual (BPM6) of the International Monetary Fund (IMF), allocations under special drawing rights (SDR) are treated as liabilities to nonresidents (foreign liabilities) and reported as liabilities under other investments of the financial account of the balance of payments. Accordingly, a general allocation of SDRs 3,082.5 million on August 28, 2009 and a special allocation of SDRs 214.6 million together amounting to US$ 5.2 billion is included in the ‘other capital’ of the capital account of the balance of payments for Q2 of 2009-10. The allocations have a debit entry in the reserve assets of the balance of payments showing an equal amount of increase in the foreign exchange reserves.
- Foreign exchange reserves, on BoP basis (i.e., excluding valuation) have shown an accretion of US $ 9.4 billion in Q2 of 2009-10 as against a decline in reserves of US $ 4.7 billion in Q2 of 2008-09. The increase in the reserves was mainly due to large capital inflows and SDR allocations by the IMF.
4. Balance of Payments (BoP) for April-September 2009
- As alluded to earlier, taking into account the partially revised data for Q1 of 2009-10 and the preliminary data for Q2 of 2009-10, the BoP data for the first half of the financial year 2009-10 (April-September) have been compiled. While the detailed data are set out in Statements I and II in standard format of BoP presentation, the major items are presented in Table 4.
Table 4: Major Items of India's Balance of Payments: April-September 2009 |
(US $ million) |
Item |
April-March |
April-September |
2007-08 (R) |
2008-09 (PR) |
2008-09 (PR) |
2009-10 (P) |
1 |
2 |
3 |
4 |
5 |
1. Exports |
166,162 |
189,001 |
111,085 |
81,139 |
2. Imports |
257,629 |
307,651 |
175,483 |
139,356 |
3. Trade Balance (1-2) |
-91,467 |
-118,650 |
-64,398 |
-58,217 |
4. Invisibles, net |
75,731 |
89,923 |
48,549 |
39,599 |
5. Current Account Balance (3+4) |
-15,737 |
-28,728 |
-15,849 |
-18,618 |
6. Capital Account* |
107,901 |
8,648 |
13,350 |
28,151 |
7. Change in Reserves#
(-Indicates increase;+ indicates decrease) |
-92,164 |
20,080 |
2,499 |
-9,533 |
*: Including errors and omissions. #: On BoP basis (i.e., excluding valuation).
P: Preliminary. PR: Partially Revised. R: Revised. |
Merchandise Trade
-
On a BoP basis, India’s merchandise exports posted a decline of 27.0 per cent in April-September 2009 (as against a growth of 48.1 per cent in the corresponding period of the previous year).
-
Import payments, on a BoP basis, declined by 20.6 per cent during April-September 2009 as against a sharp increase of 51.0 per cent in the corresponding period of the previous year. The decline in imports is mainly attributed to the base effect and decline in oil prices.
-
According to the DGCI&S data, oil imports recorded a decline of 45.0 per cent in April-September 2009 as against a significant rise of 83 per cent during April-September 2008. During the same period, non-oil imports showed a relatively modest decline of 26.3 per cent (as against an increase of 43.8 per cent in April-September 2008). In absolute terms, the oil imports accounted for about 26 per cent of total imports during April-September 2009 (34.2 per cent in the corresponding period of the previous year).
-
According to the data released by the Gem & Jewellery Export Promotion Council, total import of gems and jewellery declined by 12 per cent during April-September 2009 as against an increase of 33.6 per cent during the corresponding period of last year.
Trade Deficit
- On a BoP basis, the merchandise trade deficit remained lower at US $ 58.2 billion during April-September 2009 as compared with US $ 64.4 billion in April-September 2008 mainly on account of decline in oil import (Chart 2).
Invisibles
Invisibles Receipts
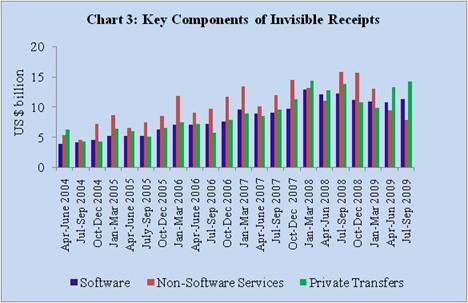
(i) Invisible receipts recorded a decline of 11.6 per cent during April-September 2009 as compared with an increase of 32.5 per cent in the corresponding period of the previous year, mainly attributed to the lower receipts under almost all components of services (Table 5 and Chart 3). However, the private transfers receipts, which had marginally declined during the second half of 2008-09, increased by 4.3 per cent in the first half of 2009-10.
Table 5: Invisibles Gross Receipts and Payments |
(US$ million) |
Item |
Invisibles Receipts |
Invisibles Payments |
| |
April-March |
April-September |
April-March |
April-September |
| |
2007-08
(R) |
2008-09
(PR) |
2008-09
(PR) |
2009-10
(P) |
2007-08
(R) |
2008-09
(PR) |
2008-09
(PR) |
2009-10
(P) |
1 |
2 |
3 |
4 |
5 |
6 |
7 |
8 |
9 |
A. Services (1 to 5) |
90,342 |
101,678 |
50,979 |
40,057 |
51,490 |
52,047 |
25,870 |
24,686 |
1.Travel |
11,349 |
10,894 |
5,290 |
4,805 |
9,258 |
9,425 |
4,874 |
4,397 |
2.Transportation |
10,014 |
11,286 |
5,656 |
5,056 |
11,514 |
12,820 |
7,079 |
4,998 |
3.Insurance |
1,639 |
1,419 |
727 |
771 |
1,044 |
1,130 |
533 |
655 |
4.Govt. not included
elsewhere |
331 |
389 |
211 |
200 |
376 |
793 |
206 |
232 |
5.Miscellaneous |
67,010 |
77,691 |
39,095 |
29,225 |
29,298 |
27,879 |
13,177 |
14,404 |
Of Which: |
|
|
|
|
|
|
|
|
Software |
40,300 |
46,300 |
24,201 |
21,409 |
3,358 |
2,814 |
1,778 |
829 |
Non-Software |
26,710 |
31,391 |
14,894 |
7,816 |
25,940 |
25,065 |
11,398 |
13,575 |
B. Transfers |
44,261 |
47,547 |
26,570 |
27,612 |
2,316 |
2,749 |
1,485 |
1,032 |
Private |
43,508 |
46,903 |
26,371 |
27,515 |
1,802 |
2,336 |
1,281 |
820 |
Official |
753 |
645 |
199 |
97 |
514 |
413 |
204 |
212 |
C. Income |
14,272 |
14,309 |
7,718 |
7,700 |
19,339 |
18,816 |
9,363 |
10,052 |
Investment Income |
13,811 |
13,483 |
7,273 |
7,267 |
18,244 |
17,506 |
8,704 |
9,358 |
Compensation of Employees |
461 |
825 |
445 |
433 |
1,095 |
1,309 |
659 |
695 |
Invisibles (A+B+C) |
148,875 |
163,534 |
85,267 |
75,368 |
73,144 |
73,612 |
36,718 |
35,770 |
P: Preliminary. PR: Partially Revised. R: Revised. |
Note: Details of Non-software services under Miscellaneous (Item 5) are given in Table 8. |
(ii) Private transfers are mainly in the form of (i) Inward remittances from Indian workers abroad for family maintenance, (ii) Local withdrawal from Non-Resident Indian Rupee deposits, (iii) Gold and silver brought through passenger baggage, and (iv) Personal gifts/donations to charitable/religious institutions.
(iii) Private transfer receipts, comprising mainly remittances from Indians working overseas, increased to US $ 27.5 billion in April-September 2009 as compared with US $ 26.4 billion in the corresponding period of the previous year. Private transfer receipts constituted 17.6 per cent of current receipts in April-September 2009 (13.4 per cent in the corresponding period of the previous year).
(iv) NRI deposits, when withdrawn domestically, form part of private transfers because once withdrawn for local use these become unilateral transfers and do not have any quid pro quo. Such local withdrawals/redemptions from NRI deposits cease to exist as liability in the capital account of the balance of payments and assume the form of private transfers, which is included in the current account of balance of payments.
(v) Under the NRI deposits, both inflows as well as outflows remained steady in the recent past. A major part of outflows from NRI deposits is in the form of local withdrawals. These withdrawals, however, are not actually repatriated but are utilised domestically. During April-September 2009, the share of local withdrawals in total outflows from NRI deposits was 63.4 per cent as compared with 64.9 per cent in April-September 2008 (Table 6).
Table 6: Inflows and Outflows from NRI Deposits and Local Withdrawals |
(US $ million) |
Year |
Inflows |
Outflows |
Local Withdrawals |
1 |
2 |
3 |
4 |
2007-08 (R) |
29,400 |
29,222 |
18,919 |
2008-09 (PR) |
37,147 |
32,858 |
20,617 |
April-September 2008 (PR) |
18,274 |
17,202 |
11,168 |
April-September 2009 (P) |
21,513 |
18,649 |
11,818 |
R: Revised. P: Preliminary. PR: Partially Revised. |
(vi) Under Private transfers, the inward remittances for family maintenance accounted for 53.3 per cent of the total private transfer receipts, while local withdrawals accounted for 43.0 per cent in April-September 2009 as against 52.6 per cent and 42.3 per cent, respectively, in April-September 2008 (Table 7).
Table 7: Details of Private Transfers to India |
(US $ million) |
Year
|
Total
Private Transfers |
Of Which: |
Inward remittances
for family maintenance |
Local withdrawals/redemptions from NRI Deposits |
Amount |
Percentage Share in Total |
Amount |
Percentage
Share in Total |
1 |
2 |
3 |
4 |
5 |
6 |
2007-08 (R) |
43,508 |
21,922 |
50.4 |
18,919 |
43.5 |
2008-09 (PR) |
46,903 |
23,886 |
50.9 |
20,617 |
44.0 |
April-September 2008 (PR) |
26,371 |
13,882 |
52.6 |
11,168 |
42.3 |
April-September 2009 (P) |
27,515 |
14,677 |
53.3 |
11,818 |
43.0 |
R: Revised. P: Preliminary. PR: Partially Revised. |
(vii) Software receipts at US $ 21.4 billion in April-September 2009 showed a decline of 11.5 per cent as against a higher growth of 35.3 per cent in April-September 2008.
(viii) Miscellaneous receipts, excluding software exports, stood at US $ 7.8 billion in April-September 2009 (US $ 14.9 billion in April-September 2008). Receipts under non-software miscellaneous services like business services, construction and royalties, copy rights and licence fees declined. The break-up of these data is presented in Table 8.
Table 8: Break-up of Non-Software Receipts and Payments under Miscellaneous Services |
(US$ million) |
Item |
Receipts |
Payments |
April-March |
April-September |
April-March |
April-September |
2007-08
(R) |
2008-09
(PR) |
2008-09
(PR) |
2009-10
(P) |
2007-08
(R) |
2008-09
(PR) |
2008-09
(PR) |
2009-10
(P) |
1 |
2 |
3 |
4 |
5 |
6 |
7 |
8 |
9 |
1.Communication |
2,408 |
2,172 |
1,250 |
725 |
860 |
1087 |
523 |
625 |
2. Construction |
763 |
867 |
372 |
299 |
708 |
896 |
349 |
641 |
3. Financial |
3,217 |
3,948 |
2,288 |
1,849 |
3,133 |
2,958 |
1,586 |
2,062 |
4.News Agency |
503 |
800 |
397 |
172 |
506 |
386 |
165 |
162 |
5.Royalties, Copyrights
& License Fees |
157 |
132 |
71 |
116 |
1,038 |
1,721 |
805 |
823 |
6. Business Services |
16,772 |
16,445 |
8,410 |
5,090 |
16,553 |
15,435 |
7,251 |
8,477 |
7.Personal, Cultural,
and Recreational |
562 |
729 |
297 |
234 |
211 |
322 |
173 |
147 |
8.Others |
2,328 |
6,298 |
1,809 |
-669 |
2,931 |
2,260 |
546 |
638 |
Total (1 to 8) |
26,710 |
31,391 |
14,894 |
7,816 |
25,940 |
25,065 |
11,398 |
13,575 |
P: Preliminary; PR: Partially Revised; R: Revised.
Note: Details of Business Services (item 6) are given in Table 9. |
(ix) The key components of the business services receipts and payments were mainly the trade related services, business and management consultancy services, architectural, engineering and other technical services and services relating to maintenance of offices (Table 9). Under business services, receipts of architectural, engineering and other technical services, maintenance of offices abroad and business and management consultancy services declined while payments related to these services rose moderately resulting in decline in net exports of these services.
(x) Investment income receipts amounted to US $ 7.3 billion in April-September 2009 and remained almost at same level of last year.
Table 9: Details of Business Services |
(US$ million) |
Item |
Receipts |
Payments |
April-March |
April-September |
April-March |
April-September |
2007-08
(R) |
2008-09
(PR) |
2008-09
(PR) |
2009-10
(P) |
2007-08
(R) |
2008-09
(PR) |
2008-09
(PR) |
2009-10
(P) |
1 |
2 |
3 |
4 |
5 |
6 |
7 |
8 |
9 |
1. Trade Related |
2,234 |
2,016 |
1,150 |
675 |
2,285 |
1,651 |
828 |
1,036 |
2.Business & Management
Consultancy |
4,433 |
5,017 |
2,605 |
1,791 |
3,422 |
3,530 |
1,355 |
2,324 |
3.Architectural, Engineering, and other Technical
Services |
3,145 |
1,766 |
903 |
655 |
3,090 |
3,130 |
1,498 |
1,939 |
4.Maintenance of
Offices abroad |
2,861 |
2,984 |
1,269 |
704 |
2,761 |
2,673 |
1,150 |
1,152 |
5.Others |
4,099 |
4,662 |
2,483 |
1,265 |
4,995 |
4,451 |
2,420 |
2,026 |
Total (1 to 5) |
16,772 |
16,445 |
8,410 |
5,090 |
16,553 |
15,435 |
7,251 |
8,477 |
P: Preliminary. PR: Partially Revised. R:Revised |
Invisibles Payments
-
Invisible payments have also shown a decline of 2.6 per cent in April-September 2009 (an increase of 15.0 per cent in April-September 2008). The invisibles payments declined mainly due to lower payment towards travel, transportation, non-software services and private transfers.
-
Lower transportation payments in April-September of 2009 (a decline of 29.4 per cent) mainly reflected the lower volume of imports. In addition, lower payments may also be attributed to the lower freight rates on international shipping as compared to corresponding period of last year.
-
Investment income payments, reflecting mainly the interest payments on commercial borrowings, external assistance, non-resident deposits, and reinvested earnings of the foreign direct investment (FDI) enterprises operating in India, amounted to US $ 9.4 billion in April-September 2009 higher than that of April-September 2008 (Table 10). The increase in investment income payments was mainly due to rise in reinvestment earnings of the FDI companies.
Table 10: Details of Receipts and Payments of Investment Income |
(US $ million) |
Item |
April-March |
April-September |
2007-08 (R) |
2008-09 (PR) |
2008-09 (PR) |
2009-10 (P) |
1 |
2 |
3 |
4 |
5 |
| A. Receipts |
13,811 |
13,483 |
7,273 |
7,267 |
Of which: |
| 1. Reinvested Earnings on Indian Investment Abroad |
1,084 |
1,084 |
542 |
542 |
| 2. Interest/discount Earnings on Foreign exchange reserves |
10,124 |
10,480 |
5,849 |
3,925 |
| B. Payments |
18,244 |
17,506 |
8,704 |
9,358 |
Of which: |
|
|
|
|
| 1. Interest Payment on NRI deposits |
1,813 |
1,547 |
735 |
796 |
| 2. Interest Payment on ECBs |
2,647 |
2,702 |
1,407 |
812 |
| 3. Interest Payments on External Assistance |
1,143 |
1,010 |
505 |
438 |
4. Dividends and Profits |
3,226 |
3,172 |
2,153 |
2,246 |
5. Reinvested Earnings of FDI
Companies in India |
7,679 |
6,428 |
2,98 5 |
3,831 |
| C. Net Investment Income (A-B) |
-4,433 |
-4,023 |
-1,431 |
-2,091 |
P: Preliminary. PR: Partially Revised. R: Revised. |
Invisibles Balance
- Net invisibles (invisibles receipts minus invisibles payments) stood lower at US $ 39.6 billion during April-September of 2009 as compared to US$ 48.5 billion during April-September 2008. At this level, the invisible surplus financed about 68.0 per cent of trade deficit during April-September 2009 as against 75.4 per cent during April-September 2008.
Current Account Deficit
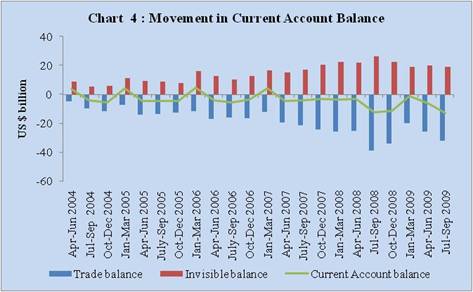
- Despite lower trade deficits, current account deficit increased to US $ 18.6 billion in April-September 2009 from US $ 15.8 billion in April-September 2008 mainly due to lower net invisible surplus (Chart 4).
Capital Account
(i) The gross capital inflows to India during April-September 2009 amounted to US $ 175.3 billion (US $ 184.4 billion in April-September 2008) as against an outflow of US $ 145.8 billion (US $ 172.5 billion in April-September 2008) (Table 11).
(ii) Net capital flows, however, at US $ 29.6 billion in April-September 2009 remained higher as compared with US $ 12.0 billion in April-September 2008. Under net capital flows, all the components except loans and banking capital, showed improvement during April-September 2009 from their level in the corresponding period of the previous year (Table 12). In banking capital, net inflows under non-residents’ deposit remained higher during April-September 2009 as compared to their level last year.
(iii) Net inward FDI into India remained buoyant at US $ 21.0 billion during April-September 2009 (US $ 20.7 billion in April-September 2008) reflecting the continuing liberalisation and better growth performance of the Indian economy. During this period, FDI was channeled mainly into manufacturing (21.4 per cent) followed by communication services (12.8 per cent) and real estate sector (12.6 per cent). Net outward FDI of India at US $ 6.8 billion in April-September 2009 remained almost at the same level of the corresponding period of the last year. Due to large inward FDI, the net FDI (inward FDI minus outward FDI) was marginally higher at US$ 14.1 billion in April-September 2009.
Table 11: Gross Capital Inflows and Outflows |
(US$ million) |
Item |
Gross Inflows |
Gross Outflows |
April-March |
April-September |
April-March |
April-September |
2007-08 |
2008-09 |
2008-09 |
2009-10 |
2007-08 |
2008-09 |
2008-09 |
2009-10 |
(R) |
(PR) |
(PR) |
(P) |
(R) |
(PR) |
(PR) |
(P) |
1 |
2 |
3 |
4 |
5 |
6 |
7 |
8 |
9 |
1. Foreign Direct Investment |
37,321 |
36,261 |
21,280 |
21,262 |
21,429 |
18,763 |
7,413 |
7,120 |
2. Portfolio Investment
|
233,800 |
128,654 |
83,398 |
82,985 |
206,367 |
142,685 |
88,916 |
65,040 |
| Of which: |
|
|
|
|
|
|
|
|
FIIs |
226,621 |
127,349 |
82,228 |
80,252 |
206,294 |
142,366 |
88,842 |
64,987 |
ADR/GDRs |
6,645 |
1,162 |
1,135 |
2,707 |
- |
- |
- |
- |
3. External Assistance |
4,241 |
5,041 |
2,004 |
2,057 |
2,126 |
2,405 |
1,135 |
1,486 |
4. External Commercial
Borrowings |
30,293 |
15,244 |
6,332 |
5,168 |
7,684 |
7,303 |
3,166 |
4,424 |
5. NRI Deposits |
29,400 |
37,147 |
18,274 |
21,513 |
29,222 |
32,858 |
17,202 |
18,649 |
6. Banking Capital excluding
NRI Deposits |
26,414 |
28,060 |
20,073 |
10,608 |
14,832 |
35,595 |
16,175 |
12,414 |
7. Short-term Trade Credits |
47,658 |
41,841 |
23,892 |
21,692 |
31,729 |
43,750 |
18,986 |
22,310 |
8. Rupee Debt Service |
0 |
0 |
0 |
0 |
122 |
100 |
32 |
23 |
9. Other Capital |
29,229 |
20,179 |
9,154 |
10,047 |
18,261 |
21,723 |
19,430 |
14,298 |
Total (1 to 9) |
438,357 |
312,427 |
184,407 |
175,333 |
331,772 |
305,181 |
172,455 |
145,765 |
R: Revised P: Preliminary PR: Partially Revised. |
(iv) Portfolio investment mainly comprising foreign institutional investors (FIIs) investments and American depository receipts (ADRs)/global depository receipts (GDRs) witnessed large net inflows (US $ 17.9 billion) in April-September 2009 (net outflows of US $ 5.5 billion in April-September 2008) due to large purchases by FIIs in the Indian capital market reflecting revival in growth prospects of the economy and improvement in global investors’ sentiment. The inflows under ADRs/ GDRs increased to US $ 2.7 billion in April-September 2009 (US $ 1.1 billion in April-September 2008).
Table 12 : Net Capital Flows |
(US $ million) |
Item |
April-March |
April-September |
2007-08 (R) |
2008-09 (PR) |
2008-09 (PR) |
2009-10 (P) |
1 |
2 |
3 |
4 |
5 |
1. Foreign Direct Investment |
15,893 |
17,498 |
13,867 |
14,142 |
Inward FDI |
34,728 |
34,992 |
20,654 |
20,977 |
Outward FDI |
18,835 |
17,495 |
6,788 |
6,835 |
2. Portfolio Investment |
27,433 |
-14,030 |
-5,518 |
17,946 |
| Of which: |
|
|
|
|
FIIs |
20,327 |
-15,017 |
-6,614 |
15,265 |
ADR/GDRs |
6,645 |
1,162 |
1,135 |
2,707 |
3. External Assistance |
2,114 |
2,637 |
869 |
571 |
4. External Commercial Borrowings |
22,609 |
7,941 |
3,166 |
745 |
5. NRI Deposits |
179 |
4,290 |
1,073 |
2,864 |
6. Banking Capital excluding NRI Deposits |
11,580 |
-7,535 |
3,898 |
-1,807 |
7. Short-term Trade Credits |
15,930 |
-1,909 |
4,905 |
-618 |
8. Rupee Debt Service |
-122 |
-100 |
-33 |
-23 |
9. Other Capital |
10,969 |
-1,545 |
-10,276 |
-4,251 |
Total (1 to 9) |
106,585 |
7,246 |
11,952 |
29,568 |
R: Revised. P: Preliminary. PR: Partially Revised.
Note: Details of Other Capital (Item 9) are given in Table 13. |
(v) Net external commercial borrowings (ECBs) inflow remained lower at US $ 0.7 billion in April-September 2009 (US $ 3.2 billion in April-September 2008).
(vi)
Banking capital (net) amounted to US $ 1.1 billion in April-September 2009 as compared with US $ 5.0 billion in April-September 2008. Among the components of banking capital, NRI deposits witnessed higher net inflows of US $ 2.9 billion in April-September 2009 as compared with lower net inflows of US $ 1.1 billion in April-September 2008.
(vii) Short term trade credit recorded a net outflow of US $ 0.6 billion (inclusive of suppliers’ credit up to 180 days) during April-September 2009 as against a net inflow of US $ 4.9 billion during the same period of the previous year.
(viii) Other capital includes leads and lags in exports, SDR allocation, funds held abroad, advances received pending issue of shares under FDI and other capital not included elsewhere (n.i.e). Other capital recorded a lower net outflow of US $ 4.3 billion in April-September 2009 as compared with a higher net outflow of US$ 10.3 billion April-September 2008. The details of other capital are set out in Table 13.
Table 13: Details of ‘Other Capital’ (Net) |
(US $ million) |
Item |
April-March |
April-September |
2007-08
(R) |
2008-09
(PR) |
2008-09
(PR) |
2009-10
(P) |
1 |
2 |
3 |
4 |
5 |
1. Lead and Lags in Exports |
-899 |
-11,866 |
-14,585 |
2,945 |
2. Net Funds Held Abroad |
-2,682 |
320 |
223 |
-5,265 |
3. Advances Received Pending Issue
of Shares under FDI |
7,200 |
3,002 |
2,821 |
-2,689 |
4. SDR Allocation |
- |
- |
- |
5,161 |
5. Other capital not included elsewhere (n.i.e)
(Inclusive of derivatives and hedging, migrant
transfers and other capital transfers) |
7,350 |
6,999 |
1,266 |
4,401 |
Total (1 to 5) |
10,969 |
-1,545 |
-10,276 |
-4,251 |
P: Preliminary. PR: Partially Revised. R: Revised. - : Nil. |
4. Reserves Variation
(i) The accretion in foreign exchange reserves on BoP basis (i.e., excluding valuation) was US $ 9.5 billion in April-September 2009 (as against a decline of US $ 2.5 billion in April-September 2008) (Table 14 & Chart 5). Taking into account the valuation gain, foreign exchange reserves recorded an increase of US $ 29.3 billion in April-September 2009 (as against a decline in reserves of US $ 23.4 billion in April-September 2008). [A Press Release on the sources of variation in foreign exchange reserves is separately issued].
(ii) The IMF had approved a general allocation of Special Drawing Rights (SDRs) for an amount equivalent to US$ 250 billion, which was made on August 28, 2009. In addition, a special SDR allocation pursuant to the fourth amendment of the IMF’s Articles of Agreement, amounting to US $33 billion was made on September 9, 2009. Pursuant to this, a general allocation of SDR 3,082 million (equivalent to US$ 4,821 million) and a special allocation of SDR 214.6 million (equivalent to US$ 340 million) were allocated to India by the IMF on August 28, 2009 and September 9, 2009, respectively. It has resulted in an increase in the India’s foreign exchange reserves by US$ 5.2 billion.
(iii) At the end of September 2009, outstanding foreign exchange reserves stood at US $ 281.3 billion.
Table 14: Sources of Variation to Reserves (BoP Basis) in April-September 2009 |
(US $ million) |
Item |
April-March |
April-September |
2007-08
(R) |
2008-09
(PR) |
2008-09
(PR) |
2009-10
(P) |
1 |
2 |
3 |
4 |
5 |
A. Current Account Balance |
-15,737 |
-28,728 |
-15,849 |
-18,618 |
B. Capital Account* |
107,901 |
8,648 |
13,350 |
28,151 |
Of Which |
|
|
|
|
Foreign Direct Investment |
15,893 |
17,498 |
13,867 |
14,142 |
Portfolio Investment |
27,433 |
-14,030 |
-5,518 |
17,946 |
External Commercial Borrowings |
22,609 |
7,941 |
3,166 |
745 |
Banking Capital |
11,759 |
-3,245 |
4,971 |
1,057 |
Short Term Trade Credits |
15,930 |
-1,909 |
4,906 |
-618 |
| D. Change in Reserves: (-) indicates increase;
(+) indicates decrease)# |
-92,164 |
20,080 |
2,499 |
-9,533 |
*: Including errors and omissions. #: On BoP basis (i.e., excluding valuation).
P: Preliminary. PR: Partially Revised. R: Revised. |
 |
(iv) To sum up, the key features of India’s BoP that emerged in April-September 2009 were: (i) lower trade deficit (US $ 58.2 billion) led by lower oil import bills, (ii) lower net invisible surplus (US $ 39.6 billion) led by lower software services and decline in business services and investment income, (iii) higher current account deficit (US $ 18.6 billion) due to lower net invisibles, (iv) large net capital inflows mainly led by turnaround in FII inflows and steady FDI inflows, and (v) increase in reserves (excluding valuation) of US $ 9.5 billion (as against a decline in reserves of US $ 2.5 billion in April-September 2008) due to large capital inflows and SDRs allocations by the IMF. The details of key indicators are set out in Table 15.
Table 15 : Key Indicators of India’s Balance of Payments |
Item |
April-March |
April-September |
2007-08 |
2008-09 |
2008-09 |
2009-10 |
1 |
2 |
3 |
4 |
5 |
Merchandise Trade |
1. Exports (US $ on BoP basis) Growth Rate (%) |
28.9 |
13.7 |
48.1 |
-27.0 |
2. Imports (US $ on BoP basis) Growth Rate (%) |
35.1 |
19.4 |
51.0 |
-20.6 |
3. Crude Oil Prices, Per Barrel (Indian Basket) |
79.2 |
82.7 |
116.5 |
63.4 |
4. Trade Balance (US $ billion) |
-91.5 |
-118.7 |
-64.4 |
-58.2 |
5. Exports / GDP ( %) |
14.2 |
16.3 |
- |
- |
6. Imports / GDP ( %) |
22.0 |
26.6 |
- |
- |
7. Trade Balance / GDP ( % ) |
-7.8 |
-10.3 |
- |
- |
Invisibles |
8 Net Invisibles (US $ billion) |
75.7 |
89.9 |
48.5 |
39.6 |
9. Net Invisibles Surplus / Trade Deficit (%) |
82.8 |
75.8 |
75.4 |
68.0 |
10. Invisibles Receipts /Current Receipts (%) |
47.3 |
46.4 |
43.4 |
48.2 |
11. Services Receipts / Current Receipts (%) |
28.7 |
28.8 |
26.0 |
25.6 |
12. Private Transfers /Current Receipts (%) |
13.8 |
13.3 |
13.4 |
17.6 |
13. Net Invisibles / GDP ( % ) |
6.5 |
7.8 |
- |
|
14. Private Transfers Receipts / GDP ( % ) |
3.7 |
4.1 |
- |
- |
15. Software exports / GDP (%) |
3.4 |
4.0 |
- |
- |
16. Services (net) / GDP (%) |
3.3 |
4.3 |
|
- |
Current Account |
17. Current Receipts (US $ billion) |
315.0 |
352.5 |
196.4 |
156.5 |
18. Current Payments (US $ billion) |
330.8 |
381.3 |
212.2 |
175.1 |
19. Current Account Balance (US $ billion) |
-15.7 |
-28.7 |
-15.8 |
-18.6 |
20. Current Account Balance / GDP ( % ) |
-1.3 |
-2.5 |
- |
- |
Capital Account |
21. Gross Capital Inflows (US $ billion) |
438.4 |
312.4 |
184.4 |
175.3 |
22. Gross Capital Outflows (US $ billion) |
331.8 |
305.2 |
172.5 |
145.8 |
23. Net Capital Flows (US $ billion) |
106.6 |
7.2 |
12.0 |
29.6 |
24. Net FDI / Net Capital Flows (%) |
14.9 |
241.5 |
116.0 |
47.8 |
25. Net Portfolio Investment / Net Capital Flows (%) |
25.7 |
-193.6 |
-46.2 |
60.7 |
26. Net ECBs / Net Capital Flows (%) |
21.2 |
109.6 |
26.5 |
2.5 |
Openness Indicators |
|
|
|
|
27. Exports plus Imports of Goods / GDP ( % ) |
36.1 |
42.9 |
- |
- |
28. Current Receipts plus Current Payments / GDP ( % ) |
55.0 |
63.4 |
- |
- |
29. Net Capital Inflows / GDP ( % ) |
9.1 |
0.6 |
- |
- |
30. Gross Capital Inflows plus Outflows / GDP ( % ) |
65.6 |
53.4 |
- |
- |
31. Current Receipts plus Current Payments & Gross Capital Inflows plus Outflows / GDP ( % ) |
120.7 |
116.8 |
- |
- |
Reserves |
32. Import Cover of Reserves (in months) |
14.4 |
9.8 |
10.8 |
12.4 |
33. Outstanding Reserves as at end period (US $ billion) |
309.7 |
252.0 |
286.3 |
281.3 |
5. Difference in DGCI&S and Balance of Payments Imports
- During April-September 2009, based on the records of the DGCI&S imports (based on custom) data and the BoP merchandise imports (based on banking channel data), the difference between the two data sets works out to about US $ 14.8 billion (Table 16).
Table 16 : DGCI&S and the Balance of Payments Import Data |
(US $ million) |
Item |
2007-08 (R )
(April-March) |
2008-09 (PR)
(April-March) |
2009-10 (P)
(April-September) |
1 |
2 |
3 |
4 |
1. BoP Imports |
257,629 |
307,651 |
139,356 |
2. DGCI&S Imports |
251,439 |
303,696 |
124,522 |
3. Difference (1-2) |
6,190 |
3,955 |
14,834 |
6. Revisions in the BoP Data for 2007-08, 2008-09 and Q1 of 2009-10
- According to the Revision Policy announced on September 30, 2004, the data for 2007-08, 2008-09 and the first quarter of 2009-10 have been revised based on latest information reported by various reporting entities. As per the revised data the current account deficit for 2007-08 and 2008-09 stood at US $ 15.7 billion (1.3 per cent of GDP) and US $ 28.7 billion (2.5 per cent of GDP), respectively. The revised data are presented in the standard format of BoP presentation in Statement II.
7. External Debt for the Quarter ending September 2009
- As per the existing practice, the external debt for the quarters ending March and June are compiled and released by the Reserve Bank of India, while the external debt for quarters ending September and December are compiled and released by the Ministry of Finance, Government of India. Accordingly, the data on external debt for the quarter ending September 2009 are being released by the Ministry of Finance, Government of India. The same could be accessed at http://finmin.nic.in.
Alpana Killawala
Chief General Manager
Press Release : 2009-2010/915 |
 IST,
IST,