 IST,
IST,


Bank Lending Survey for Q4:2023-24
|
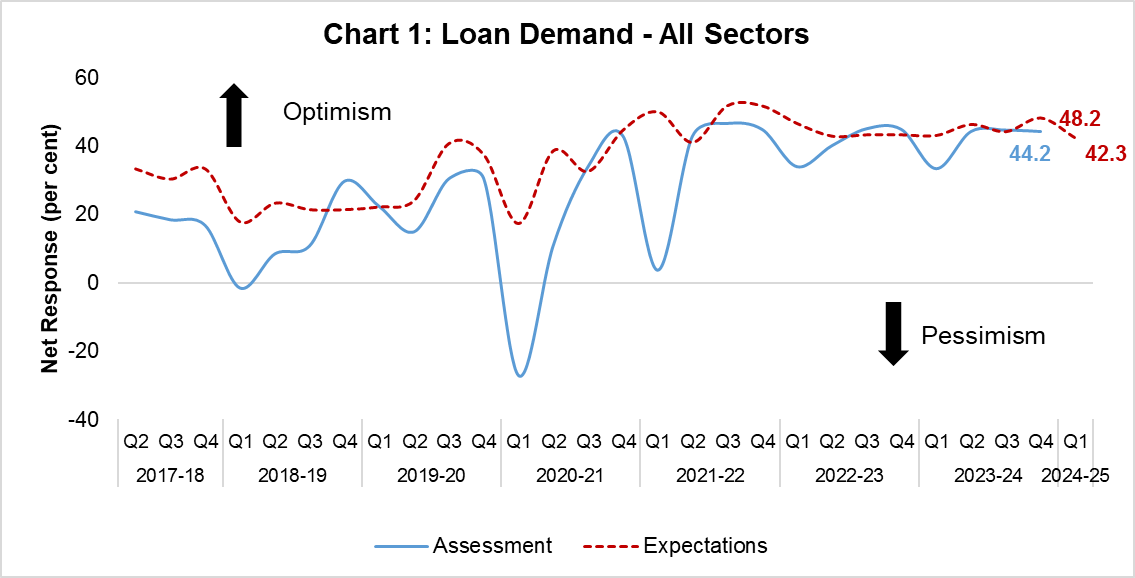
Today, the Reserve Bank released the results of 27th round of its quarterly Bank Lending Survey[1], which captures qualitative assessment and expectations of major scheduled commercial banks on credit parameters (viz., loan demand as well as terms and conditions of loans) for major economic sectors[2]. The latest round of the survey, which was conducted during Q4:2023-24, collected senior loan officers’ assessment of credit parameters for Q4:2023-24 and their expectations for Q1, Q2 and Q3 of 2024-25. Highlights: A. Assessment for Q4:2023-24
B. Expectations for Q1:2024-25
C. Expectations for Q2 and Q3:2024-25
Table 1: Sector-wise Loan Demand - Net Response[3]
Table 2: Sector-wise Loan Terms and Conditions - Net Response
Table 3: Sector-wise Expectations for Extended Period - Net Response
Note: Please see the attached excel file for detailed time series data. [1] The results of 26th round of the BLS with reference period as October-December 2023 were released on the RBI website on February 08, 2024. The survey results reflect the views of the respondents, which are not necessarily shared by the Reserve Bank. [2] The survey questionnaire is canvassed among major 30 SCBs, which together account for over 90 per cent of credit by SCBs in India. [3] Net Response (NR) is computed as the difference of percentage of banks reporting increase/optimism and those reporting decrease/pessimism in respective parameter. The weights of +1.0, 0.5, 0, -0.5 and -1.0 are assigned for computing NR from aggregate per cent responses on 5-point scale, i.e., substantial increase/ considerable easing, moderate increase/ somewhat easing, no change, moderate decrease/ somewhat tightening, substantial decrease/ considerable tightening for loan demand/loan terms and conditions parameters respectively. NR ranges between -100 to 100. Any value greater than zero indicates expansion/optimism and any value less than zero indicates contraction/pessimism. Increase in loan demand is considered optimism (Tables 1), while for loan terms and conditions, a positive value of net response indicates easy terms and conditions (Table 2).
|
|||||||||||||||||||||||||||||||||||||||||||||||||||||||||||||||||||||||||||||||||||||||||||||||||||||||||||||||||||||||||||||||||||||||||||||||||||||

Share this page:


Install the RBI mobile application and get quick access to the latest news!
Scan the QR code to install our app


Page Last Updated on:


