 IST,
IST,


Chapter IV: Open Economy Digitilisation: Challenges and Opportunities
|
Open economy digitalisation1 offers unique opportunities for India to reap dividends from cross-border digital trade. India’s state-of-the-art digital public infrastructure (DPI) has enormous potential for enhancing cross-border trade across sectors like finance, health, education, agriculture and MSMEs and boosting India’s productivity and growth potential. The rising digitalisation share in cross-border remittance flows would help reduce the cost of sending remittances, increase their volume and improve income of the recipients. The internationalisation of the INR is benefitting from the comprehensive and integrated approach and would impart vibrancy to India’s external sector. India’s DPI resilience can be augmented by strengthening self-reliance in sea cables, expanding satellite internet connectivity, making UPI global, and providing pro-active policy support to data localisation. There exists immense potential in building cross-border interoperable fast payment systems and CBDCs to leverage open economy digitalisation. 1. Introduction IV.1 India has embarked on a transformative journey to become a developed nation by 2047. This aspiration will get a boost from the significant progress that has been achieved in India’s digital public infrastructure (DPI) and the potential to scale it up manifold. The “India Stack” is well recognised as a world-class DPI which has fostered innovation and competition, promoted financial inclusion, improved efficiency of public expenditure, facilitated direct transfers of social safety payments, and reduced leakages and corruption (Alonso et al., 2023). There exists enormous potential to leverage India’s DPI in an open economy setting to expand and diversify digital merchandise and services trade, promote cost-effective remittances, and increase FDI into digital sectors. By enabling its emergence as a preferred currency for cross-border payments, digitalisation also presents opportunities for hastening internationalisation of the rupee. The DPI can be easily exported due to its open and modular architecture. In this context, this chapter provides an in-depth assessment of the opportunities and challenges related to open economy digitalisation. IV.2 Digitalisation is set to break the ‘iron laws’ of cross-border trade and bring about a fundamental structural shift in global production processes, trade, and investment flows via the re-allocation of tasks through the use of robotics, automation and artificial intelligence (AI), servicification of the production processes and the rise in e-commerce (Bekkers et al., 2021). Geographically, digital trade has been gradually shifting from advanced economies (AEs) to emerging market economies (EMEs) [IMF, OECD, UN, and WTO, 2023].2 India’s digital trade is projected to increase to US$ 2.4 trillion in 2047 - more than 13 times its level in 2020. India’s fast adoption of frontier technologies and its state-of-the-art DPI encompassing an array of critical sectors in the economy such as finance, health, education, industry and governance are expected to expand economic opportunities while strengthening its linkages with the rest of the world. Cross-border digital ordering and delivery of goods and services have picked up at an accelerated pace since the pandemic.3 During the pandemic, digital trade enhanced economic resilience across geographies by maintaining business operations and delivering goods and services amidst physical restrictions. IV.3 Digitalisation is also rapidly transforming cross-border migrant remittances and global capital flows by lowering costs, increasing transparency and efficiency, fostering financial inclusion, and aiding coordination and risk management. Given considerations of financial stability and global coordination, the shift towards open economy digitalisation is expected to be gradual and measured, which has been India’s approach. The internationalisation of the UPI is a pertinent example of this approach. The initial steps were aimed to enable Indian travellers and diaspora to make merchant payments using UPI abroad. The next upgradation was the ability to make person-to-person remittances using UPI with the same efficiency as of domestic transactions. Going forward, the goal is to globalise the UPI such that every other country will have some fast payment system (FPS), either its own or the UPI (Sankar, 2023). Such a network would ensure that all cross-border payments can happen on a FPS, which augurs well for global trade and payments. Central bank initiatives such as interlinkage of FPSs across economies and central bank digital currencies (CBDCs) are expected to support seamless international transactions, reduce foreign exchange risks and effectively manage global liquidity. IV.4 While digitalisation in an open economy brings immense benefits, it is not devoid of challenges. These include, inter alia, ensuring interoperability and adoption of standards; cross-border digital governance and accountability; rising technological dependency and disruption risks; digital monopolies and market concentration; and safeguarding intellectual property. Policies on data security and privacy need to strike a delicate balance between global harmonisation and country-specific preferences. Moreover, digital trade policies may be needed to prevent digital trade wars. The volume and types of cross-border transactions and exchanges have increased significantly. This necessitates measurement of digitalisation in the System of National Accounts (SNA) and Balance of Payments (BoP) statistics. Moreover, the adoption of digital supply and use tables (DSUTs) could improve the measurement of the digital economy (OECD, 2024a). To be future ready, there is also a need to enhance India’s DPI resilience by building self-reliance in sea cables, expanding satellite internet connectivity, ramping up cybersecurity, and providing pro-active policy support to data localisation. IV.5 Against this backdrop, this chapter discusses digital trade in goods and services, digital remittances, and digital capital flows, while also focussing on supply-side enablers such as DPIs, cross-border FPSs, CBDCs, and data embassies. Section 2 delves into the existing landscape, significance, and prospects of digitalisation within India's external macroeconomic framework. Digitalisation of trade, services and remittances is discussed along with the implications for the internationalisation of the INR. Section 3 explores the supply-side dimensions, such as the expanded influence of India’s DPIs on the global stage, with a special focus on the internationalisation of the UPI and global prospects stemming from CBDCs. Section 4 elucidates opportunities for India from data localisation in the realm of data centre infrastructure. Section 5 discusses the potential challenges due to rapid advancements in digitalisation. Section 6 provides concluding remarks. 2. India’s Journey Towards Open Economy Digitalisation IV.6 The digital economy encompasses all activities that use digitised data and can be measured as the contribution of economic transactions, that involve both digital products and digital industries, to output (IMF, 2018b; ADB, 2021). Digital products are goods and services that primarily generate, process, and/or store digitised data, while digital industries are producers that primarily produce such products. Within digital economy, ‘core’ digital economy includes economic activity from core information and communications technology (ICT) goods and digital services producers in the following five product groups: hardware, software publishing, web publishing, telecommunications services, and specialised and support services. The broader concept of ‘digitally dependent economy’ is the combined output from the core digital sector and ten digitally disrupted sectors4, with the latter as defined by the UN Advisory Expert Group on National Accounts, 2019. In 2019, the size of the core global digital economy was estimated at 8.8 per cent of world output, and the corresponding figure for India was 8.5 per cent5. India’s overall digitally dependent economy was estimated at around 22 per cent of GVA in 2019 (Gajbhiye et al., 2022).6 India’s performance on various indicators of the digital economy compares well against many of its peer EMEs (Chart IV.1). IV.7 Within a digital economy, cross-border digital trade constitutes a key component. While traditional trade statistics make a distinction between cross-border trade in goods and services and further classify services based on the four modes of supply7, digital trade entails new dimensions. The growth of cross-border e-commerce has helped in identifying the ordering and delivery process (both of which can be digital), and has also brought attention to the different (institutional) nature of partners involved in international trade. The literature identifies three key dimensions of digital trade [Chart IV.2] – the nature of the transaction (‘how’), the product (‘what’) and the partners involved (‘who’) – and suggests a close relationship between digitalisation, internet connectivity and international trade (Choi, 2010; Lin, 2015; González and Sorescu, 2021; Herman and Oliver, 2023). 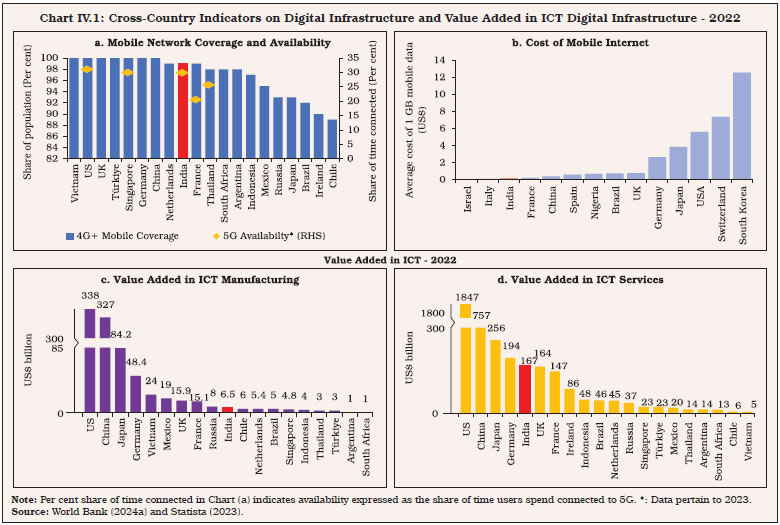 IV.8 Digitalisation matters for trade, and more so for services trade, because the trade in modern services may not be conditional upon the geographical proximity between trading partners. Bivariate Granger causality analysis using world digital trade estimates following González et al. (2023), and fixed broadband usage per 100 people during 2001 to 2020 suggests unidirectional causality from digitalisation to global digital trade. These results are corroborated by Granger causality tests on a panel dataset for 58 economies (both AEs and EMDEs) and a sample period from 2015 to 2021 which indicate unidirectional causality from digitalisation (proxied by share of internet users in the population) to trade in digitally delivered services (Table IV.1). 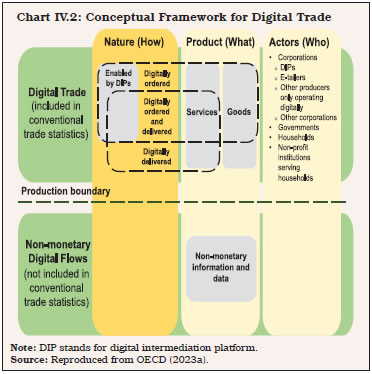 Goods and Services in the Digital Age IV.9 Digital trade in goods refers to digitally ordered goods comprising international e-commerce transactions (Chart IV.3). Digital trade in services constitutes digitally ordered and/or delivered services (IMF, OECD, UN and WTO, 2023). Globally, the share of digital exports in total world exports has risen from around 22 per cent to around 29 per cent during 1995 to 2020 (Chart IV.4a). 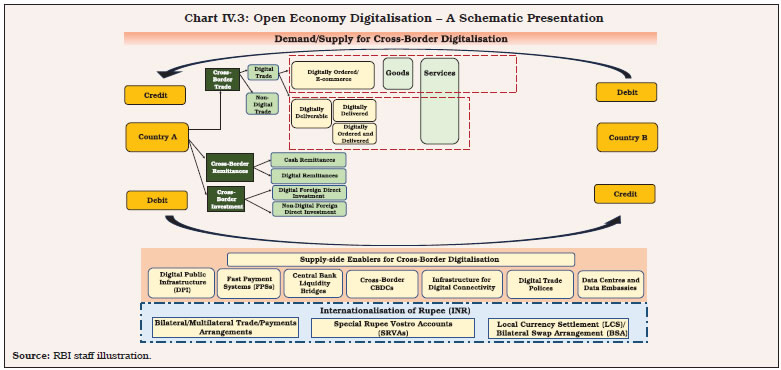 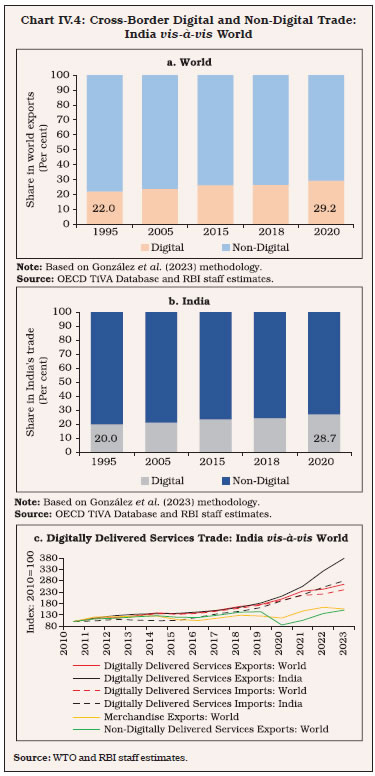 IV.10 Goods account for over three quarters of global trade, and the limited evidence available on digitally ordered goods suggests that around two-third of e-commerce sales relate to goods. For India, the share of digital trade in total trade is estimated to have risen from around 20 per cent in 1995 to around 29 per cent in 2020 (Chart IV.4b). Digitally delivered services have recorded a significant surge globally and India has outperformed global trends (Chart IV.4c). IV.11 India is a net importer of ICT products (Charts IV.5a and IV.5b). ICT products, the backbone of the global digital economy, are primarily intended to fulfil or enable the function of information processing and communication by electronic means, including transmission and display (OECD, 2008). In line with the needs of its growing digital economy, India’s share in global ICT goods imports has increased from 0.3 per cent in 2000 to 1.8 per cent in 2022 (Chart IV.5c). India is set to become a major adopter of the frontier technologies on ICT, which would in turn further increase the demand for ICT goods (Chart IV.5d). On the export side, communication equipment dominates exports of ICT products. The ongoing efforts to onshore their production through the production linked incentive (PLI) scheme are helping India’s exports of these products and as a result, the trade deficit in electronics may moderate going forward. IV.12 Across major services exporting economies, digitally deliverable services dominate exports, gaining in share especially after the pandemic (Charts IV.6a and IV.6b). With an average annual growth rate of 8.2 per cent between 2005 and 2023, global exports of digitally delivered services have outpaced other services and goods (WTO, 2024). Growth has accelerated in recent years (10.9 per cent annually between 2020 and 2023), due to the pandemic-induced surge in remote work. AEs have generally dominated the exports of digitally delivered services, and only around 21 per cent of digitally delivered services exports in 2023 originated from EMDEs. 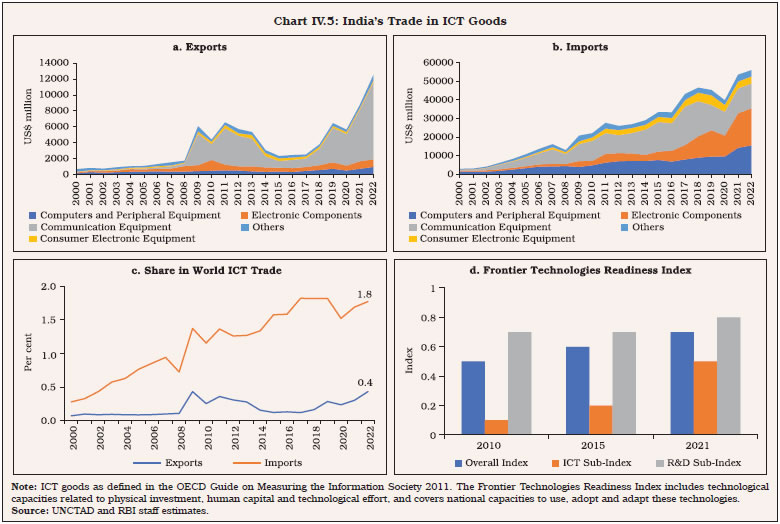 IV.13 India’s services exports in US dollar terms recorded a compound annual growth rate (CAGR) of 10.3 per cent over the recent two decades (between 2005 and 2023), significantly higher than India’s merchandise export growth (7.9 per cent) as well as world services export growth (5.9 per cent). Over the same period, India’s digitally delivered services exports grew by more than 8 times (from US$ 31 billion to US$ 257 billion), whereas digitally delivered services imports rose by more than 6 times (from US$ 18 billion to US$ 111 billion) [Charts IV.6c and IV.6d]. During this period, the expansion in India’s digitally delivered services exports (CAGR of 11.9 per cent) was well above that in world digitally delivered services exports (7.7 per cent CAGR). As a result, the share of India’s digitally delivered services exports in world digitally delivered services exports doubled from 3.0 per cent in 2005 to 6.0 per cent in 2023. In the case of imports, the shares have risen from 1.9 per cent in 2005 to 3.1 per cent in 2023. IV.14 India’s digitally delivered services trade (exports plus imports) comprised 10.5 per cent of India’s nominal GDP in 2023, up from 6.0 per cent in 2005. Whereas, the share of India’s digitally delivered services exports in India’s GDP went up from 3.8 per cent in 2005 to 7.4 per cent in 2023. India’s services exports exhibited resilience during the pandemic primarily on account of a larger share of telecommunication, computer and information services and business services in its export basket (Gajbhiye et al., 2024). 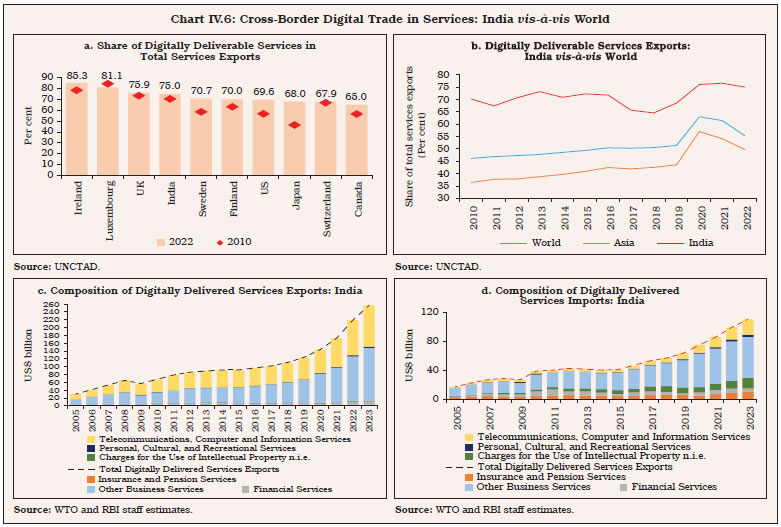 IV.15 India’s rise as a preferred destination for global capability centres (GCCs) has raised the trend growth of digitally delivered services trade (Chart IV.7). The number of GCCs housed in India has increased by around 60 per cent since 2015-16 to reach more than 1580 in 2022-23, and the number is expected to reach 2400 by 2030 (EY, 2023). The wave of big data, artificial intelligence (AI), machine learning (ML), internet of things (IoT) and advancements in compatible hardware, generative AI and spatial computing has opened up new opportunities to expand India’s services exports, especially in business services, and may improve India’s participation in global value chains (GVCs). Generative AI is projected to become a US$ 1.3 trillion market by 2032 (Bloomberg, 2023). India is also experiencing the generative AI boom with currently around 100 start-ups (as on July 2024) and a projected market size of US$ 17 billion in 2030 (Inc42, 2024). 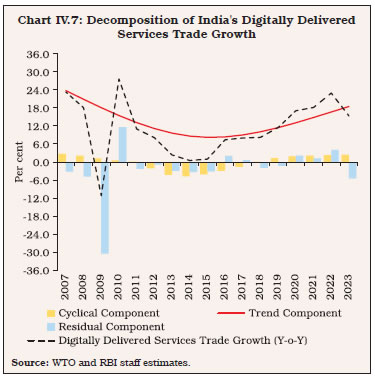 IV.16 Cross-border e-commerce offers a more affordable point of entry compared to conventional businesses, demands fewer personnel, and enables firms to directly connect with customers, thereby reducing reliance on intermediaries to access global markets (Majumdar et al., 2020). Cross-border e-commerce transactions are mainly classified into four types depending upon the sector involved – business-to-business (B2B), business-to-consumer (B2C), consumer-to-consumer (C2C) and government-to-business (G2B). The Indian e-commerce market is also gradually gaining ground. IV.17 Following González et al. (2023) and assuming India’s annual nominal GDP growth during 2024-2047 is at the same pace as recorded during 2001-19 (10.1 per cent in US$ terms), India’s digital trade is projected to increase to around US$ 0.5 trillion in 2030, and US$ 2.4 trillion in 2047 from around US$ 0.2 trillion in 2020 (Table IV.2)8. Scenario analysis suggests that if the annual nominal GDP growth were to be 3.5 percentage points above its historical pace (2001-19), India’s digital trade could go up to US$ 0.7 trillion in 2030 and US$ 5.8 trillion in 2047 (Chart IV.8a). India’s share in world digital trade is projected to increase from 5.6 per cent in 2020 to around 12 per cent by 2047 in the baseline scenario and around 14 per cent in the higher growth scenario (Chart IV.8b).
IV.18 With the advent of digitalisation and technological advancements, India is witnessing growing servicification of its manufacturing exports. India’s domestic services value-added share in gross manufacturing exports rose to 17.7 per cent in 2020 from 13.4 per cent in 2011.11 Moreover, India has a revealed comparative advantage (RCA) in modern services exports, particularly in computer services exports (Gajbhiye et al., 2024). Further, its RCA has improved in the case of business services exports. Digitalisation is expected to support the exports of Indian services (Box IV.1). 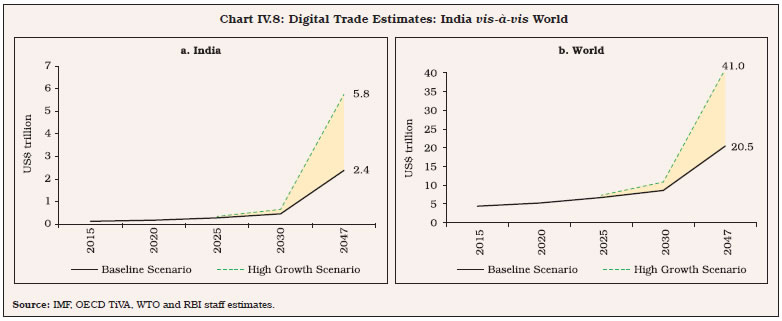
IV.19 Recent developments in AI and Large Language Models (LLMs) provide an additional avenue to boost India’s digital trade. Due to rising digitalisation, AI is expected to increase India’s annual GVA growth rate by 1.3 percentage points to 7.1 per cent in 2035 (Statista, 2023). India has the highest relative AI-skill penetration rate16, and it has shown the largest increase in AI talent between 2016 and 2023 (Maslej et al., 2024). This upskilled talent could help India’s software export markets leverage AI seamlessly and move them up the value chain. Additionally, India’s pool of highly skilled workers is well-primed to take up jobs as AI specialists in non-software domains, such as those requiring the building of domain-specific AI models for tailor-made use by organisations. Hence, there is potential to increase export value addition through AI across all product types. India is in an advantageous position to develop LLMs and their applications suited to the Eastern world, especially for culturally similar regions like South and Southeast Asia. Digitalisation of Cross-Border Remittance Flows IV.20 Digitalisation has the potential to improve the landscape of the cross-border remittance flows. Remittances have become the premier source of finance for low- and middle-income countries (LMICs), even exceeding FDI flows by US$ 274 billion in 2023 (World Bank, 2024b). The size of international migrant stock, the driver of remittance flows, has nearly doubled from 153 million in 1990 to 302.1 million in 2023. Globally, inward remittance flows have increased more than seven-fold between 2000 and 2023 to US$ 857 billion, with flows to LMICs amounting to US$ 656 billion. IV.21 Migrant stock from India comprised 1.3 per cent of its population in 2020. India is the highest remittance recipient country in the world, with its share increasing over time (Chart IV.9a). India’s inward remittance receipts stood at US$ 115 billion in 2023, which is 13.5 per cent of the world total. The cost of sending remittances has decreased over time, with digitalisation playing a key role (Charts IV.9b and IV.9c). The average cost of receiving remittances in the case of India stood at 5.01 per cent in Q1:2024 (marginally lower than 5.04 per cent in Q4:2023), but higher than the Sustainable Development Goal (SDG) of 3 per cent per US$ 200 remittance (Chart IV.9d). 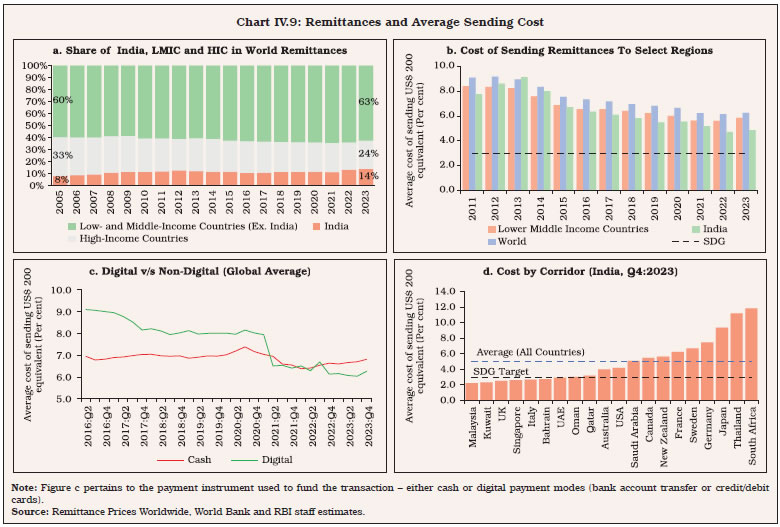 IV.22 In India, the ratio of remittances to GDP has gradually increased from 2.8 per cent in 2000 to 3.2 per cent in 2023 and is now above that of gross FDI inflows to GDP ratio (1.9 per cent in 2023), providing strength to India's external sector. In 2021, more than half of India’s inward remittances were from the Gulf countries, while North America accounted for 22 per cent share. Going forward, India is poised to be the world’s leading supplier of labour as India’s working age population is expected to rise till 2048, while it has started dwindling for major AEs (Chart IV.10). Thus, the global demand for Indian migrant workers will remain high, which along with continuing skill upgradation of the workforce would provide a sustained boost to inward remittances. Based on the trends observed over the past decade, remittances to India are estimated to increase to around US$ 160 billion in 2029 from US$ 115 billion in 2023 (Chart IV.11). 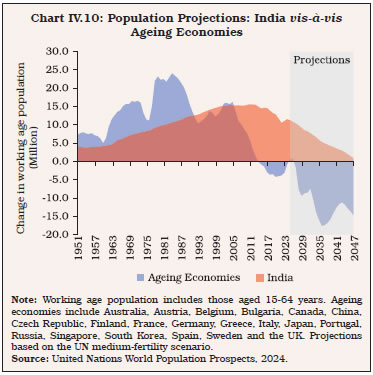 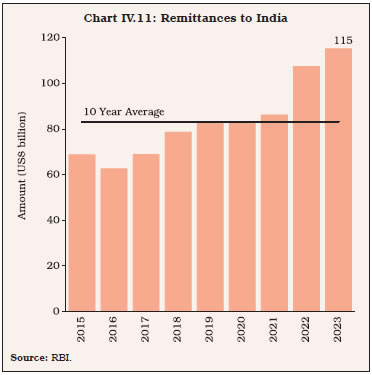 Cost of Remittances to India: Potential for FinTech Disruption IV.23 The global average cost of sending US$ 200 as remittance stood at 6.35 per cent in Q1:2024, marginally lower than 6.39 per cent in Q4:2023 (World Bank, 2024c). Nonetheless, it is more than double the SDG target. For India, in Q4:2023, the cost of remittance from Singapore, Malaysia, the UK, Kuwait, Italy and Bahrain was within the SDG target, while the cost from Thailand and South Africa was more than 10 per cent (Chart IV.9d). This may be due to the dominance of banks in the latter set of countries, while the former countries have a competitive remittance industry with banks facing competition from money transfer operators (MTOs) and FinTechs. Additional factors that influence remittance cost include the speed of money transfer, the payment instrument used for transfer (cash or bank account), and the access point/mode of transfer (bank branch, internet or agent). The digitalisation of cross-border remittance flows would improve the speed and transparency of transactions, while reducing liquidity costs and fees. Since the banking channel requires involvement of several banks communicating through SWIFT messaging, transaction costs are higher in general, while settlements are slower than through FinTechs (Church, 2023). Though banks, MTOs and RemTechs17 operate on nearly the same foreign exchange margin, the average cost of receiving remittances (US$ 200) through RemTechs is significantly lower than that of the banks (Chart IV.12). Realising the potential of FinTech, the Reserve Bank had selected cross-border payments as the second cohort under its Regulatory Sandbox initiative (RBI, 2022a). 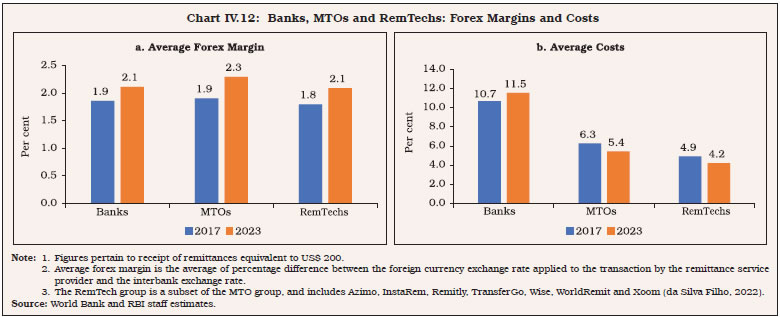 IV.24 As the world progresses towards a more interconnected and digitally driven era, the creation of integrated cross-border payment frameworks and CBDCs would provide new avenues for FinTechs to provide cheaper solutions in cross-border payments (Box IV.2)
Role of Trade Policy in Cross-Border Digital Trade IV.25 Cross-border digital trade policies play a crucial role in harnessing new opportunities, building trust, and facilitating coordination on regulatory aspects like data security and cybersecurity. Provisions facilitating digital trade can significantly increase trade, especially in services (Herman and Oliver, 2023), and help increase competitiveness. This is especially true for LMICs, where an enabling regulatory environment can help reduce costs of digitally delivered services trade (IMF, OECD, UN, and WTO, 2023; González et al., 2023). Digital trade policy discussions are gaining prominence in multilateral fora, bilateral trade agreements, and regional trade agreements (RTAs), digital economy agreements, and domestic regulations (Chart IV.13a). According to the Trade Agreement Provisions on Electronic-commerce and Data (TAPED), among the operational trade agreements since 2000, 184 contained provisions on e-commerce/digital trade, while 102 contained a chapter dedicated to e-commerce/digital trade. Dedicated digital economy agreements (DEAs)21 have gained prominence in recent times. While incorporating many of the issues discussed in trade agreements, DEAs also extend discussions to emerging areas such as cooperation on AI, digital identity, data innovation, FinTech and digital payments. DEAs are dynamic in nature and designed to deepen mutual understanding of the digital economy, while being responsive to the latest technological developments, business models and regulatory challenges. IV.26 Many countries, including India, have passed data protection acts22 to deal with issues of privacy, national security, and intellectual property rights (IPRs). India’s data protection regulations aim to align with global standards. Globally, there has been intense intervention in issues pertaining to digitalisation, especially in data governance, content moderation, competition, consumer protection and authorisation, registration, and licensing (Chart IV.13b). Restrictive trade policies and restrictive domestic regulatory environment may distort global digital trade and risk fragmentation of global value chains (GVCs): 0.1 percentage point rise in the OECD’s Digital Services Trade Restrictiveness Index (DSTRI) can lead to a 15.4 per cent increase in international trade costs (González et al., 2023). Conducive trade policies and an enabling domestic regulatory space that balance the benefits of digital trade with the risks to data privacy, consumer protection and cybersecurity are key tasks for policymakers (IMF, OECD, UN, and WTO, 2023; OECD, 2024b). 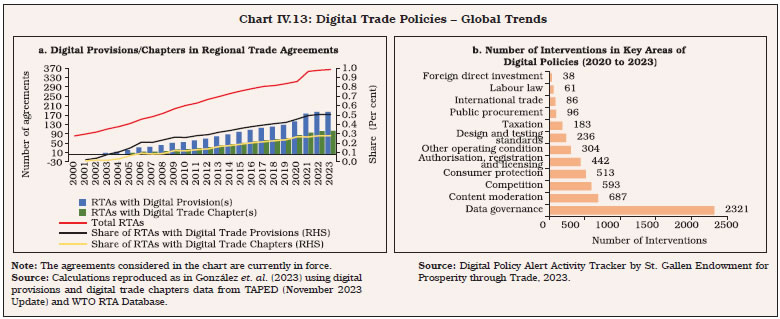 IV.27 India has seven trade agreements with digital trade provisions and two trade agreements with dedicated chapters for e-commerce/digital trade (Table IV.3). Harnessing technology for customs and trade facilitation and policies encouraging favourable customs duties on electronic transmission; contracts using e-signatures, e-invoicing and paperless transactions; consumer protection against data breach and fraudulent transactions; and protection of software source code may be advocated. Building digital readiness for e-commerce is an important issue under the discussions of the UNCTAD’s Intergovernmental Group of Experts on e-commerce and the Digital Economy. Key hindrances identified include addressing digital divides to mitigate the risk associated with limited access to financing, particularly for micro, small and medium enterprises (MSMEs). Digitalisation and Capital Flows IV.28 In the sphere of capital flows, digital foreign direct investment (FDI) is comparatively a newer area of discussion in the international fora. Although the definition of digital FDI has not yet been formalised globally, it may be defined as a cross-border investment that is often asset-light as the foreign enterprise does not need to invest in building production or delivery assets in the host economy (Chaisse, 2023). The digital FDI framework comprises three key pillars – new digital activities, digital adoption of traditionally non-digital firms and digital infrastructure, and each of these pillars is associated with certain facilitating elements (UNCTAD, 2017). By attracting digital FDI, economies are expected to boost their digital capabilities. However, digital FDI requires certain pre-requisites from both supply and demand perspectives. While the supply-side elements involve policies and structural reforms enabling digital-friendly investment climate and ecosystem, on the demand side, domestic firms need to showcase their need, priorities, and opportunities involving digital investment. IV.29 Global investors engaging in new digital activities seek data security legislations, copyright laws to protect intellectual property and data privacy regulations (Stephenson, 2020). They also look for availability of e-payment services, policy support for digital businesses and local digital skills along with international, domestic, and urban connectivity. Additionally, global investors seek ease of receiving licenses for digital infrastructure, availability of digitally skilled workforce, use of international standards and regional coordination for infrastructure investment. Opportunities for Internationalisation of the Rupee IV.30 The US dollar remains the dominant currency for international payment transactions, notwithstanding a fall in its share in total allocated reserves from around 71 per cent in 2000 to around 58 per cent in 2023 (Table IV.4). The US dollar also remains the dominant invoicing currency, with around 70 per cent share in cross-border trade invoicing in the Asia-Pacific region (Bertaut et al., 2021). A currency may internationalise as a reserve instrument by becoming a global store of value, or as a medium of exchange by being used for international payments (Gopinath and Stein, 2018). Technological innovations in payment systems could promote use of other currencies, leading to more currency competition and the development of digital currency areas or regional reserve currencies (Brunnermeier, James, and Landau, 2019; BIS, IMF, and World Bank 2021). IV.31 Historically, the two roles - store of value and medium of exchange - have progressively converged. However, this may not hold in a digitalised world. For a national currency to become a reserve asset, full capital account convertibility is a demanding prerequisite. However, to internationalise as a medium of exchange, a currency may leverage cross-border trade using well-developed digital networks to create a digital currency area. Advances in payment technologies could reduce currency switching costs23, thus weakening existing network effects and inertia (Kim et al., 2024). With the rise in global geopolitical tensions and geoeconomic fragmentation, bilateral and regional economic cooperation agreements are gaining ground. Nearly a decade ago, the IMF had noted that the INR alongside the Brazilian real, the Chinese renminbi, the Russian ruble and the South African rand have gained significant regional importance and have also shown a marked increase in their usage in international transactions, thus, exhibiting their potential to internationalise, while highlighting that full capital account convertibility may not be a necessary prerequisite for the same (IMF, 2011; RBI, 2022b). IV.32 Given the potential benefits of internationalisation of INR in terms of lower transaction costs for cross-border trade and investment operations and lower exchange rate risk, various measures have been taken towards this end over the years. Anecdotal evidence suggests that the INR is accepted in Bhutan, Nepal, Singapore, Malaysia, Indonesia, Hong Kong, Sri Lanka, the UAE, Kuwait, Oman, Qatar, and the UK, among others. The Nepal Rastra Bank, Royal Monetary Authority of Bhutan and Bank Negara Malaysia hold Government of India (GoI) securities and Treasury Bills. Some sovereigns, like Singapore, hold Indian equity and bond assets (including G-secs) through their sovereign wealth funds. The Reserve Bank’s efforts in recent years to develop India’s financial markets have fostered trust, stability, and innovation by making capital raising more efficient, removing segmentation between onshore and offshore markets, and expanding the participation and product base (Das, 2024). Banks are now allowed to access offshore INR markets for FX and interest rate derivatives with a view to improve the efficiency of price discovery and provide greater opportunities to domestic participants. Market-makers have been permitted to deal in such products beyond domestic market hours. Rupee derivatives settled in foreign currency have also been permitted in GIFT City. Further, Indian government bonds have begun to be included, in a phased manner, in the JPMorgan Global Bond Index for Emerging Markets (GBIEM) starting June 28, 2024, and will be included in the Bloomberg Emerging Market (EM) Local Currency Government Index, starting January 31, 2025. With this facilitative environment in place, there are multiple ways for internationalisation of the INR as a currency for cross-border payments (Table IV.5). IV.33 India’s merchandise and services trade, investment and remittance flows taken together generated demand for cross-border payments worth US$ 1.9 trillion in 2023-2424. Based on the latest available bilateral data for 202125, the top ten partner countries account for more than 50 per cent of this demand and could be a starting point in exploring interoperability and expansion of digital public infrastructure towards bilateral/multilateral solutions for cross-border payments. Recently, the Reserve Bank has joined Project Nexus, a multilateral international initiative to connect the FPSs26 of four ASEAN countries (Malaysia, Philippines, Singapore, and Thailand) and India. These four countries account for more than two-thirds (US$ 110 billion) of India’s total flows with ASEAN countries. Its extension to the complete ASEAN bloc could add cross-border flows to the tune of around US$ 45 billion annually. While India has a merchandise trade deficit with these nations, it is set off to a large extent by its services exports, remittances from Indian migrant workers, and FDI inflows.
IV.34 The Report of the RBI’s Inter-Departmental Group on Internationalisation of INR (October, 2022) recommended facilitating Local Currency Settlement (LCS) framework for bilateral transactions in local currencies and operationalising bilateral swap arrangements (BSAs) with the counterpart countries in local currencies. A LCS framework could be the most readily acceptable arrangement with economies with which payment flows (to and from) are nearly balanced. Taking an illustrative threshold flow gap of US$ ±2 billion, seven large29 economies fulfil this criterion. For these seven countries, the annual merchandise and services trade, remittances and investment flows were US$ 163.6 billion in 2021 (around 11.5 per cent of India’s total such flows). In this regard, any deficit in trade account can be offset by a surplus in capital account, remittances or services. Such patterns of bilateral cross-border flows can incentivise nations to look towards mutual acceptance of each other’s currencies for settlement of cross-border transactions. Additionally, there are various large trading partners with whom trade is invoiced in USD and other foreign currencies. The acceptance of INR could be increased in such cases by leveraging the onward trade relationship of these partners with other countries, where the INR enjoys acceptability. IV.35 Recent initiatives to promote the use of the INR and the UAE dirham for cross-border transactions and cooperation for interlinking payment and messaging systems between India and the UAE will help reduce settlement risk, foreign exchange risk, and dollar dependence in their bilateral trade (RBI, 2023b). Similarly, the use of local currencies for cross-border transactions between India and Indonesia would optimise costs and settlement time for bilateral trade transactions (RBI, 2024a). This model can be extended to other similar countries. The LCS and the BSA frameworks can act as a catalyst for the financial market deepening and stability in the region. Besides a reduction in transaction costs, the internationalisation of the INR may also reduce India’s dependence on hard currencies for cross-border payments. IV.36 As envisaged in the Reserve Bank’s Payments Vision 2025, a mechanism for international INR settlement through Continuous Linked Settlement (CLS) would help increase global acceptance of the INR. The CLS is an initiative by a consortium of the world’s largest foreign exchange clearing banks to enable FX settlement in Payment versus Payment (PvP) mode to address Herstatt risk30. Currently, it supports 18 of the most actively traded currencies globally. The CLS mechanism settles transactions worth more than US$ 6.5 trillion daily (CLS, 2024), which is nearly 87 per cent of the global daily FX turnover (BIS, 2022c). 3. Internationalisation of Digital Public Infrastructure IV.37 The integration of DPI into economic activities has profound implications for India’s open economy digitalisation. India’s G-20 presidency in 2023 placed DPI on the global map. The key pillars of India’s DPI, such as digital identity, digital payments financial infrastructure, digital governance, and digital industries/ education, offer tremendous opportunities due to their flexible and modular approach, for which various cross-border use cases have been identified (Table IV.6). Furthermore, India’s G-20 task force on DPI suggested the creation of Digital Public Goods (DPG) packages that will ensure availability of the assets such as software codes and documentation among others required for the successful deployment of the DPI solution (GoI, 2024). Learnings from DPIs Worldwide IV.38 DPI provides tremendous opportunities to countries in fostering financial inclusion, empowering women, enhancing transparency, and increasing efficiency (Table IV.7). Digitalising government transfers contributed to 865 million people worldwide opening their first financial account to receive money from the government (Demirgüç-Kunt et al., 2022). Countries that already had elements of DPI in place (such as digital databases or ID records and data-sharing platforms) could reach more than three times the beneficiaries during the pandemic than those that had to collect latest information (World Bank, 2022).
Leveraging India’s DPI – New Areas for Cross- Border Trade IV.39 By integrating emerging technologies like AI capabilities, India’s DPI can cater to significant global demand and propel a transformative leap forward towards ‘Digital Public Intelligence’ (INDIAai, 2023; WEF, 2023; GoI, 2024). First, India’s digital public health infrastructure and user base can be leveraged for cross-border telemedicine, remote patient monitoring, and medical diagnostic research. India’s CoWIN platform, which managed COVID-19 vaccination programme, shows its capability in building scalable digital public goods and can help other countries develop similar platforms for access to healthcare services and data exchange. Furthermore, the evolution of the National Health Portal into a consolidated repository of health information signifies a significant leap towards a unified and interconnected healthcare model. The infusion of modern technologies, including Natural Language Processing (NLP), sensors, genetic analysis, and AI, promises a patient-centric healthcare system. The convergence of IoT devices and robotics is set to revolutionise healthcare delivery, moving beyond traditional hospital settings to embrace home-based care. India can also carve a niche in specialised digital solutions for the increasing population of senior citizens worldwide. These include robots, customised hardware such as mobiles, tablets, wearables, and security devices, as well as digitally delivered services such as telemedicine, counselling, and financial advice. IV.40 Second, in the education sector, India’s DPI experience has the potential to accelerate the pace of equitable learning experiences across the globe. This can be facilitated via digitally empowered classrooms, incorporating augmented reality (AR)/virtual reality (VR) and AI-ML technologies, which aim to make learning collaborative, engaging, and accessible to learners across the globe. Third, the recently launched open-source e-commerce platform, “Open Network Digital Commerce (ONDC),” is poised to be a catalyst for local commerce in India. The open source ONDC encourages start-ups to innovate and build specialised applications, enhancing accessibility to reliable services (Deloitte, 2023). It can also facilitate seamless exports for Indian businesses by connecting SMEs, logistics providers, and financial institutions across cross-border payment providers. The ONDC’s interoperable framework reduces complexities and costs associated with international trade, encouraging more MSMEs to engage in global commerce. Finally, the ONDC’s transparent platform helps businesses adhere to international trade regulations to access global markets. IV.41 DPI can also be deployed for the infrastructure sector under the National Infrastructure Pipeline, which has a total investment of more than ₹108 lakh crore. DPI can leverage computerised land records and digitised maps created under the Digital India Land Records Modernization Programme, electronic government clearances, developments in Geographic Information System (GIS), drones and IoT to enable real time, detailed and accurate monitoring of infrastructure and industrial projects. This can be a specialised DPI available to prospective investors, governments and contractors to enable project selection, planning and implementation in a plug-and-play manner. Not only can this help attract foreign investment, but it can also be exported to other countries that face pressing infrastructure needs. Strengthening India’s DPI: Cross-Border Fast Payments IV.42 By leveraging new digital technology, reducing the number of intermediaries, enhancing openness and competition, FPSs have the potential to make cross-border payments cheaper and faster, while increasing transparency. Cross-border payments include commercial payments executed by financial institutions on behalf of their clients (B2B, B2C, C2B, and C2C flows) and treasury payments related to the settlement of inter-bank trades, securities, foreign exchange, money markets, among others. While banks dominate the B2B and B2C cross-border payment segments, FinTechs have occupied the C2B and C2C segments. The market for cross-border payments has expanded in the recent years driven by a rise in cross-border labour and capital flows owing to the spread of global manufacturing supply chains and e-commerce, foreign investment flows and cross-border asset management. The value of cross-border payments is estimated to surpass US$ 250 trillion in 2027 (Bank of England, 2024). The USD and the EUR are the two most widely used currencies for cross-border payments, with each having an approximate share of 40 per cent (Perez-Saiz et al., 2023). IV.43 At present, correspondent banking based on SWIFT messaging is the dominant mechanism for cross-border payments. SWIFT also facilitates securities and FX settlement, KYC/AML compliance, trade finance, corporate treasury operations and business intelligence (SWIFT, 2024). It processes approximately 45 million transactions per day (SWIFT, 2022). Median transaction processing time for SWIFT can vary from less than five minutes to more than two days depending on the corridor, while cross-border payments via the UPI-Pay Now interlinkage can be completed within a minute (Nilsson et al., 2022; RBI, 2023c). Additionally, charges are not uniform across SWIFT participant banks, which leads to uncertainty for the customer. Hence, there is a case for interlinking of FPSs for cross-border payments to make them faster, cheaper, more transparent and inclusive, as envisaged under the G20 roadmap to enhance cross-border payments. IV.44 Payment system interoperability and extension is one of the priority themes to help achieve the G20 targets for cross-border payments (FSB, 2022). With more than 70 FPSs operating globally (Chart IV.14), interlinking arrangements32 would constitute the first step towards faster and cheaper cross-border payments. Growing use of APIs33 and the adoption of the ISO 20022 financial messaging standard34 have opened avenues for payment system interlinking, which would involve benefits such as shortening of transaction chains, reduction of transaction and funding costs, increased payment speed, transparency in fees, and improved competition in the provision of foreign exchange and cross-border payment services. 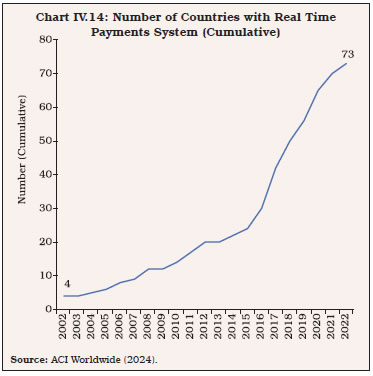 IV.45 The interlinking of payment arrangements can be differentiated by the type of link (direct or intermediated) between participants and the currency arrangement (single/multi-currency and with/without currency conversion). There could be four key types of links: (i) single access point model, (ii) bilateral link, (iii) hub and spoke model, and (iv) common platform model. The UPI-PayNow linkage is a pertinent example of the bilateral model, which leverages open banking APIs to allow account holders of participating financial institutions in India and Singapore to conduct cross-border remittance transactions with the same ease as domestic transactions through the individual FPSs (RBI, 2023c). In a bilateral link, two FPSs are connected directly through nostro/ vostro accounts of linked systems. The Reserve Bank has also signed an MoU with the Central Bank of UAE to link the UPI with the UAE’s FPS – the Instant Payment Platform (IPP), the respective Card Switches (RuPay switch and UAESWITCH) and to explore the linking of payments messaging systems – the Structured Financial Messaging System (SFMS) of India with the messaging system in the UAE (RBI, 2023b). There are limits to the scalability of the bilateral model since every FPS may have different technical standards, business processes, governance framework and regulatory requirements, thus, requiring complex technical integration and multi-party legal negotiation (BIS, 2023). IV.46 At present, India is one of the major countries with a 24x7 RTGS system. According to Central Banking’s Payments Benchmarking 2022, only 12 per cent of the respondent central banks operated their RTGS 16–24 hours a day, with a majority operating it for only 7-12 hours per day. India’s RTGS runs on ISO 20022 standard and is ready to be streamlined with the internationally accepted standard for cross-border fund transfers. Additionally, the natural working hours of India’s financial sector lie comfortably within the global settlement window. Several global outreach initiatives to expand the footprint of the UPI are already underway through bilateral and multilateral linkages and collaborations with relevant stakeholders. As per the Reserve Bank’s Payments Vision 2025, steps can be taken to migrate all the Reserve Bank-operated payment messaging systems to ISO 20022 standard. The feasibility of expanding RTGS to settle transactions in major trade currencies such as USD, EUR and GBP can be explored through bilateral or multilateral arrangements. These arrangements could provide real time proceeds in foreign currencies to traders and help develop the country as a major centre for international financial trades. IV.47 The system of liquidity bridges for seamless transfer of funds can also be explored. In a bilateral liquidity bridge, collateral – usually in the form of cash – is held by payment system participants at a specific central bank (the facilitating bank), denominated in the currency issued by it. The facilitating bank notifies the receipt of the collateral which enables the provision of intraday liquidity by another central bank (the lending bank) in its native currency to the participants or their affiliated entities (e.g., branches or subsidiaries) within the jurisdiction of the lending bank (BIS, 2022a). The benefits of maintaining liquidity bridges include efficient management of global liquidity requirements, lower foreign exchange risk and credit risks for payment system providers (PSPs), and a credit line in times of financial stress. IV.48 For the extension of its payments technology associated DPI into the global arena, India can provide technical assistance to standardise processes and protocols across countries to make them compatible with the UPI. Given that the UPI offers features like plug-and-play innovation through APIs, CBDC interoperability (with the e-₹), offline capability, ability to link credit cards and collect requests, it is also a highly attractive candidate for countries exploring the market for a readymade FPS to adopt in their jurisdictions (Watson, 2024). Improving India’s DPIs: Challenges and Building Resilience IV.49 Despite being one of the leading producers of optical fibre cable (OFC) in the world, the fiberisation in India’s broadband lines remains low. There is a significant share of digital subscriber line (DSL) and other non-fibre lines in India’s broadband lines, which may hinder internet speed and 5G adoption (TechHerald, 2021). Only around 38 per cent of India’s mobile towers are fiberised, while 6G technology will require 100 per cent fiberisation (KPMG, 2023). Strengthening Sea Cable Network IV.50 For a sustainable growth of India’s DPI, reliable high-speed connectivity between strategic locations would be paramount. Globally, US$ 418 billion needs to be mobilised to connect unconnected households (Amaglobeli et al., 2023). The expected rise in internet penetration (46 per cent in 2021), adoption of AI, 5G, IoT and an ever-increasing reliance of the Indian economy on DPIs require expansion in the number and quality of internet connections. Around 99 per cent of all international data is transferred through a labyrinth of OFC stretching across ocean floors. As of June 2024, there were approximately 600 such active and planned cables, spanning nearly 1.4 million kilometres. Traditionally, undersea cables were owned by telecom carriers who would form a consortium of all parties interested in using the cable. Lately, content providers such as Google, Meta, Microsoft, and Amazon have been major investors, accounting for almost a fifth of the US$ 12 billion in planned investments in new systems over the next four years (The Economist, 2023). Centrally located countries in the global OFC network enjoy faster and cheaper connections to the internet. In view of the economic importance of internet services, and to counter the dominance of BigTech and a handful of countries over the global data pipeline, India could benefit by expanding its OFC connections to the world with targeted policies to crowd in such expenditure by telecommunications firms at a large scale. Strengthening Satellite Network IV.51 An alternative satellite internet backbone for the nation can diversify risk as well as connect remote geographies. In recent years, especially during times of geopolitical tensions and fragmentation, satellite internet has emerged as a critical supplement to OFC. Moreover, satellite internet is crucial for disaster recovery and development of next-generation services like telemedicine, remote education, and for the IoT. Utilising constellations of small, mass-produced satellites, some companies have promised cheap, high-speed internet access throughout the world (Graydon and Parks, 2020). Indian telecom giants have also started exploring satellite internet solutions, and these efforts would get a boost from the recent policy framework to attract FDI in the space sector. Cybersecurity IV.52 Although digital trade increases cybersecurity risks, trade policy can also strengthen cybersecurity (Meltzer and Kerry, 2019). Trade agreements can include commitments to building public and private sector real-time information sharing mechanisms to promote awareness, plan responses, and help targets adapt and respond. They can also help popularise the use of international cybersecurity standards where they exist as a basis for domestic regulation, and help achieve greater uniformity and coordination. Cybersecurity compliance certification schemes may also be used to establish export conformity across jurisdictions in international trade. Under the G20 New Delhi Leaders’ Declaration, India has welcomed the Financial Stability Board’s (FSB’s) recommendations to achieve greater convergence in cyber incident reporting and the updates to the Cyber Lexicon. It has also expressed interest in the initiative to develop a common format for incident reporting exchange (FIRE). Additionally, on the lines of the Financial Action Task Force (FATF), a Financial Cybersecurity Action Task Force with involvement of both the public and private sectors may be needed to create and promote cyber norms to balance innovation and systematic cyber risk within cross-border financial systems (Huang and Madnick, 2020). Role of CBDCs in Cross-Border Payments IV.53 Policy discussions on CBDC have graduated from the preliminary concerns around technology and its impact on cash, bank deposits and monetary policy to more granular, practical, and operational areas such as legal implications, operability across jurisdictions, cross-border payments, and privacy concerns. Pilot projects have been introduced to explore cross-border use cases. Multiple benefits such as financial inclusion, reduction in the cost of printing currency notes, environmental benefits, and creating a more secured and cost-effective settlement mechanism are some of the driving factors prompting central banks to consider the launch of CBDCs and explore its functionality for cross-border transactions. Currently, in more than 90 countries, CBDCs are in various stages of exploration/implementation. IV.54 In October 2020, the G20 endorsed a roadmap to enhance international cross-border payments and the targets stipulated therein are to be achieved by 2027 (Table IV.8). The identified frictions such as fragmented and truncated data formats, intricate compliance checks, restricted operating hours, outdated technology platforms, lengthy transaction chains, funding costs, and limited competition were associated with higher cost, lesser speed, and lower accessibility in cross-border payment infrastructure. The roadmap aims to enhance the existing payment infrastructure, while outlining an international dimension into the design of CBDCs as part of the forward-looking initiatives (FSB, 2023). IV.55 Central banks consider CBDCs as an opportunity to streamline and improve cross-border transactions, providing 24/7 settlement even outside closed-loop solutions or those controlled end-to-end by money transfer operators. CBDCs could offer inherent advantages in cross-border transactions by streamlining the cost of international remittances, minimising risks associated with multiple intermediaries, enhancing efficiency through faster settlement times, and providing greater transparency in payment status (Auer et al., 2021). However, the cross-border use of CBDCs may expose EMDEs to various macroeconomic and financial sector risks, including currency substitution, heightened volatility in capital flows and exchange rates, and exacerbation of issues like tax avoidance and illicit activities (BIS, 2021; Chen et al., 2022, and Prasad, 2023). IV.56 Wholesale CBDC developments have doubled in the last two years due to geopolitical environment (Atlantic Council, 2024). There are presently around 13 cross-border CBDC projects, including mBridge, which connects China, Thailand, the UAE, Hong Kong and Saudi Arabia and has more than 26 observing members (BIS, 2024). Central banks are exploring both retail and wholesale cross-border CBDC arrangements (with focus towards the latter), and the ongoing projects endorse both bilateral transactions and multilateral arrangements. One approach to developing cross-border CBDCs involves interlinking individual domestic CBDC systems, making them compatible through adherence to common international and technical standards as well as aligning them to legal, regulatory and supervisory frameworks. Additional interlinkages of CBDC systems can be achieved either through a shared technical interface or a common clearing mechanism (for example, Project Jasper-Ubin and Project Jura), taking into account the member central banks during the development stage itself to reduce reliance on coordinated policy moves in later stages (BIS, 2021). A more nuanced approach involves establishing a single multiple-CBDC (mCBDC) system across jurisdictions, exemplified by projects like Inthanon-LionRock, Aber, mCBDC Bridge, and Dunbar. This concept revolves around having a unified set of rules, a single technical system and a singular set of participants. While this deeper integration and wider access offers potential operational functionality and settlement efficiency, it poses policy challenges and raises governance and control concerns (BIS, 2021). IV.57 In India, apart from enhancing international transactions, cross-border CBDC has the potential to overcome challenges relating to turnaround times, high costs, transparency as well as legal and regulatory requirements across jurisdictions, while reinforcing the role of central bank money as an anchor for cross-border payments. Accordingly, the Reserve Bank is examining bilateral and multilateral collaborations. In this direction, the Reserve Bank has also signed an agreement with Central Bank of United Arab Emirates (CBUAE) in the area of FinTech initiatives including cross-border CBDC payments. To learn about global initiatives and progress, the Reserve Bank has joined the BIS Innovation Hub led multilateral projects ‘Mandala’ and “mBridge” as an “Observer”. Factors Influencing Cross-Border CBDCs IV.58 Several factors such as digitalisation of commerce, the widespread use of private digital currencies, and specific policy concerns related to financial inclusion, informality, and data privacy could influence the adoption of CBDCs (Auer et al., 2023). However, the reasons behind the issuance of CBDCs vary among countries. Duffie (2020) delves deeper into the importance of interoperability in the context of CBDCs, emphasising its role in enhancing efficiency. He (2021) underscores the significant impact of high cross-border remittance costs on both the financial system and the prevalence of unbanked populations, particularly in less-developed regions. Countries also consider external sector implications while adopting cross-border CBDCs (Box IV.3). 4. Data Embassies and India’s Potential IV.59 Data is the pulse of the digital economy. The explosion in the data volume necessitates innovative approaches for data protection and resilience to secure digital information for uninterrupted functioning of the digital economy. Data can be stored within the country in data centres35 through legal provisions such as data localisation policies or housed outside the country in “data embassies”36. IV.60 In recent years, India’s focus has been on developing both data centres and data embassies. This move not only enhances cybersecurity but also ensures that a comprehensive range of financial information is safeguarded in a systematic manner. This aligns with global efforts to strengthen data protection and privacy measures. Data embassies have become a viable option for storing and managing duplicate copies of vital state data outside the domestic territory that ensures data sovereignty, while imparting security and resilience in the event of major cyber threats, natural disasters, and terrorist attacks.37 India is looking to establish data embassies at the GIFT IFSC for countries and businesses looking for digital continuity solutions (GoI, 2023). The establishment of data embassies will primarily be facilitated through bilateral agreements with the interested countries. Multinational corporations could use these embassies to store the data of Indian users within the country. This is expected to give a significant spurt to investment in India’s data industry, especially from technology infrastructure providers and cloud storage companies. This would help India emerge as a major and trusted player offering a full-fledged data storage ecosystem.
Encouraging Establishment of Data Centres in India IV.61 The requirement for establishing data centre infrastructure in India is reinforced by the data localisation provision in the Digital Personal Data Protection Act (DPDPA), 2023 for the protection of the digital sovereignty of the citizens in an increasingly connected world. India has enablers in the form of a favourable geographical location, established global connectivity through submarine cables, readily available skilled workforce, a large data consuming market and huge potential for growth in digital infrastructure38. These can lay the foundation for a robust and secure digital ecosystem for fuelling economic growth in India and making India a global data centre hub. IV.62 India’s data centre capacity is estimated to have more than doubled from 521 megawatt (MW) in 2020 to 1048 MW in 2023 in the light of fast-paced rise and spread of digitalisation and growing demand for advanced technologies such as 5G, AI, blockchain and cloud computing (CBRE, 2023). The main drivers creating a conducive environment for development of data centres in India include fiscal incentives, better technology infrastructure and regulatory push. The data centre market in India is, however, still at its nascent stage, relative to both AEs and peer EMEs (Charts IV.15 and IV.16). The Union Budget 2022-23 afforded the status of ‘infrastructure’ to data centres, thereby placing them at par with sectors such as railways, roadways, and power. This has enabled access to long-term credit on improved terms for the development of the sector. Most states in India have defined data centres as ‘essential service’ to ensure uninterrupted operations throughout the year. While most state incentives are in the form of stamp duty exemption, power subsidy and ease of approval, some offer tax benefits and a select few offer capital subsidies. 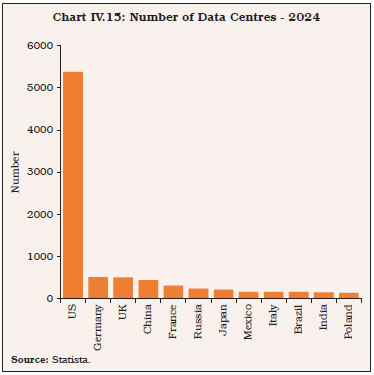 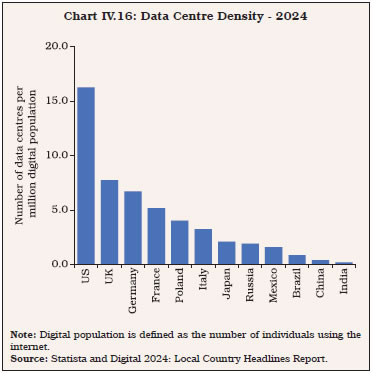 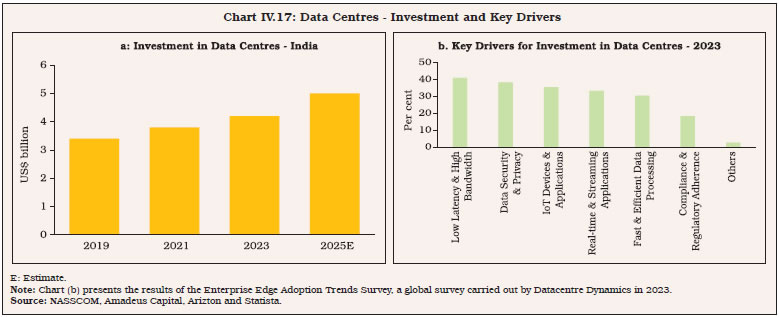 IV.63 The annual investment in data centres in India is expected to be US$ 5 billion by 2025, a CAGR of 6.6 per cent since 2019 (Chart IV.17a). This growth is attributed to India’s increasing internet usage and cloud computing demands with low latency (best speed and fastest response time) and high bandwidth, Government-led digitalisation initiatives, and the localisation efforts of digital service providers (Chart IV.17b). The growing investment in data centres stokes demand for related infrastructure, encompassing India’s IT, electrical, mechanical, and general construction services. As data centres require round-the-clock and large amount of electricity, appropriate policies would be needed to meet the higher energy demand in a sustainable way along with increased role of technology in clean electricity generation. Furthermore, the proper management of e-waste generated by data centres and establishment of green data centres may be encouraged (Raj, 2022). Some voluntary initiatives for greening data centres include switching over to renewable energy and implementing guidance provided by established frameworks such as the Green Data Centre Rating Systems (RBI, 2022c). IV.64 In the aftermath of the pandemic, the proportion of enterprises with no plan for cloud adoption is close to zero, whereas the proportion of enterprises with hybrid cloud which combines both public and private clouds has increased further (Chart IV.18). Public cloud adoption is also increasing. Cloud adoption is mainly guided by cost and performance. IV.65 With a view to enhancing the security, integrity and privacy of financial sector data, the Reserve Bank is in the process of establishing a cloud facility for the financial sector in India. The proposed facility would also facilitate scalability and business continuity (Das, 2023). The cloud facility will be set up and initially operated by the Indian Financial Technology and Allied Services (IFTAS), a wholly-owned subsidiary of the Reserve Bank (RBI, 2024b). Besides, the Reserve Bank is also developing a state-of-the-art greenfield data centre39 to address capacity expansion constraints in catering to the rapidly growing IT ecosystem’s requirements, while also offering a buffer to regions-pecific risks (Patra, 2024). 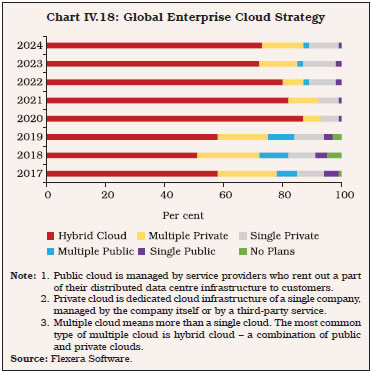 Data Localisation and Ring Fencing IV.66 The multi-fold increase in digital transactions across the financial landscape has necessitated regulatory measures for storage of critical data in the form of data localisation. Data localisation is broadly defined as the requirement of physical storage or processing of data within the territory of the country where it has been generated. Countries view the necessity of localisation measures in the light of growing digital interconnectedness amongst economies, that may have strategic or political implications (Bailey and Parsheera, 2018). As of early 2023, 96 data localisation measures across 40 countries were mandated, prescribing either storage or processing of data within the domestic territory (OECD, 2023b). More than two-third of these measures require domestic storage and prohibit data flow outside the country. Financial, banking and payments sectors have the maximum localisation measures, followed by public sector and telecommunications (Chart IV.19). 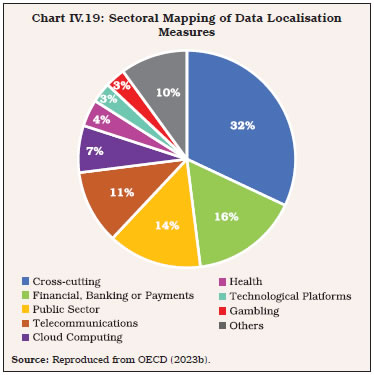 IV.67 Global revenues from data centres are projected to grow to US$ 575 billion by 2028 from US$ 312 billion in 2022, a CAGR of 10.7 per cent, led by the US (Chart IV.20). The revenue growth presents opportunities for spending on cloud infrastructure services (Chart IV.21). The spending on cloud infrastructure, which has overtaken that on data centre hardware and software, helps accelerate internet penetration, digital transformation initiatives and the rise of e-commerce, especially in developing economies. 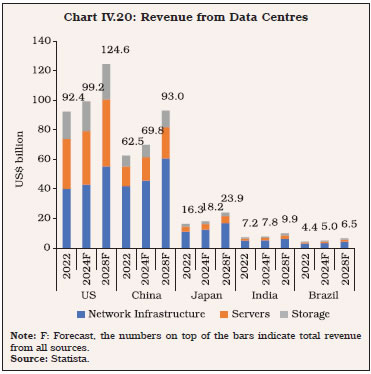 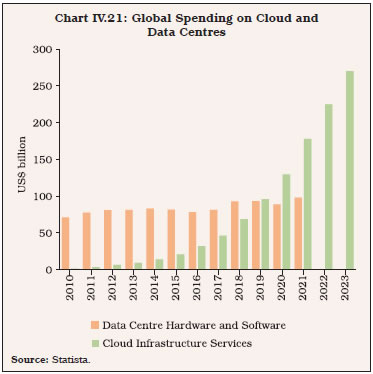 IV.68 Recognising the primacy of data and its vitality, regulators of various financial domains in India have framed data localisation rules. The Reserve Bank in April 2018 issued the circular on “Storage of Payment System Data” which deals with storage and processing of payments data, constituting end-to-end transaction details and information pertaining to payments. In view of the fast-paced growth in the payment ecosystem, these localisation measures were required to facilitate unrestricted access to all payment data for supervisory purpose. The payment data is to be stored in systems located in India with some exceptions. Even though payments data are allowed to be processed outside India, they have to be brought back to India after processing. The Securities and Exchange Board of India (SEBI) released the circular “Framework for Adoption of Cloud Services by SEBI Regulated Entities” in March 2023, which provides guidelines on data localisation while availing cloud services. It mandates that the storage and processing of data should be done within India’s domestic territory. Furthermore, the regulated entity shall keep the original data/transaction/logs for investors incorporated outside India. Similarly, the Insurance Regulatory and Development Authority of India (IRDAI) requires all insurance records to be stored in data centres located in India. Moreover, the DPDPA, 2023 provides overarching powers to agencies or regulators operating in various areas to frame their own rules on data storage and processing. 5. Challenges to Open Economy Digitalisation IV.69 The challenges to digitalisation in an open economy are multi-faceted, evolving, and far encompassing. These include aspects related to cybersecurity, data privacy, digital rights and access to information, divergent regulatory frameworks, data management and data sovereignty, digital infrastructure gaps and digital divide, skill gaps, job displacements, resource constraints and resistance to adoption of digital technologies, among others. Furthermore, issues related to interoperability and adoption standards, digital governance and accountability, ethical dilemmas and social implications of AI and automation, algorithmic bias and discrimination, digital monopolies and market concentration, digital trust and confidence, and digital disinformation and misinformation also confront policymakers. Intellectual property protection, digital environmental footprint, digital infrastructure resilience, sustainability and preparedness from disruption risks, including possible adverse implications of digitalisation on geopolitical tensions and trade barriers are amongst the other issues facing policy scrutiny. IV.70 There is immense scope for India to contribute to an inclusive global economy through its digitalisation and digital trade. According to the World Bank and the World Economic Forum, while online opportunities are accessible to at least 80 per cent of the population in developed countries, only 35 per cent of the population has access to such opportunities in developing countries. Globally, 19 out of every 100 people had fixed broadband subscriptions in 2023, while the figure for high-income countries was 39 per cent. In contrast, Asia-Pacific and Africa had 19 per cent and 1 per cent fixed broadband subscription penetration, respectively (ITU, 2023). Digital divide can exacerbate inequalities limiting opportunities for economic participation, social inclusion and digital empowerment. Further, there are challenges pertaining to labour market disruptions, generation of e-waste and carbon footprint. Digitalisation could also lead to skill mismatches and polarisation of employment opportunities between high-skilled, technologyintensive jobs and low-skilled, routine tasks susceptible to automation. IV.71 Addressing these challenges require comprehensive strategies and collaborative efforts between governments, businesses, civil society organisations, and other stakeholders to build trust, promote responsible use of technology, and harness the benefits of digitalisation for sustainable development and shared prosperity in an open economy. IV.72 The digital age provides immense opportunities for India to accelerate its transition from an emerging market economy to an advanced economy. Digitalisation can provide a strong boost to India’s external trade in goods and services, given the country’s relative comparative advantage in modern services exports, which are not conditional upon the geographical proximity of the trading partners. Further, digitalisation in international payment systems has the potential to reduce the cost of receiving remittances, thereby leading to higher remittances and income/savings for the recipients. Cross-border digital trade policies would play a crucial role in harnessing new opportunities, building trust, and facilitating coordination on regulatory aspects like data security and cybersecurity. The internationalisation of the INR is progressing backed by a comprehensive and integrated policy approach. IV.73 Central bank policy initiatives such as interlinkage of FPSs across economies, setting up the system of liquidity bridges and CBDCs are expected to support seamless international transactions, reduce foreign exchange risks and manage global liquidity in an effective manner. India has the potential to revolutionise the global landscape with its DPI. Given solid foundational physical and digital infrastructure, the amount and strength of human capital, and openness to innovation, India can emerge as a major manufacturing hub, leading exporter of services, and provide higher relative returns on global capital. The robustness of India’s DPI, recognised by international bodies like the IMF and the G20 (WEF, 2023), provides a scalable model that can address pressing issues in EMDEs, such as financial inclusion, leakages in welfare payments, education, and ease of doing business. With its commitment towards inclusive growth and sustainable development, India is poised to lead the digital transformation of the Global South, emerging as a pivotal player in setting the agenda for cross-border regulations on DPIs, trade and capital, data, and migration. IV.74 India’s state-of-the-art DPI has enormous potential for enhancing cross-border trade across sectors like finance, health, education, agriculture and MSMEs. These efforts could get a large push from a further deepening of India’s DPI resilience by strengthening self-reliance in sea cables, expanding satellite internet connectivity, making UPI global and providing pro-active policy support to data localisation. To fully harness the potential of India’s DPI, there is a need to leverage the framework of One Future Alliance, wherein EMEs can share their best practices to fasten the process of digitalisation, and gain from its benefits. References ACI Worldwide (2024). It’s Prime Time for Real-Time: Real-time payments adoption around the globe. ADB (2021). Capturing the Digital Economy: A Proposed Measurement Framework and Its Applications--A Special Supplement to Key Indicators for Asia and the Pacific 2021. Asian Development Bank. August. Aker. Jenny C., Rachid, B. McClellan, A. Niall T (2016). Payment Mechanisms and Antipoverty Programs: Evidence from a Mobile Money Cash Transfer Experiment in Niger. Economic Development and Cultural Change, 65 (1): 1–37. Alonso, C., Bhojwani, T., Hanedar, E., Prihardini, D., Uña, G., and Zhabska, K. (2023). Stacking up the benefits: Lessons from India’s digital journey. International Monetary Fund. Amaglobeli, D., de Mooij, R. and Moszoro, M. (2023). Harnessing GovTech to Tax Smarter and Spend Smarter. IMF Blog. September 7. Atlantic Council (2024). Central Bank Digital Currency Tracker, accessed on June 24, 2024. Auer, R., Cornelli, G., and Frost, J. (2023). Rise of the central bank digital currencies. International Journal of Central Banking, 19(4), 185-214. Auer, R., Haene, P. and Holden, H. (2021). Multi-CBDC arrangements and the future of cross border payments. BIS Papers No 115. Bailey, R. and Parsheera, S. (2018). Data localisation in India: Questioning the means and ends. Working Paper No. 242. National Institute of Public Finance and Policy New Delhi. Bank of England (2024). Cross-border payments. Webpage https://www.bankofengland.co.uk/payment-and-settlement/cross-border-payments Bekkers, E., Koopman, R., Sabbadini, G., and Teh, R. (2021). The impact of digital technologies on developing countries’ trade. Smeets (Ed.), 36-53. Bertaut, C., von Beschwitz, B., and Curcuru, S. (2021). The international role of the US dollar. FEDS Notes. October. Bharat, D. (2023). Data Embassies in India. Indian Journal of Project, Infrastructure and Energy Law. July. BIS (2021). Central bank digital currencies for cross-border payments. Report to the G20. BIS (2022a). Liquidity bridges across central banks for cross-border payments- Analysis and Framework. Committee on Payments and Market Infrastructures. BIS (2022b). Interlinking payment systems and the role of application programming interfaces: a framework for cross-border payments. CPMI Report to the G20. BIS (2022c). OTC foreign exchange turnover in April 2022. Triennial Central Bank Survey. October 27. BIS (2023). Project Nexus: Enabling instant cross-border payments. March. BIS (2024). Project mBridge reaches minimum viable product stage and invites further international participation. Press Release. June 5. BIS, IMF, and World Bank (2021). Central Bank Digital Currencies for Cross-Border Payments. Report to the G20. July. Bloomberg (2023). Generative AI to Become a $1.3 Trillion Market by 2032. Research Finds. June. Boz, E., Casas, C., Georgiadis, G., Gopinath, G., Le Mezo, H., Mehl, A., and Nguyen, T. (2022). Patterns of invoicing currency in global trade: New evidence. Journal of International Economics, 136, 103604. Brunnermeier, M. K., James, H., and Landau, J. P. (2019). The digitalization of money (No. w26300). National Bureau of Economic Research. CBRE (2023). From Bytes to Business: India Data Centre Market Powering Progress in 2023. CBRE Research Report. December. Chaisse, J. (2023). ‘The Black Pit:’Power and Pitfalls of Digital FDI and Cross-Border Data Flows. World Trade Review, 22(1), 73-89. Chen, S., Goel, T., Qiu, H., and Shim, I. (2022). CBDCs in emerging market economies. BIS Papers. Chinn, M.D. and Ito, H. (2006). What Matters for Financial Development? Capital Controls, Institutions, and Interactions. Journal of Development Economics, 81(1), 163-192. Choi, C. (2010). The effect of the internet on service trade. Economics Letters, 109 (2), 102–104. Church, J. (2023). How does SWIFT Compare with the FinTech Alternative? TransferMate Blog. January 17. CLS (2024). Webpage https://www.cls-group.com/about/. Continuous Linked Settlement Group. da Silva Filho, T.N.T. (2022). Curb Your Enthusiasm: The Fintech Hype Meets Reality in the Remittances Market. IMF Working Paper No. 2022/233. Das, S. (2023). Governor’s Statement on Development and Regulatory Policies. December 8. Das, S. (2024). Evolution of financial markets in India: Charting the Future. Keynote Address by Governor, Reserve Bank of India at the FIMMDA-PDAI Annual Conference, Barcelona. April 8. Deloitte (2023). The Digital Dominance: Catalysing India’s rise as a global digital leader. Demirgüç-Kunt, A. Klapper, L. Singer, D. and Ansar, S. (2022). The Global Findex Database 2021: Financial inclusion, digital payments, and resilience in the age of COVID-19. World Bank Publications. Duffie, J.D. (2020). Interoperable payment systems and the role of Central Bank Digital currencies”, SSRN Electronic Journal, No. 3867. Ernst and Young (2023). Can a future-back lens help you see a clearer path to success? Future of GCCs in India - a vision 2030 report. June. FSB (2021). “Targets for Addressing the Four Challenges of cross-Border Payments”, Final Report. FSB (2022). G20 Roadmap for Enhancing Cross-border Payments: Priorities for the next phase of work. Progress Report. October. FSB (2023). G20 Roadmap for Enhancing Cross-border Payments. Consolidated Progress Report. Gajbhiye, D., Kundu, S., Saroy, R., Rawat, D., George, A., Vinherkar, O., and Sinha, K. (2024). What Drives India’s Services Exports? Reserve Bank of India Bulletin, April. Gajbhiye, D., R. Arora, A. Nahar, R. Yangdol and I. Thakur. (2022). Measuring India’s Digital Economy. Reserve Bank of India Bulletin, 76(12). GoI (2023). Union Budget 2023-24. GoI (2024). Report of India’s G20 Task Force on Digital Public Infrastructure. July 15. González, J. L. and S. Sorescu (2021). Trade in the time of parcels. OECD Trade Policy Papers No. 249. OECD Publishing, Paris. González, J. L. Sorescu, S. and Kaynak, P. (2023). Of bytes and trade: Quantifying the impact of digitalisation on trade. OECD Trade Policy Paper No. 273. Gopinath. G., and Stein, J. C. (2018). Banking, Trade, and the Making of a Dominant Currency. NBER Working Paper 24485. Graydon, M., and Parks, L. (2020). ‘Connecting the unconnected’: a critical assessment of US satellite Internet services. Media, Culture and Society, 42(2), 260-276. Hayek, F. A. V. (1976). Denationalisation of money: an analysis of the theory and practice of concurrent currencies (Vol. 70). Ludwig von Mises Institute. He, D. (2021). Digitalisation of cross-border payments. China Economic Journal 14 (1). Herman, P. R., and Oliver, S. (2023). Trade, policy, and economic development in the digital economy. Journal of Development Economics 164: 103135. Huang, K. and Madnick, S.E. (2020) Cyber Securing Cross-Border Financial Services: Calling for a Financial Cybersecurity Action Task Force. Working Paper Cybersecurity Interdisciplinary Systems Laboratory (CISL). IMF (2011). Internationalization of Emerging Market Currencies: A Balance between Risks and Rewards. SDN/11/17. IMF (2018a). Towards a Handbook on Measuring Digital Trade: Status Update. 31st Meeting of the IMF Committee on Balance of Payments Statistics. IMF (2018b). Measuring Digital Economy. Policy Papers. April. IMF, OECD, UN and WTO (2023). Digital Trade for Development. Inc42 (2024). Indian GenAI Startup Tracker: 60+ Startups Putting India On The Global AI Map. July 4. INDIAai (2023). AI will elevate the India Stack to be more sophisticated and nuanced: Rajeev Chandrasekhar, Minister of State of Electronics and IT. January 27. ITU (2023). Broadband subscriptions continue to grow strongly, Facts and Figures 2023. International Telecommunication Union. Juodis, A. Karavias, Y. and Sarafidis, V. (2021). A homogeneous approach to testing for Granger non-causality in heterogeneous panels. Empirical Economics 60(1), p. 93-112. Kim, S., Miksjuk, A., Suryakumar, N., Tuladhar, A., Velculescu, D., Wu, Y., and Hallmark, N. (2024). Digital Money, Cross-Border Payments, International Reserves, and the Global Financial Safety Net: Preliminary Considerations. IMF Notes, 2024(001). KPMG (2023). Expanding tech horizons: Unlocking India’s digital potential. October. Lara De Arruda, P., Lazarotto De Andrade, M., Falcao Silva, T., Teixeira Barbosa, D., and Morgandi, M. (2022). Challenges and potentialities for implementing social protection responses. World Bank Latin American and Caribbean Studies. Lin, F. (2015). Estimating the effect of the internet on international trade. The Journal of International Trade & Economic Development, 24(3), 409–428. Majumdar, S.K., Sarma A.P. and Majumdar, S. (2020). E-commerce and Digital Connectivity: Unleashing the Potential for Greater India-ASEAN Integration. Journal of Asian Economic Integration. Maslej, N., Fattorini, L., Perrault, R., Parli, V., Reuel, A., Brynjolfsson, E., Etchemendy, J., Ligett, K., Lyons, K, Manyika, J., Niebles, J.C., Shoham, Y., Wald, R., and Clark, J. (2024). The AI Index 2024 Annual Report. AI Index Steering Committee, Institute for Human-Centered AI, Stanford University. April. Meltzer, J.P., and Kerry, C.F. (2019). Cybersecurity and digital trade: Getting it right. September 18. Muralidharan, K. Paul N. and Sandip S. (2016). Building State Capacity: Evidence from Biometric Smartcards in India. American Economic Review 106 (10): 2895–929. Nilsson, T., Bouther, R., Acoleyen, M.V., and Cohen, L. (2022). SWIFT GPI Data Indicate Drivers of Fast Cross-border Payments. BIS CPMI. February 8. OECD (2008). Information Economy Product Definitions Based on the Central Product Classification (version 2). OECD Digital Economy Papers No. 158. OECD (2022). Singapore’s National Digital Identity—Singpass. Observatory of Public Sector Innovation (blog). November 16. OECD (2023a). Handbook of Measuring Digital Trade (Second Edition). OECD (2023b). The nature, evolution and potential implications of data localisation measures. OECD Trade Policy Paper. OECD (2024a). OECD Digital Economy Outlook 2024 (Volume 1) Embracing the Technology Frontier. OECD (2024b). Building a Skilled Cyber Security Workforce Insights From OECD Countries. Synthesis Note. Patra, M. D. (2024). Harnessing Digital Technologies in Central Banks: Opportunities and Challenges. Speech, January 17. Perez-Saiz, H. Longmein, Z. Iyer, R. (2023). Currency Usage for Cross Border Payments. IMF Working Working Paper No. 2023/072. Prasad, E. (2023). Managing risks from crypto assets and decentralized finance: an emerging market and developing economy perspective. Background Note for G-20 Discussions on Regulation of Crypto Assets. June. PIB (2024). Union Minister Ashwini Vaishnaw launches NITI Aayog’s – ‘NITI for States’ Platform. Niti Aayog. March 7. PWC (2017). The long view how will the global economic order change by 2050? February. Raj, B. and D. Verma (2022). Green Data Centres: Pathway to Sustainable Digitalisation. Reserve Bank of India Bulletin, Vol. 76(11). RBI (2022a). Benchmarking India’s Payment Systems. RBI (2022b). Report of the Inter-Departmental Group (IDG) on Internationalisation of INR. RBI (2022c). Discussion Paper on Climate Risk and Sustainable Finance. July. RBI (2023a). Report on Currency and Finance: Towards a Greener and Cleaner India, May. RBI (2023b). Reserve Bank of India and Central Bank of the UAE sign two MoUs to (i) establish a Framework to Promote the Use of Local Currencies for Cross-border Transactions and (ii) cooperation for interlinking their payment and messaging systems. Press Release. July 15. RBI (2023c). UPI-PayNow Linkage. Frequently Asked Questions. February 21. RBI (2024a). Reserve Bank of India and Bank Indonesia Sign Memorandum of Understanding (MoU) to Promote Use of Local Currencies for Bilateral Transactions. Press Release. March 7. RBI (2024b). Annual Report 2023-24. Sankar (2023). Edited Transcript of All India Radio’s Exclusive Interview with Deputy Governor, Shri T. Rabi Sankar. February 22. Statista (2023). Artificial Intelligence: in-depth market analysis. Market Insights report. April. Stephenson, M. (2020). Digital FDI: Policies, Regulations and Measures to Attract FDI in the Digital Economy. World Economic Forum White Paper. September. SWIFT (2022). SWIFT in Figures December 2022 YTD. SWIFT (2024). Webpage https://developer.swift.com/apis TechHerald (2021). Fixed broadband services to grow at a CAGR of 7.1% by 2025. April 22. The Economist (2023). Big tech and geopolitics are reshaping the internet’s plumbing - Data cables are turning into economic and strategic assets. December 20. UNCTAD (2017). World Investment Report 2017: Investment and the Digital Economy. Vainsalu, H. (2017). How Do Estonians Save Annually 820 Years of Work without Much Effort? e-Estonia (blog). December 12, 2017. Watson, E. (2024). The India Stack as a Potential Gateway to Global Economic Integration. Issue Brief No. 700. Observer Research Foundation. March. WEF (2023). The international significance of India’s Digital Public Infrastructure. August 23. World Bank (2018). Private Sector Economic Impacts from Identification Systems. World Bank (2022). The Role of Digital in the COVID-19 Social Assistance Response. January. World Bank (2023). Deep Dive into the Ecosystem for the Delivery of Social Assistance Payments: Türkiye Case Study. World Bank (2024a). Digital Progress and Trends Report 2023. World Bank (2024b). Remittances Slowed in 2023, Expected to Grow Faster in 2024. Migration and Development Brief 40. June. World Bank (2024c). Remittance Prices Worldwide Quarterly, Issue 49, March. WTO (2024). Thirty years of trade growth and poverty reduction. WTO Blog (April). * This chapter has been prepared by a team comprising Dhirendra Gajbhiye, Sujata Kundu, Rajas Saroy, Alisha George, Dirghau Keshao Raut, Manu Sharma, Abhilasha, Prashant Kumar, Satyendra Kumar, Thangzason Sonna, Ramesh Kumar Gupta from the Department of Economic and Policy Research; and Aniket Ranjan from the FinTech Department. 1 Open economy digitalisation refers to the use of digitally-enabled products/services in trade, income and investment in a cross-border setting. 2 In 1995, OECD countries represented 82 per cent of estimated global digital trade (exports). Their share fell to 73 per cent by 2018 (González et al., 2023). 3 As per IMF (2018a), digital trade is defined as all cross-border transactions that are either digitally ordered (i.e., cross-border e-commerce), digitally facilitated (by platforms) or digitally delivered. While digital trade forms a part of the conventional cross-border trade statistics, non-monetary digital flows, which comprise cross-border non-monetary information and data flows, are not included. 4 These 10 digitally disrupted sectors include: land transport services and transport services via pipelines; accommodation services; food and beverage serving services; publishing services; motion picture, video and television programme production services; sound recording and music publishing services; financial and insurance services; advertising and market research services; travel agency, tour operator and other reservation services; education services; and gambling and betting services. 5 Estimate for the global digital economy is from ADB (2021) and for the Indian digital economy is from Gajbhiye et al., (2022). 6 Gajbhiye et al., (2022) follow the Asian Development Bank (ADB) approach that uses national Input-Output Tables (IOTs) to measure the size of the digital economy. 7 The General Agreement on Trade in Services (GATS) distinguishes between four modes of supplying services: cross-border trade, consumption abroad, commercial presence and presence of natural persons. 8 Based on the assumption of 10.1 per cent growth in India’s nominal GDP (in US$ terms) during 2001-2019; and the annual average share of India’s digitally delivered services trade in India’s GDP of 6.6 per cent – the value realised during 2011-2019, a period of significant advances in digitalisation in India. 9 Assuming real GDP growth to be 9.6 per cent (RBI, 2023a), and inflation to be around 4 per cent, as envisaged in the current target of India’s flexible inflation targeting monetary policy framework. 10 Assuming world real GDP growth to be 2.6 per cent (PWC, 2017), and inflation of around 5.5 per cent, which is the historical average from 1993-2023. 11 Trade in Value Added (TiVA) 2023 ed. Principal Indicators, OECD.Stat. 12 Services exports-Category 1 includes insurance and pension services, financial services, telecommunication, computer and information services and other business services. 13 Services exports-Category 2 includes telecommunication, computer and information services and other business services. 14 Standard gravity models include controls such as distance, contiguity/common region, common language and former colony/common legal origin. 15 Similar results are obtained under panel fixed effects with year dummies. Further, similar results were obtained when the sample period was restricted to pre-pandemic years, i.e., 2015-19. 16 A measure of the intensity with which LinkedIn members use AI skills in their jobs. 17 FinTechs specialising in transferring remittances. 18 Data are collected at the customer level for the major service providers in each corridor, including both the primary MTO and banks active in the market. The dataset includes the costs for two amounts – the equivalents of US$ 200 and US$ 500 in local currency. Since data may be collected for different individuals across periods, pooled OLS estimates are used with errors clustered by country. 19 The underlying estimation also controlled for other variables affecting cost of remittance such as income level of sending country, coverage of the respective MTO’s network in sending and receiving countries, and the forex margin charged. 20 Average adjusted predictions of remittance cost as estimated in the pooled OLS regression models, if all observations in the dataset were to assume the same value for variable of interest X as indicated, with the value for other predictors remaining the same. 21 Examples include Australia-Singapore Digital Economy Agreement (2020), the Digital Economy Partnership Agreement (DEPA) between Singapore, Chile and New Zealand, and the Digital Partnership Agreement between South Korea and Singapore (2023). 22 India passed Digital Personal Data Protection Act (DPDPA) in August, 2023. 23 In Hayek’s view (Hayek, 1976), currencies would compete primarily as stores of value. Historically, however, this type of competition has been limited due to switching costs and network externalities. Currencies that act as a store of value may compete with one another, while others that act as a medium of exchange compete separately. When switching costs are low, there is no longer a strong incentive to use one currency for store of value, medium of exchange and unit of account simultaneously. Instead, users of the network can seamlessly switch among currencies and convert units when needed. 24 While investment flows include both FDI and FPI, we consider only FDI in our analysis. 25 RBI staff estimates using data for calendar year 2021 (the latest available bilateral data) for merchandise trade (Ministry of Commerce and Industry, GoI), services trade (WTO-OECD Balanced Trade in Services Dataset), FDI flows (Department for Promotion of Industry and Internal Trade, GoI), and remittances (World Bank). 26 A special type of retail payment system in which the transmission of the payment message and the availability of the final funds to the payee occur in real time or near real time and on as near to a 24/7 basis as possible. 27 The ACU, started in 1974, is presently operating as a clearing and payment system among its members (Bangladesh, Bhutan, Iran, India, Maldives, Myanmar, Nepal, Pakistan and Sri Lanka) for the promotion of trade among the participating countries. 28 The SAARC Currency Swap Framework came into operation on November 15, 2012, to provide a backstop line of funding for short-term foreign exchange liquidity requirements or short-term balance of payments stress till longer-term arrangements are put in place. Afghanistan, Bangladesh, Bhutan, India, Maldives, Nepal, Pakistan and Sri Lanka are part of the SAARC grouping. Under the Framework for 2024-27, a separate INR Swap Window has been introduced with various concessions for swap support in INR. The total corpus of the INR support is ₹250 billion. The RBI will continue to offer swap arrangement in US$ and Euro under a separate US Dollar/ Euro Swap Window with an overall corpus of US$ 2 billion. The Currency Swap Facility will be available to all SAARC member countries, subject to their signing the bilateral swap agreements. 29 Size of total annual flows greater than US$ 10 billion. 30 The settlement risk that one party will deliver foreign exchange but the counterparty financial institution will fail to complete its end of the contract. 31 As per the World Bank, the Auxílio Emergencial, a social protection programme, reached up to 55.6 per cent of the population, considering both direct and indirect beneficiaries. The programme helped to improve the average income and reduce the prevalence of poverty and inequality as compared with the immediate pre-pandemic level. 32 Interlinking arrangements for cross-border payments can be defined as a set of contractual agreements, technical links and standards, and operational components between payment systems of different jurisdictions, allowing their respective participating payment service providers (PSPs) to transact with one another as if they were in the same system (BIS, 2022b). 33 APIs enable a software application to request a specific piece of data from one or more other software applications, and for data transfer from the data providing application back to the requester, provided the original request was valid. 34 The ISO 20022 standard enables the consistency of data in payment messages, the ability to reuse components across messages and is more data-rich than its predecessors. It can facilitate automated payment processing with faster messaging and lower payment failure rates. 35 A dedicated secure space within a building/centralised location where computing and networking equipment is concentrated for the purpose of collecting, storing, processing, distributing or allowing access to large amounts of data (Data Centre Policy – 2020, MeitY). 36 A data centre of a country housed within the borders of another country while remaining under the formal jurisdiction of the former country. 37 The origin of data embassies derives from a bilateral agreement in 2017 when Estonian government’s cloud backup was housed in a Luxembourg data facility. Similarly, in 2021, Monaco’s e-embassy was set up in Luxembourg, hosting a digital twin of the Monegasque sovereign cloud. Luxembourg appears to be an attractive destination for modern data centres because of its robust business continuity, resilient communication infrastructure, and comprehensive disaster recovery capabilities (Bharat, 2023). 38 Table A.5 of World Bank (2024a) gives cross-country comparison of select indicators of digital infrastructure. 39 The Reserve Bank currently has three data centres – two brownfield and one greenfield. |
|||||||||||||||||||||||||||||||||||||||||||||||||||||||||||||||||||||||||||||||||||||||||||||||||||||||||||||||||||||||||||||||||||||||||||||||||||||||||||||||||||||||||||||||||||||||||||||||||||||||||||||||||||||||||||||||||||||||||||||||||||||||||||||||||||||||||||||||||||||||||||||||||||||||||||||||||||||||||||||||||||||||||||||||||||||||||||||||||||||||||||||||||||||||||||||||||||||||||||||||||||||||||||||||||||||||||||||||||||||||||||||||||||||||||||||
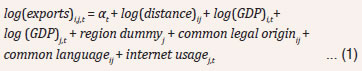


Share this page:


Install the RBI mobile application and get quick access to the latest news!
Scan the QR code to install our app


Page Last Updated on:


