
Global Banking Developments - RBI - Reserve Bank of India


Global Banking Developments
| The global banking sector exhibited improvement in asset quality and capital and provision buffers during 2024. Credit growth and profitability moderated, reflecting the impact of tight financial conditions. Global regulatory and supervisory actions were directed towards addressing concerns regarding securitisation, resilience of the non-banking financial sector, climate and nature-related risks and regulation of crypto-assets. Going forward, policy makers will have to remain vigilant against build-up of risks in the financial system amidst escalating geopolitical tensions, rapidly emerging new technologies and increasing climate-related risks. 1. Introduction II.1 In 2024, the global economy recovered from post-pandemic supply-chain disruptions, and multi-decadal high inflation1. Global growth stabilised and inflation eased to striking distance of targets across major jurisdictions. Geopolitical tensions, ongoing geoeconomic fragmentation, high government debt, stretched asset valuations, cyber threats in conjunction with technological transformation and climate change-related issues, however, weigh on the outlook. II.2 The global banking sector successfully navigated these turbulences. Strains faced by banks in some jurisdictions in March 2023 were alleviated by swift policy interventions. Although a systemic spillover impact was avoided, this episode flagged financial stability challenges emanating from the liabilities side of banks’ balance sheets. Yet, asset quality, provisions and capital buffers remained satisfactory across advanced economies (AEs) and emerging market and developing economies (EMDEs). II.3 Against this backdrop, this chapter covers developments in the global banking sector. Section 2 reviews current global macroeconomic conditions. Global banking policy developments are discussed in Section 3. Section 4 examines the performance of the global banking sector, while Section 5 focuses on the performance and soundness of the top 100 global banks ranked by Tier 1 capital positions. Section 6 concludes with an overall assessment. 2. Global Macroeconomic Conditions II.4 Global gross domestic product (GDP) is estimated to grow by 3.2 per cent in both 2024 and 20252 (Chart II.1a). Inflation is gradually receding from multi-decadal highs across geographies on the back of aggressive monetary tightening, and corrections in food and energy prices. It is estimated to moderate from 6.7 per cent in 2023 to 5.8 per cent in 2024 and further to 4.3 per cent in 2025 (Chart II.1b). Services inflation, however, remains at elevated levels across AEs and poses upside risks to the inflation trajectory. 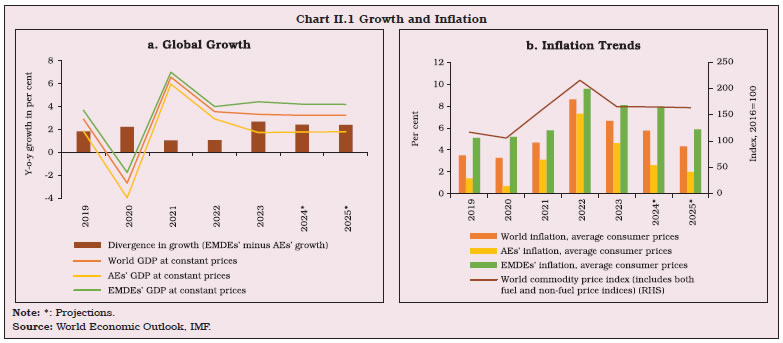
II.5 Major central banks have started reducing policy rates as they gain confidence that inflation is moving towards targets. The US Federal Reserve reduced the federal funds target rate by 50 basis points (bps) on September 18, 2024 - the first rate cut since March 2020 – and by 25 bps each in November and December, 2024. The European Central Bank (ECB) changed its monetary policy operational framework with effect from September 2024. Deposit facility rate (DFR) is now the de facto policy rate through which the ECB will steer its monetary policy stance, as compared to the main refinancing operations (MROs) rate, which was the earlier policy rate. During 2024, the ECB cut the policy rate four times. The Bank of England (BoE) started its easing cycle with a reduction of 25 bps in August 2024, followed by another 25 bps reduction in November 2024. The Bank of Japan exited its negative interest rate policy after eight years and abandoned yield curve control (Chart II.2a). Monetary policy responses of EMDE central banks were more varied. Chile began cutting rates in 2023 and continued with its easing cycle into 2024. Indonesia and South Africa began their easing cycles in September 2024. Brazil, on the other hand, reversed its easing cycle with a cumulative increase of 175 bps in the policy rate during September 2024 to December 2024 in response to inflation moving above the target. China announced monetary and other stimulus measures in September 2024 to support economic growth and address property sector risks (Chart II.2b). 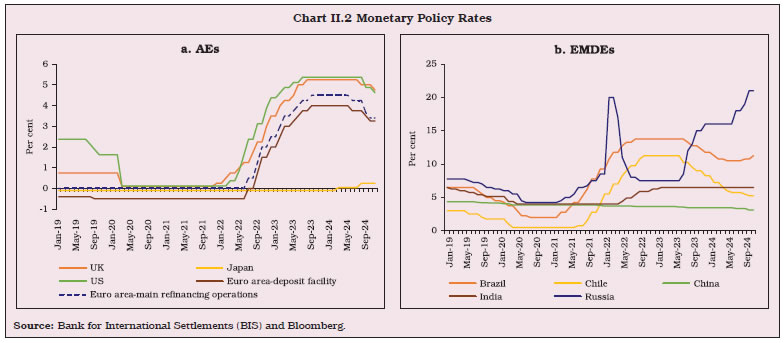
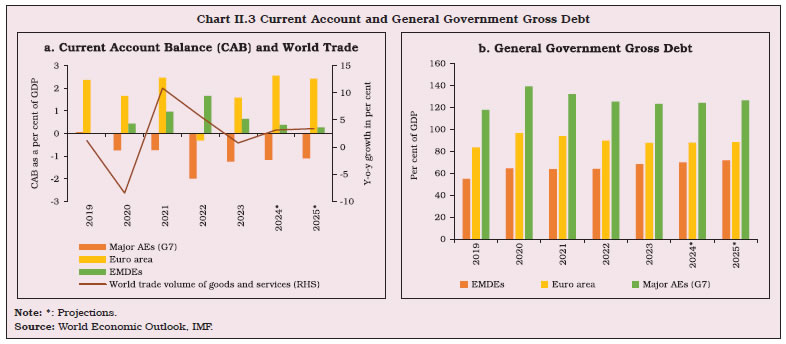
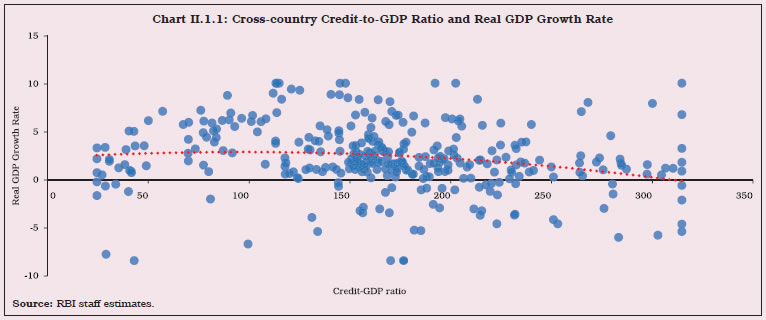
II.6 After widening substantially during the pandemic years (2020-2022), the current account deficit (CAD) of AEs has been moderating, though it remains higher than in the pre-pandemic years. Growth in the volume of world trade in goods and services recovered to 3.1 per cent in 2024 from 0.8 per cent in 2023, driven by ebbing inflation and increased exports from Asia, particularly in the technology sector (Chart II.3a). Government deficits and debt, which came under pressure in 2020 due to the large pandemic-related support, remained elevated, especially for AEs (Chart II.3b). High government debt levels also posed challenges for EMDEs in an environment of tight financial conditions. 3. Global Banking Policy Developments II.7 Systemic spillovers from the failure of Silicon Valley Bank and some U.S. regional banks in March 2023 and the collapse of Credit Suisse before its merger with the UBS in June 2023 were avoided through swift and sizeable regulatory actions and liquidity support. These episodes, however, raised concerns about the resilience of the banking sector and exposed weaknesses in governance, risk management practices, and regulatory frameworks. The growing role of non-banking financial institutions (NBFIs) in the recent years has added an additional layer of complexity to the financial system. Regulators and central banks are strengthening their supervisory frameworks to mitigate systemic risks emanating from interconnectedness. The increased adoption of digital banking and FinTech solutions highlights the need to improve traditional banking models and address new regulatory challenges3. 3.1 Building Resilient Financial Institutions4 II.8 The March 2023 banking turmoil highlighted the need for prudent regulation and effective supervision and underlined the importance of implementing all aspects of the Basel III framework. Basel Committee on Banking Supervision (BCBS) member jurisdictions have made significant progress in implementing the final Basel III elements, effective January 1, 2023. As of September 2024, one-fourth of Financial Stability Board (FSB) member jurisdictions had fully implemented the final elements of Basel III, while most member jurisdictions had published final rules for most of the elements5. Since end-September 2023, around half of the 27 member jurisdictions have published the final rules for the revised credit risk, market risk and operational risk standards as well as the output floor. In addition, three member jurisdictions have issued the final rules for the revised leverage ratio exposure definition. As a result, over two-thirds of member jurisdictions have now published final rules for all the final elements of Basel III and these standards are in force in more than a third of the member jurisdictions. II.9 Further progress has also been made on other standards that had implementation dates before January 1, 2023. Since end-September 2023, eight jurisdictions have completed implementing the interest rate risk in the banking book standard, seven have implemented various disclosure elements, and two each have implemented margin requirements for non-centrally cleared derivatives (NCCDs), capital requirements for exposures to central counterparties (CCPs), and large exposures framework (LEF). For capital requirements for equity investments in funds, securitisation framework and monitoring tools for intra-day liquidity management, one more member jurisdiction has published final rules. 3.2 Too-Big-to-Fail Reforms6 II.10 The FSB’s work on bank resolution until now has primarily been focused on global systemically important banks (G-SIBs) and significant progress has been made in this regard. However, the 2023 banking turmoil highlighted the importance of resolution planning and loss-absorbing capacity for non-systemically important banks as well. In November 2024, the FSB emphasised that the existing guidance on resolution planning and execution may also be relevant for banks that may be systemically significant or critical if they fail, as such failure may also have severe consequences for the financial system or the broader economy7. The FSB recommended jurisdictions to enhance the usability of resolution tools, address liquidity in resolution, and ensure options to manage distress without systemic disruption and exposing taxpayers to loss. II.11 The BCBS has found that the G-SIB assessment framework is influenced by year-end values of the indicators reported by participating banks. To address these concerns, the BCBS has proposed revisions requiring banks participating in the G-SIB assessment exercise to report and disclose the stock G-SIB indicators based on average of values over the reporting year instead of year-end values8. 3.3 Making Derivatives Markets Safer II.12 Implementation of the G20 over-the- counter (OTC) derivatives reforms has progressed well in major jurisdictions over the years. Jurisdictions with majority of global OTC derivatives activity have implemented comprehensive trade reporting requirements, central clearing and platform trading frameworks, and capital and margin requirements for NCCDs. Jurisdictions yet to implement these reforms account for a low proportion of global OTC derivative market activity. II.13 Over the past five years, the number of FSB member jurisdictions with comprehensive trade reporting requirements has remained unchanged, with only one additional jurisdiction adopting central clearing or platform trading frameworks9. 3.4 Securitisation II.14 A number of regulatory reforms have been introduced since the global financial crisis (GFC) in 2008 to improve transparency, address conflicts of interest, strengthen the regulatory capital treatment for banks’ securitisation exposures by improving risk sensitivity and reducing cliff effects, and align incentives associated with securitisation. In July 2024, the FSB published a consultative report, evaluating the effects of the G20 financial regulatory reforms on securitisation10. The findings suggest that the reforms have contributed to the resilience of the securitisation market without strong evidence of material negative side-effects on financing to the economy. 3.5 Non-Bank Financial Intermediation II.15 NBFIs accounted for almost half of global financial assets at end-2022. Concerns regarding their growing size and interconnectedness came to the fore in the aftermath of the GFC, the March 2020 pandemic-related market turmoil, the 2021 Archegos Capital episode, and more recently during the Chinese property sector crisis. In April 2024, the BCBS issued a consultative document with guidelines for counterparty credit risk (CCR) management to replace the 1999 guidelines. These include key practices critical to resolving long-standing industry weaknesses in CCR management. II.16 Further, to enhance the resilience of the sector and monitor its developments, the FSB and standard setting bodies (SSBs) proposed policies in early 2024 to enhance margining practices and liquidity preparedness of non-bank market participants for margin and collateral calls11. 3.6 March 2023 Banking Turmoil II.17 In October 2024, the FSB published a report which identified three types of entities most vulnerable to a combination of solvency and liquidity risks: weak banks, life insurers, and non-bank real estate investors12. The report also highlighted that technological advancements have facilitated easier and faster deposit transfers, and social media may have influenced some of the recent bank runs. II.18 In October 2024, the BCBS, at the request of the G20 Brazilian Presidency, published a report which summarises the lessons on liquidity risk learnt from the March 2023 banking turmoil13. These lessons include: (i) liquidity supervision may need to evolve in light of recent experience; (ii) importance may be accorded to monitoring and managing risks for internationally active banks at a consolidated group as well as legal entity level; and (iii) discussions may be warranted on the calibration of assumptions of the Basel standards of liquidity coverage ratio (LCR) and net stable funding ratio (NSFR). 3.7 Central Counterparty II.19 The systemic importance of CCPs has spurred steps to ensure the availability of sufficient liquidity, loss-absorbing capacities, and recapitalisation tools to sustain the CCPs’ essential functions and mitigate the potential negative impacts on financial stability during a resolution. In 2024, the FSB devised a “toolbox” approach setting a global standard for financial resolution resources and tools for CCPs that are deemed systemically important14. The toolbox approach provides authorities the flexibility to select from a range of resources and tools, complementing the ones that already existing in their jurisdictions. 3.8 Cross-Border Payments II.20 In October 2024, the FSB published its second Key Performance Indicators (KPIs) report on meeting targets for cross-border payments, which highlighted areas of progress and identified challenges15. The report concluded that at the global level, the KPIs show limited progress towards achieving the targets and that the differences across regions and corridors remain, with some regions continuing to face greater challenges, particularly in meeting the targets set for cost and speed. II.21 To take the G20 roadmap forward, the FSB published two consultation reports in July 2024, one which puts forth policy recommendations to promote alignment and interoperability across cross-border payments related data frameworks, and the other which sets out policy recommendations to strengthen the consistency in the regulation and supervision of banks and non-banks in their provision of cross-border payment services in a way that is proportionate to the risks associated with such activities16, 17. II.22 Service-level agreements (SLAs) used in cross-border payment arrangements define minimum service levels for correspondent banking relationships. In April 2024, the Committee on Payments and Market Infrastructures (CPMI) published a report advocating the establishment of clear, transparent and enforceable SLAs, which may effectively mitigate risks from cross-border payments, adequately define transparent and efficient payment processing rules, ensure timeliness and finality of settlement, and promote interoperability with internationally accepted technical standards18. 3.9 Climate and Nature-related Risks II.23 Addressing financial risks emanating from climate change is a key priority for all international bodies. The International Organisation of Securities Commissions (IOSCO), the International Sustainability Standards Board (ISSB), and other relevant bodies have collaborated to support jurisdictions in adopting and applying the ISSB’s new sustainability-related disclosure standards. II.24 An FSB progress report on climate-related disclosures indicates that out of the 24 FSB member jurisdictions surveyed, 19 have already enacted regulations, issued guidelines or developed strategic roadmaps for climate-related disclosures. 17 FSB jurisdictions have set or proposed voluntary or mandatory disclosure requirements based on the ISSB Standards and the recommendations of the Task Force on Climate-related Disclosures (TCFD). Moreover, several jurisdictions have taken concrete steps towards assurance requirements19. II.25 Previously, the FSB released a report on ‘Stocktake on Nature-related Risks’ in July 2024, which reviewed current and planned regulatory and supervisory initiatives and outlined the key challenges that authorities face in identifying, assessing, and managing nature-related financial risks20. The report revealed that financial authorities in FSB member jurisdictions are at varying stages of evaluating the relevance of biodiversity loss and other nature-related risks, with differences in mandates. Some jurisdictions have identified them as material financial risks, while others are still monitoring international developments, and a few have opted not to address the issue yet. However, there is a recognition that more expertise is required in the supervisory community, in central banks, and in the private sector to effectively understand and address nature-related financial risks. II.26 In addition, the Network for Greening the Financial System (NGFS) put out a report on ‘Adapting Central Bank Operations to a Hotter World’ in July 2024 discussing insights from eight case studies from Europe and Asia. These case studies have highlighted how certain central banks have integrated climate-related factors into their monetary policies through initiatives such as adjusted credit operations, adjusted asset purchase schemes, and adjusted collateral policies21. While the central banks that have taken action have followed a cautious and gradual approach so far, it is expected that they will learn more about the associated trade-offs over time before taking more robust action. II.27 The NGFS published the second edition of its ‘Guide on Climate-related Disclosure for Central Banks’ in June 2024, offering both baseline and building block recommendations22. The NGFS also published a ‘Conceptual Framework to Guide Action by Central Banks and Supervisors on Nature-related Financial Risks’ in July 202423. This principle-based risk assessment framework is aimed at assisting central banks and supervisors in identifying and analysing material nature-related financial risks and developing relevant policies according to their jurisdictional context and mandates. 3.10 Crypto-Assets II.28 The markets for crypto-assets and stablecoins have grown to all-time highs in recent months, with potential implications for macroeconomic and financial stability. International organisations, including the International Monetary Fund (IMF), the FSB, the World Bank, the Financial Action Task Force (FATF), and other SSBs have been working closely towards the implementation of the ‘G20 Crypto-asset Policy Implementation Roadmap’. II.29 The 2022 crypto market turmoil and subsequent collapse and de-pegging of certain stablecoins underscored the vulnerabilities arising from their inadequate regulation and design. While these risks and challenges are global, some EMDEs may be exposed to additional risks and challenges due to capacity and resource constraints, and prevalence of extensive cross-border operations of foreign currency pegged stablecoins. In its July 2024 report, the FSB explored potential factors driving the higher level of activity related to foreign currency-pegged stablecoins in EMDEs and provided suggestions to address the associated financial stability risks and regulatory challenges24. II.30 Multi-function crypto-asset intermediaries (MCIs) are firms that combine a broad range of crypto asset services, products, and functions, typically centred around the operation of a trading platform. MCIs face additional vulnerabilities as compared to traditional financial firms, as certain combinations of functions could exacerbate their vulnerabilities. The FSB published a report on financial stability implications of MCIs in November 2023, which analysed their structure and functioning, the relevant financial stability risks, the key information gaps, and the implications for policy consideration25. 3.11 Artificial Intelligence (AI) and Tokenisation II.31 In November 2024, an FSB report on ‘Financial Stability Implications of Artificial Intelligence’ identified AI-related vulnerabilities that stand out for their potential to increase systemic risk, which include: (i) third-party dependencies and service provider concentration; (ii) market correlations; (iii) cyber risks; and (iv) model risk, data quality and governance26. The report stated that generative AI (GenAI) also increases the potential for fraud and disinformation in financial markets, and misaligned AI systems that are not calibrated to operate within legal, regulatory, and ethical boundaries can engage in behaviour that harms financial stability. II.32 In October 2024, an FSB report analysed the financial stability implications of distributed ledger technology (DLT)-based financial asset tokenisation. The report identified several financial stability vulnerabilities, which relate to liquidity and maturity mismatch, leverage, asset price and quality, interconnectedness, and operational fragilities27. II.33 The European Parliament in March 2024 adopted the world’s first legal framework- the European Union (EU) AI Act, which aims to ensure that AI systems used in the EU are safe, transparent, traceable, non-discriminatory and environment friendly, and that the AI systems are overseen by people, rather than by automation, to prevent harmful outcomes28. 4. Performance of the Global Banking Sector II.34 Credit growth to the private non-financial sector, which decelerated sharply in the post-pandemic period, rebounded during Q4:2022 to Q3:2023 on strengthened economic activity and accommodative monetary and liquidity conditions. The moderation which subsequently set in, amidst high lending rates and tight credit standards, has shown signs of reversal on recent rate cuts29 (Chart II.4a). In contrast, recent trends in Japan suggest some slowdown in credit growth (Chart II.4b). Among EMEs, credit growth in Türkiye, initially fuelled by household credit card use and economic recovery, has slowed down since Q3:202330 (Chart II.4c). II.35 Credit deepening can start a virtuous cycle of GDP growth, but beyond a threshold it may be detrimental to economic activity (Box II.1). 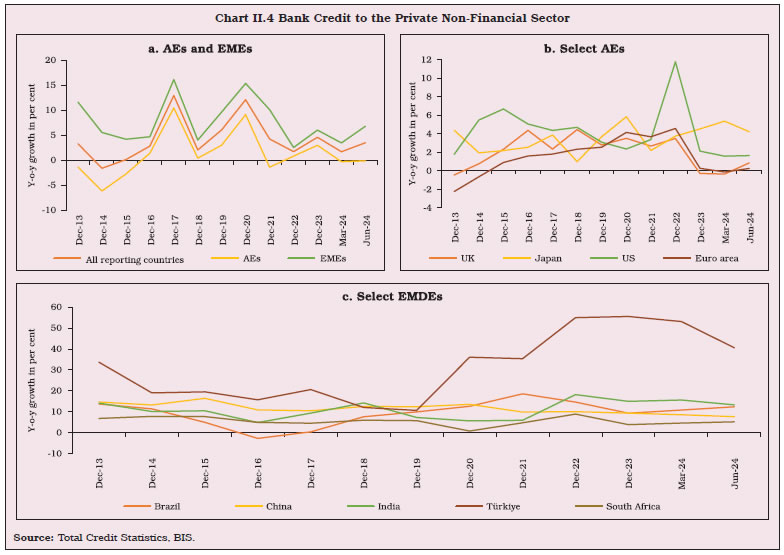
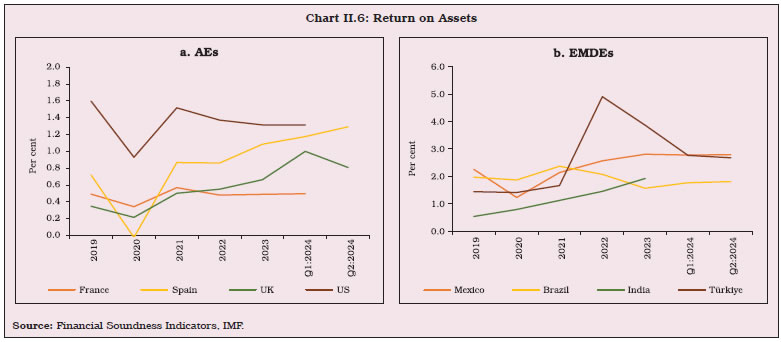
4.1 Asset Quality II.36 The non-performing loans (NPL) ratio serves as a key indicator of credit risk of a bank’s loan portfolio. The asset quality of banks has improved in recent years across most AEs and EMDEs (Table II.1). In the Euro area, Greece has made notable progress since 2018 in reducing its historically high NPL ratio, although it remains considerably higher than in other Euro area countries. 4.2 Provision Coverage Ratio II.37 A higher provision coverage ratio (PCR) indicates that the banking system has significant provisions to cover bad loans and better preparedness to handle defaults. Notwithstanding some moderation in Q1:2024, US banks continued to have the highest PCR across AEs (Chart II.5a). In the Euro area, Ireland, which had a history of high NPLs before 2018, has been building provisioning buffers. Among EMDEs, banks in Brazil maintained a high PCR amidst an improvement in asset quality (Chart II.5b). 4.3 Bank Profitability II.38 The profitability [return on assets (RoA)] of banks across most jurisdictions showed mixed movements in response to higher interest rates. In some countries, such as the US and Türkiye, banks’ profitability moderated as high policy rates increased their borrowing costs while also impacting credit demand (Chart II.6a and b). In some other jurisdictions, however, banks’ profitability increased due to a variety of reasons. For example, the RoA of UK banks improved in 2023 on higher net interest income (NII), reduced provisions and moderate cost escalations32. In the Euro area, Greece’s rating upgrade helped reduce the borrowing costs for its banks, boosting their profitability33. Ireland experienced a notable increase in profitability in 2023, driven by improved margins on loans pegged to policy rates34. 4.4 Capital Adequacy II.39 In the first half of 2024, banks further strengthened their financial positions, maintaining capital ratios well above regulatory norms. Among AEs, the Scandinavian countries like Norway and Denmark continued to maintain higher capital buffers than their peers. The capital to risk-weighted assets ratio (CRAR) of US banks improved in 2023 and Q1:2024. The ratio of UK banks remained elevated, notwithstanding the recent moderation. Euro area countries displayed varying trends, with Spain exhibiting improving capital buffers in Q2:2024. The CRAR of banks in the Netherlands and Belgium declined but remained comfortably above regulatory requirements. In EMDEs, Argentina’s CRAR increased dramatically in the post-pandemic period, reflecting substantial capital accumulation in response to economic challenges35 (Table II.2). 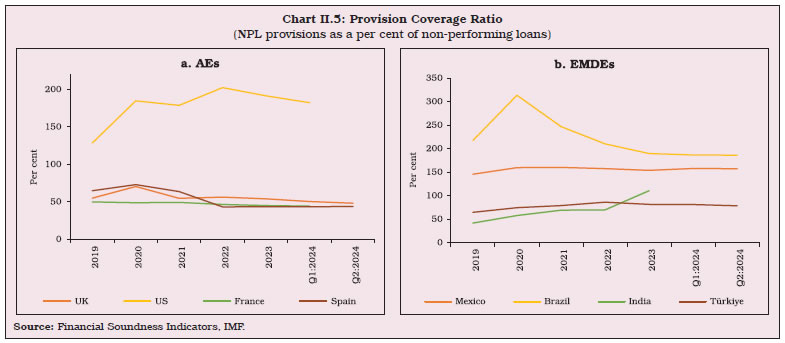
4.5 Leverage Ratio II.40 Leverage ratio measures the proportion of a bank’s Tier 1 capital to its total assets, serving as a safeguard against excessive risk exposure. In H1:2024, banks in most countries maintained leverage ratios well above the minimum Basel III requirement of 3 per cent. Among AEs, the US maintained the highest leverage ratio, hovering above 8.5 per cent (Chart II.7a). Canadian banks have a leverage ratio consistently below 5 per cent. Typically, the regulatory requirements for capital are higher in EMDEs, prompting them to maintain higher leverage ratios than those in AEs (Chart II.7b). Argentinian banks invested heavily in low-risk assets, such as government securities (G-secs), which boosted their core capital and, in turn, their leverage ratio36. 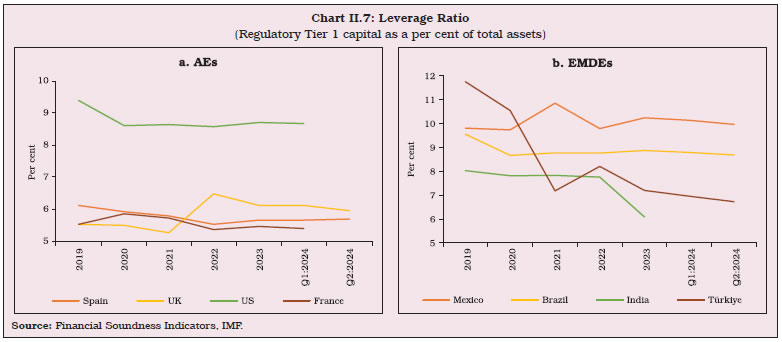
4.6 Financial Market Indicators II.41 Global banking stocks suffered losses in H1:2023, following the banking crisis in March 2023. However, swift policy intervention limited systemic spillovers and helped calm the markets. US and EU banking stocks experienced steady gains, particularly from Q4:2023 onward, reflecting improved market conditions and economic stability (Chart II.8a). II.42 Banks’ credit default swap (CDS) spreads provide insights into the perceived credit risk of financial institutions, reflecting market sentiment about the likelihood of default. The CDS market has evolved significantly post-GFC, marked by widespread adoption of standardised coupons, increased reliance on CCPs, introduction of upfront premiums, and growing popularity of CDS indices37. Following the peak in 2022, driven largely by geopolitical tensions and economic uncertainties, CDS spreads have generally narrowed, reflecting improved market sentiment. However, Russia’s CDS spreads remain an outlier since 2022, while China’s spreads have stayed elevated relative to other regions, influenced by economic challenges and concerns about financial sector stability (Chart II.8b). These variations indicate that while global markets have regained some confidence, region-specific risks still linger. 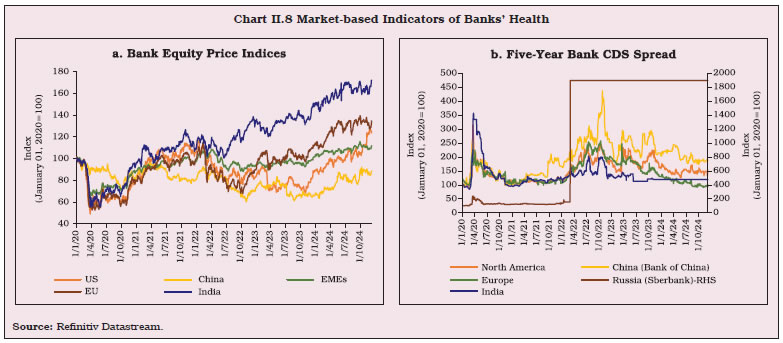
II.43 The number of AEs’ banks in the top 100 global banks by Tier 1 capital has been decreasing since the GFC, while the number of Chinese banks has increased and stabilised at 21 in 2023 (Chart II.9a). Commensurately, the share of Chinese banks in the total assets of top 100 global banks has increased, while the share of AEs has decreased (Chart II.9b). On the other hand, the AEs’ banks shifted their focus to their local markets and reduced their presence in international markets to control risk exposures38. 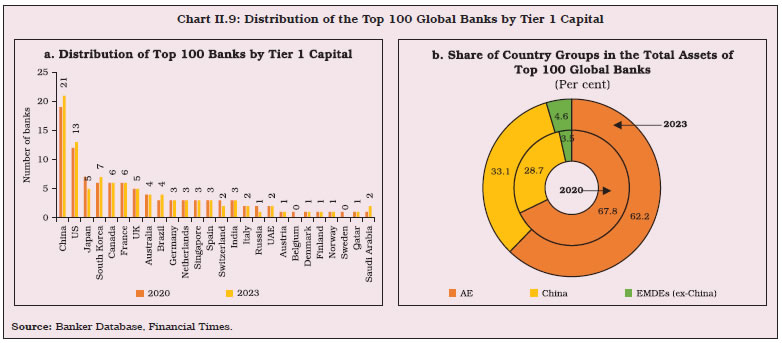
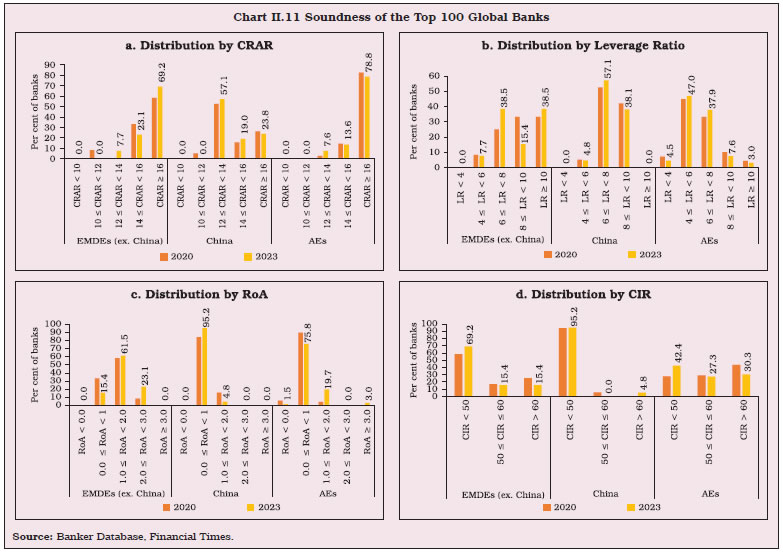
II.44 The asset quality of large global banks is improving. The proportion of banks with NPL ratios greater than or equal to 2 per cent decreased in 2023 as compared to 2022, particularly in AEs and EMDEs (excluding China). Meanwhile, all Chinese banks appearing in the top 100 global banks list consistently maintained their NPL ratios below 2 per cent (Chart II.10a). Additionally, the PCR of Chinese banks in the top 100 banks remained above 100 per cent, indicating greater financial resilience. The share of banks that had PCRs above 100 per cent marginally moderated to 75 per cent in EMDEs and 45.3 per cent for AEs in 2023 from 76.9 per cent and 46.9 per cent, respectively, in 2022 (Chart II.10b). II.45 CRARs greater than or equal to 16 per cent was the modal class of capital adequacy for AE and EMDE banks; for the Chinese banks, it was lower – between 12 to 14 per cent (Chart II.11a). A leverage ratio (LR) in the range of 6 to 8 per cent is generally considered prudent and this category remained the modal class for the Chinese banks. EMDE banks had bi-modal leverage ratio distribution, while that of AE banks was in the range of 4 to 6 per cent (Chart II.11b). Soaring interest income, on the back of monetary policy tightening, helped strengthen the profitability of global banks in both AEs and EMDEs in 2023. In comparison, fewer Chinese banks reported RoAs in the range of one to two per cent (Chart II.11c). Operational efficiency is one of the major pillars of banks’ soundness, with the cost-to-income ratio (CIR) serving as a representative indicator. Over 95 per cent of Chinese banks have a CIR below 50 per cent, suggesting higher operational efficiency than banks in other EMDEs and AEs (Chart II.11d). 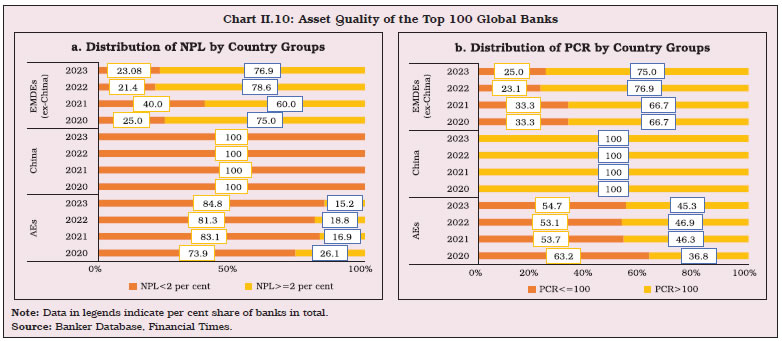
6. Overall Assessment II.46 As the global economy heads towards a soft landing with inflation approaching targets, monetary authorities in several economies have started easing cycles, while some remain in a tightening mode and others are on hold. The financials of the global banking sector remain healthy despite some moderation in credit growth and profitability. Prudent and proactive financial regulation and supervision remain essential to support monetary policy efforts to maintain financial stability while supporting growth. 1 Following global practice, throughout this chapter, year pertains to the calendar year viz. January to December. 2 International Monetary Fund (IMF) (2024). World Economic Outlook (WEO), October. 3 https://www.bis.org/publ/arpdf/ar2024e.pdf 4 BIS (2024)- RCAP on timeliness: Basel III implementation dashboard 5 A jurisdiction is considered as having adopted a standard if a final rule is published and as having implemented a standard if a final rule has been published and is implemented by banks. 6 FSB (2024)- Annual Report: Promoting Global Financial Stability 7 FSB (2024)- The importance of resolution planning and loss-absorbing capacity for banks systemic in failure: Public statement 8 BCBS (2024)- Global systemically important banks - revised assessment framework 9 2024 FSB Annual Report- Promoting Global Financial Stability 10 https://www.fsb.org/2024/07/evaluation-of-the-effects-of-the-g20-financial-regulatory-reforms-on-securitisation-consultationreport/ 11 https://www.fsb.org/wp-content/uploads/P220724-2.pdf 12 FSB (2024)- Depositor Behaviour and Interest Rate and Liquidity Risks in the Financial System: Lessons from the March 2023 banking turmoil 13 BCBS (2024)- The 2023 banking turmoil and liquidity risk: a progress report 14 https://www.fsb.org/2024/04/financial-resources-and-tools-for-central-counterparty-resolution/ 15 https://www.fsb.org/2024/10/annual-progress-report-on-meeting-the-targets-for-cross-border-payments-2024-report-on-keyperformance-indicators/ 16 https://www.fsb.org/2024/07/recommendations-to-promote-alignment-and-interoperability-across-data-frameworks-related-tocross-border-payments-consultation-report/ 17 https://www.fsb.org/2024/07/recommendations-for-regulating-and-supervising-bank-and-non-bank-payment-service-providersoffering-cross-border-payment-services-consultation-report/ 18 https://www.bis.org/cpmi/publ/d222.htm 19 FSB (2024)- Achieving Consistent and Comparable Climate-related Disclosures- Progress Report 20 https://www.fsb.org/2024/07/stocktake-on-nature-related-risks-supervisory-and-regulatory-approaches-and-perspectives-onfinancial-risk/ 21 https://www.ngfs.net/en/adapting-central-bank-operations-hotter-world-current-progress-and-insights-practical-examples 22 https://www.ngfs.net/en/guide-climate-related-disclosure-central-banks-second-edition 23 https://www.ngfs.net/en/ngfs-conceptual-framework-nature-risks 24 https://www.fsb.org/wp-content/uploads/P230724.pdf 25 https://www.fsb.org/2023/11/the-financial-stability-implications-of-multifunction-crypto-asset-intermediaries/ 26 FSB (2024)- The Financial Stability Implications of Artificial Intelligence 27 https://www.fsb.org/2024/10/the-financial-stability-implications-of-tokenisation/ 28 https://www.europarl.europa.eu/topics/en/article/20230601STO93804/eu-ai-act-first-regulation-on-artificial-intelligence 29 Economic Bulletin (2024) European Central Bank, Issue 5. 30 https://www.tcmb.gov.tr/wps/wcm/connect/d5b26167-65ec-45fc-b148-8ce753e53a80/III.+Non-Financial+Sector.pdf?MOD=AJPERES&CACHEID=ROOTWORKSPACE-d5b26167-65ec-45fc-b148-8ce753e53a80-p3LgjUI 31 Data on credit-to-GDP ratio are sourced from the BIS, while that on inflation and investment-to-GDP ratio are from the IMF’s WEO, and total factor productivity growth (TFPG) are from the Conference Board. 32 https://www.fitchratings.com/research/banks/major-uk-banks-profitability-to-remain-strong-despite-lower-net-interestincome-27-02-2024 33 Financial Stability Review (2024). Central Bank of Greece, April. 34 Financial Stability Review (2024). Central Bank of Ireland, June. 35 https://www.elibrary.imf.org/view/journals/002/2024/167/article-A001-en.xml 36 https://www.fitchratings.com/research/sovereigns/argentine-banks-capitalization-mitigates-central-governmentexposure-28-02-2023 37 https://www.federalreserve.gov/econres/feds/files/2022023pap.pdf 38 https://www.mckinsey.com/industries/financial-services/our-insights/a-decade-after-the-global-financial-crisis-what-has-andhasnt-changed |


Share this page:


Install the RBI mobile application and get quick access to the latest news!


