 IST,
IST,
I. Growth, Saving and Investment
Growth Rates
According to the advance estimates of the Central Statistical Organisation, real GDP growth decelerated to 6.0 per cent in 2000-01 from 6.4 per cent in 1999-2000 and 6.6 per cent in 1998-99. The growth rate of GDP originating from 'agriculture and allied activities' rose marginally to 0.9 per cent in 2000-01 from 0.7 per cent in 1999-2000. The prospects of shortfalls from kharif targets being bridged by the rabi output remain uncertain. The growth in GDP from 'industry' remained at 6.1 per cent, the same as in the preceding year. ‘Manufacturing' decelerated to 6.4 per cent in 2000-01 from 6.8 per cent in 1999-2000; on the other hand, there was improvement in 'mining and quarrying', supported by 'electricity, gas and water supply'. Service sector GDP growth slackened from 9.4 per cent in 1999-2000 to 8.4 per cent in 2000-01. Given the preponderant share of services in GDP, the deceleration in service sector GDP held down the overall GDP growth. The slowdown in the growth of the services sector was evident in major categories, i.e., 'financing, insurance, real estate and business services' and ‘community, social and personal services'. ‘Construction’ recorded an acceleration in growth (Table 1).
Table 1: Growth Rates and Sectoral Composition of GDP (at 1993-94 prices) |
(Per cent) | |||||||||||||||||||
Items | Growth Rate | Share in GDP | |||||||||||||||||
1998- | 1999- | 2000- | 1998- | 1999- | 2000- | ||||||||||||||
99@ | 00* | 01# | 99@ | 00* | 01# | ||||||||||||||
1 | 2 | 3 | 4 | 5 | 6 | 7 | |||||||||||||
1. | Agriculture and Allied Activities | 7.1 | 0.7 | 0.9 | 26.6 | 25.2 | 24.0 | ||||||||||||
1.1 | Agriculture | 7.9 | 0.3 | - | 24.6 | 23.2 | - | ||||||||||||
2. | Industry | 2.8 | 6.1 | 6.1 | 21.9 | 21.8 | 21.9 | ||||||||||||
2.1 | Manufacturing | 2.5 | 6.8 | 6.4 | 17.0 | 17.1 | 17.1 | ||||||||||||
2.2 | Mining and Quarrying | 1.3 | 1.7 | 4.5 | 2.4 | 2.3 | 2.3 | ||||||||||||
2.3 | Electricity, Gas and Water Supply | 6.4 | 5.2 | 5.6 | 2.5 | 2.5 | 2.4 | ||||||||||||
3. | Services | 8.0 | 9.4 | 8.4 | 51.5 | 53.0 | 54.2 | ||||||||||||
3.1 | Trade, Hotels, Restaurants, | 7.1 | 8.0 | 8.0 | 21.6 | 21.9 | 22.4 | ||||||||||||
Transport and Communication | |||||||||||||||||||
3.2 | Financing, Insurance, Real Estate | 8.4 | 10.1 | 9.6 | 12.3 | 12.7 | 13.2 | ||||||||||||
and Business Services | |||||||||||||||||||
3.3 | Community, Social and Personal | 9.9 | 11.8 | 7.6 | 12.6 | 13.2 | 13.4 | ||||||||||||
Services | |||||||||||||||||||
3.4 | Construction | 6.1 | 8.1 | 8.7 | 5.0 | 5.1 | 5.2 | ||||||||||||
4. | GDP at Factor Cost | 6.6 | 6.4 | 6.0 | 100.0 | 100.0 | 100.0 | ||||||||||||
@ Provisional estimates. | * Quick estimates. | # Advance estimates. |
Source: Central Statistical Organisation. | ||
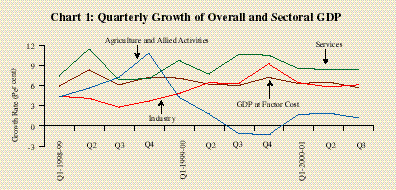
Quarterly data on real GDP growth indicate a slowdown in the first quarter of 2000-01 in relation to the fourth quarter of 1999-2000, closely mirroring the deceleration in industrial activity as well as in services. The absolute decline in real GDP from ‘agriculture and allied activities’ recorded in the later half of 1999-2000 was, however, reversed. In the second quarter of 2000-01, the deceleration in real GDP growth levelled off with the services sector growth compensating for the continuing slowdown in industry. The growth rate of real GDP in the third quarter of 2000-01 showed a decline mainly due to lower growth in the services sector (Chart 1).
The overall saving-investment gap remained at 1.0 per cent of GDP in 1999-2000, the same as in the preceding year. The rate of gross domestic saving (GDS) edged up to 22.3 per cent in 1999-2000 from 22.0 per cent a year ago, mainly on account of an improvement in the rate of household saving in physical assets. On the other hand, the rate of financial saving by households declined from 10.9 per cent in 1998-99 to 10.5 per cent in 1999-2000. The rate of saving of the private corporate sector remained unchanged at 3.7 per cent. The rate of dissaving of the public sector rose from 0.8 per cent in 1998-99 to 1.2 per cent in 1999-2000. The rate of gross domestic capital formation (GDCF) tracked the gross domestic saving rate, moving up to 23.3 per cent in 1999-2000 from 23.0 per cent in the preceding year. The rate of capital formation in the household sector and in the public sector improved to 9.2 per cent and 7.1 per cent, respectively, in 1999-2000 from 8.2 per cent and 6.4 per cent, respectively, a year ago.
The rate of final consumption expenditure improved from 76.7 per cent in 1996-97 to 77.5 per cent in 1999-2000, mainly due to a rise in the rate of government final consumption expenditure. On the other hand, the rate of private final consumption expenditure declined from 66.1 per cent in 1996-97 to 64.7 per cent in 1999-2000. Within a consolidation of the overall saving-investment balance during the 1990s, there have been adverse compositional shifts in the macro balances. While the public sector saving-investment deficit has widened in recent years, there has been a steady erosion of the private sector's saving-investment surplus (Table 2).
Table2: Gross Domestic Saving, Investment and Consumption Expenditure |
Item | Per cent of GDP | Amount in Rupees crore | |||||||||||||||||
(at current market prices) | |||||||||||||||||||
1996- | 1997- | 1998- | 1999- | 1996- | 1997- | 1998- | 1999- | ||||||||||||
97@ | 98@ | 99@ | 2000* | 97@ | 98@ | 99@ | 2000* | ||||||||||||
1 | 2 | 3 | 4 | 5 | 6 | 7 | 8 | 9 | |||||||||||
1. | Household Saving | 17.1 | 19.0 | 19.1 | 19.8 | 2,33,508 | 2,88,550 | 3,36,469 | 38,6913 | ||||||||||
1.1 Financial Assets | 10.4 | 10.4 | 10.9 | 10.5 | 1,41,627 | 1,57,526 | 1,92,511 | 20,5898 | |||||||||||
1.2 Physical Assets | 6.7 | 8.6 | 8.2 | 9.2 | 91,881 | 1,31,024 | 1,43,958 | 1,81,015 | |||||||||||
2. | Private corporate sector | 4.5 | 4.3 | 3.7 | 3.7 | 61,101 | 64,786 | 64,608 | 71,879 | ||||||||||
3. | Public sector | 1.7 | 1.4 | -0.8 | -1.2 | 22,958 | 21,079 | -14,345 | -23,220 | ||||||||||
4. | Gross Domestic Saving | ||||||||||||||||||
(GDS) | 23.3 | 24.7 | 22.0 | 22.3 | 3,17,567 | 3,74,415 | 3,86,732 | 435,572 | |||||||||||
5. | Net capital inflow | 1.3 | 1.5 | 1.0 | 1.0 | 17,738 | 22,302 | 18,087 | 19,656 | ||||||||||
6. | Gross Domestic Capital | ||||||||||||||||||
Formation (GDCF) | 24.6 | 26.2 | 23.0 | 23.3 | 3,35,305 | 3,96,717 | 4,04,819 | 4,55,228 | |||||||||||
7. | Total Consumption | ||||||||||||||||||
Expenditure | 76.7 | 75.8 | 76.9 | 77.5 | 10,45,182 | 11,49,206 | 13,52,977 | 15,16,948 | |||||||||||
7.1 Private Final | |||||||||||||||||||
Consumption | |||||||||||||||||||
Expenditure | 66.1 | 64.5 | 64.9 | 64.7 | 8,99,575 | 9,77,684 | 11,41,207 | 12,65,432 | |||||||||||
7.2 Government | |||||||||||||||||||
Final Consumption | |||||||||||||||||||
Expenditure | 10.7 | 11.3 | 12.0 | 12.9 | 1,45,607 | 1,71,522 | 2,11,770 | 2,51,516 | |||||||||||
Memo Items | |||||||||||||||||||
I. | Saving-Investment | ||||||||||||||||||
Gap (4-6) | -1.3 | -1.5 | -1.0 | -1.0 | -17,738 | -22,302 | -18,087 | -19,656 | |||||||||||
Public Sector | -5.3 | -3.4 | -7.2 | -8.2 | -72,452 | -51,605 | -1,26,414 | -1,61,406 | |||||||||||
Private Sector | 6.8 | 10.5 | 8.0 | 7.8 | 91,950 | 1,59,572 | 1,41,128 | 1,52,556 | |||||||||||
Private Corporate | |||||||||||||||||||
Sector | -3.6 | -2.1 | -2.9 | -2.7 | -49,677 | -31,642 | -51,383 | -53,342 | |||||||||||
Household Sector | 10.4 | 12.6 | 10.9 | 10.5 | 1,41,627 | 1,91,214 | 1,92,511 | 2,05,898 | |||||||||||
II. | ICOR | 3.6 | 5.9 | 4.2 | 3.6 | | | | | ||||||||||
@ Provisional Estimates. * Quick Estimates. |
Note : Incremental capital output ratio (ICOR) is calculated as a ratio of the investment rate and growth rate of real GDP. |
Source : Central Statistical Organisation. |
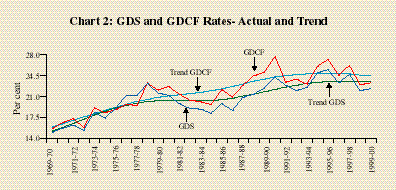
The growth experience since the second half of the 1990s is characterised by the co-existence of variability in output growth and in the rate of investment. The capacity of the economy to sustain a real output growth of over 6 per cent in the face of a fall in the investment rate from its peak of 27.2 per cent in 1995-96 has drawn attention to productivity changes as a source of growth in recent years. Studies conducted on developing countries in Asia estimate that contribution to growth on account of improvement in total factor productivity ranges between 10-30 per cent. The predominant contribution comes from capital accumulation -60 to 70 per cent – and the remaining 10 per cent can be attributed to human capital deepening. In India, mobilisation of resources for investment has occurred mainly in the form of domestic saving, with external resources accounting for barely 1 per cent of GDP or 8 per cent of domestic investment. The Indian experience over the past three decades suggests a close association between the trend components of domestic saving and investment (Chart 2).
Agricultural Situation
The GDP growth in ‘agriculture and allied activities’ slowed down to 1.7 per cent in the first quarter of 2000-01 but increased to 1.9 per cent during the second quarter, as compared with the corresponding quarters of 1999-2000. In the third quarter of 2000-01, the growth rate of 1.2 per cent was an improvement over the absolute decline of 1.1 per cent recorded in the third quarter of 1999-2000. The index of agricultural production (base: triennium ending 1981-82=100) fell by 3.5 per cent in 2000-01 on top of a fractional decline of 0.7 per cent in 1999-2000. During the South-west monsoon season 2000, the country received 92 per cent of the Long Period Average
(LPA) rainfall as compared with 96 per cent received in the previous year. Although this level of precipitation is considered to be statistically normal, the inter-temporal and inter-spatial distribution of rainfall exhibited marked aberrations, affecting the crop prospects in Gujarat, Madhya Pradesh, western Orissa and Rajasthan. The production of coarse cereals and oilseeds output may be adversely affected for the second year in succession.
The Union Ministry of Agriculture estimated the kharif 2000 foodgrain production at 102.3 million tonnes as compared with the previous year's production of 104.9 million tonnes. The fall in production was due to lower output of rice and coarse cereals. Production of kharif pulses is expected to be higher at 5.5 million tonnes compared with the previous year's level of 4.9 million tonnes; however, it still falls short of the target on account of drought in the major pulse-growing States of Gujarat, Madhya Pradesh and Rajasthan. As these States are also the major producers of oilseeds, the production of oilseeds also is likely to be affected. The production of sugarcane and cotton is expected to be higher than in the previous year although well below the target.
The prospects of the rabi crop compensating for the kharif shortfall are not very encouraging in view of drought-like conditions in parts of the country and critically low water availability in major reservoirs in Gujarat, Rajasthan, Madhya Pradesh, Chattisgarh, Himachal Pradesh and Orissa. All meteorological sub-divisions in these States had reported deficient and inadequate rainfall during the South-west monsoon. Cumulative rainfall during the North-east monsoon (October-December) was excess/normal in 4 out of 35 sub-divisions as compared with 28 sub-divisions in 1999 and 34 sub-divisions in 1998. The cumulative area weighted post-monsoon rainfall was deficient, being 50 per cent less than the LPA, and the cumulative rainfall is the lowest in the last five years. Preliminary estimates indicate that rabi foodgrains may reach 93.8 million tonnes only as compared with the record rabi output of 104.0 million tonnes in 1999-2000.
The production of wheat has been estimated much lower at 68.5 million tonnes as compared with the target of 74.0 million tonnes for 2000-01. Total rice output is estimated to be 85.5 million tonnes in 2000-01 as compared with the target of 90.0 million tonnes. Coarse cereals and pulses at 30.4 million tonnes and 11.7 million tonnes, respectively, in 2000-01 are expected to record substantial shortfalls from the production targets for 2000-01. Accordingly, total production of foodgrains is expected to be around 196.1 million tonnes in 2000-01, nearly 12.8 million tonnes below the peak of 208.9 million tonnes recorded in 1999-2000 (Table 3).
(Million tonnes/bales) | |||||||||||||||||||
1996-97 | 1997-98 | 1998-99 | 1999-00 | 2000-01 | |||||||||||||||
Crops | T | A | T | A | T | A | T | A | T | E | |||||||||
1 | 2 | 3 | 4 | 5 | 6 | 7 | 8 | 9 | 10 | 11 | |||||||||
Rice | 81.00 | 81.73 | 83.00 | 82.54 | 84.20 | 86.02 | 86.00 | 89.48 | 90.00 | 85.50 | |||||||||
Wheat | 65.00 | 69.35 | 68.50 | 66.35 | 70.00 | 71.29 | 74.00 | 75.57 | 74.00 | 68.50 | |||||||||
Coarse cereals | 32.50 | 34.11 | 33.50 | 34.40 | 34.30 | 31.35 | 34.50 | 30.47 | 33.00 | 30.36 | |||||||||
Pulses | 15.00 | 14.25 | 15.00 | 12.87 | 15.50 | 14.88 | 15.50 | 13.36 | 15.00 | 11.70 | |||||||||
Total Foodgrains | 193.50 | 199.44 | 200.00 | 192.26 | 204.00 | 203.55 | 210.00 | 208.88 | 212.00 | 196.14 | |||||||||
Nine Oilseeds | 23.00 | 24.38 | 25.50 | 21.30 | 27.00 | 24.73 | 28.00 | 20.87 | 28.00 | 18.70 | |||||||||
Sugarcane | 270.00 | 277.56 | 280.00 | 279.54 | 300.00 | 288.74 | 305.00 | 299.23 | 325.00 | 301.40 | |||||||||
Cotton* | 13.00 | 14.23 | 14.80 | 10.85 | 14.80 | 12.29 | 15.00 | 11.64 | 14.50 | 11.50 | |||||||||
Jute & Mesta** | 9.00 | 11.13 | 9.80 | 11.02 | 9.80 | 9.81 | 11.00 | 10.53 | 10.00 | 10.30 | |||||||||
T: Target. A: Achievement. E: Estimated. |
* Million bales of170 Kg. each. ** Million bales of 180 Kg. each. |
Source: Ministry of Agriculture and Economic Survey, 2000-01. |
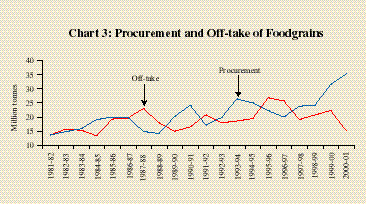
Procurement of foodgrains (rice and wheat) has been progressively increasing year after year. The procurement of rice and wheat during 2000-01 (upto March 30, 2001) rose by 16.4 per cent. The total off-take of foodgrains (up to February, 2001) declined by 23.4 per cent on account of a substantial fall in the off-take under the targeted Public Distribution System (TPDS) mainly as a consequence of the increase in Central Issue Prices (CIP) under the Public Distribution System (PDS) (Chart 3 and Table 4).
(Million tonnes) | |||||||||||||||||||
Fiscal year | Procurement | Off-take | Stocks * | ||||||||||||||||
Rice | Wheat | Total | Rice | Wheat | Total @ | Rice | Wheat | Total @ | |||||||||||
1 | 2 | 3 | 4 | 5 | 6 | 7 | 8 | 9 | 10 | ||||||||||
1995-96 | 9.91 | 12.33 | 22.24 | 14.00 | 12.82 | 26.82 | 13.06 | 7.76 | 20.82 | ||||||||||
1996-97 | 11.86 | 8.16 | 20.02 | 12.44 | 13.26 | 25.70 | 13.17 | 3.24 | 16.41 | ||||||||||
1997-98 | 14.52 | 9.30 | 23.82 | 11.36 | 7.76 | 19.12 | 13.05 | 5.08 | 18.12 | ||||||||||
1998-99 | 11.56 | 12.65 | 24.22 | 11.83 | 8.90 | 20.73 | 12.16 | 9.66 | 21.82 | ||||||||||
1999-2000 | 17.28 | 14.14 | 31.43 | 12.21 | 10.10 | 22.31 | 15.72 | 13.19 | 28.91 | ||||||||||
2000-2001# | 20.10 | 16.35 | 36.46 | 9.22 | 6.01 | 15.22 | 23.22 | 23.30 | 46.75 | ||||||||||
* Stocks are as at end-March. @ Includes coarse cereals. |
# Data on procurement are up to March 30, 2001 and up to February, 2001 for off-take and stocks. |
Source : Ministry of Food, Consumer Affairs and Public Distribution, Government of India. |
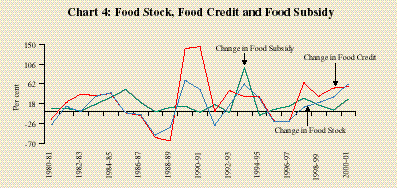
As a result of the fall in off-take and enhanced procurement, the stock of foodgrains stood at a substantially high level of 46.8 million tonnes at end-February 2001, as compared with 30.5 million tonnes in February, 2000. Stocks of both rice and wheat have registered considerable increases, with stock levels at over two and a half times the quarterly buffer stock norm specified for end-December (16.8 million tonnes). The current unprecedentedly high level of food stocks entail both higher food credit from commercial banks and higher food subsidy (Chart 4).
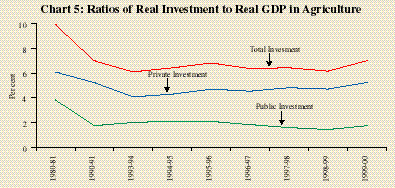
The rate of gross capital formation in agriculture in relation to GDP originating in agriculture has declined during the 1990s. The decline has been more pronounced in the share of the public sector's capital formation in agriculture which fell from 3.8 per cent in 1980-81 to 1.7 per cent in 1999-2000. Although private sector investment in agriculture also recorded a modest fall in comparison with the 1980s, there was a perceptible improvement during the second half of the 1990s (Chart 5).
Industrial Performance
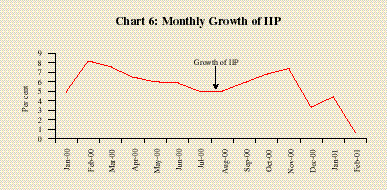
In terms of the index of industrial production (IIP), industrial output recorded a growth rate of 5.1 per cent in April-February 2000-01, lower than 6.5 per cent in the corresponding period of the previous year. Monthly growth rates of IIP show a steady deceleration up to August 2000 followed by a pick up in September 2000 which continued up to November 2000 (Chart 6). In December 2000, however, the IIP growth rate decelerated to 3.3 per cent and further to 0.6 per cent in February 2001. Manufacturing and electricity generation slowed down while mining sector growth improved (Table 5).
Table 5: Growth of Industrial Production and Relative Contribution of the Sectors (April-February) | |||||||||||||||||||
(Per cent) | |||||||||||||||||||
Sector | Weight | Growth | Relative Contribution | ||||||||||||||||
1999-2000 | 2000-01 | 1999-2000 | 2000-01 | ||||||||||||||||
1 | 2 | 3 | 4 | 5 | 6 | ||||||||||||||
General Index | 100.00 | 6.5 | 5.1 | 100.00 | 100.00 | ||||||||||||||
Manufacturing | 79.36 | 7.0 | 5.3 | 87.7 | 85.0 | ||||||||||||||
Mining | 10.47 | 0.8 | 4.2 | 1.1 | 7.1 | ||||||||||||||
Electricity | 10.17 | 7.4 | 4.1 | 11.1 | 7.9 | ||||||||||||||
At a disaggregated level, the modal range of growth among the seventeen manufacturing industry groups is 8-10 per cent, emanating largely from food production, machinery and equipment other than transport equipment, other manufacturing industries, leather and leather and fur products, which together accounted for 22.35 per cent weight in the IIP (Table 6).
Table 6: Frequency Distribution of Industry-Groups on the Basis of Growth Rates(April-February, 2000-01) |
Negative | 0-4 per cent | 4-6 per cent | 6-8 per cent | 8-10 per cent | Above 10 per cent | ||||||||||||||
1 | 2 | 3 | 4 | 5 | 6 | ||||||||||||||
1. | Jute and | 1. | Basic metal | 1. | Beverages, | 1. | Basic | 1. | Machinery and | 1. | Rubber, plastic, | ||||||||
other | and alloy | tobacco and | chemicals & | equipment other | petroleum | ||||||||||||||
vegetable | industries | related | chemical | than transport | and coal | ||||||||||||||
fibre textiles | (7.45) | products | products | equipment | products | ||||||||||||||
(0.59) | (2.38) | (except products of | (9.57) | (5.73) | |||||||||||||||
petro and coal) | |||||||||||||||||||
(14.00) | |||||||||||||||||||
2. | Transport | 2. | Textile | 2. | Wood and | 2. | Food Products | 2. | Metal | ||||||||||
equipment | products | wood products, | (9.08) | products | |||||||||||||||
and parts | including | furniture & | and parts | ||||||||||||||||
(3.98) | wearing | fixtures | (except | ||||||||||||||||
apparel | (2.70) | machinery | |||||||||||||||||
(2.54) | and | ||||||||||||||||||
equipment) | |||||||||||||||||||
(2.81) | |||||||||||||||||||
3. | Non-metallic | 3. | Cotton | 3. | Wool, silk | 3. | Other | ||||||||||||
mineral | textiles | and man- | manufacturing | ||||||||||||||||
products | (5.52) | made fibre | industries | ||||||||||||||||
(4.40) | textiles | (2.56) | |||||||||||||||||
(2.26) | |||||||||||||||||||
4. | Paper and | 4. | Leather and | ||||||||||||||||
paper products | leather & fur | ||||||||||||||||||
and printing, | Products | ||||||||||||||||||
publishing | (1.14) | ||||||||||||||||||
and allied | |||||||||||||||||||
industries | |||||||||||||||||||
(2.65) | |||||||||||||||||||
Note: Figures in brackets indicate weights in the IIP. |
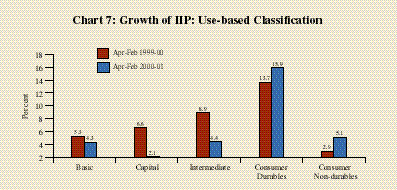
The use-based classification shows that the pattern of industrial growth has tilted towards the consumer goods sector (both durables and non-durables); on the other hand, growth of basic, capital and intermediate goods sectors decelerated, reflecting the general sluggishness in investment demand (Chart 7).
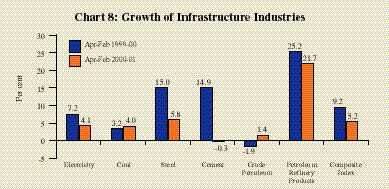
The infrastructure sector also registered a lower growth as compared with the previous year (Chart 8). The deceleration in the infrastructure sector is mainly due to low capacity utilisation, low productivity, stock piling of coal and undue delay in project implementation.
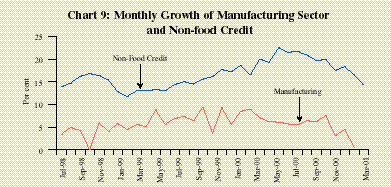
During the first three quarters of 2000-01, while there was sustained growth in non-food credit, the growth in manufacturing sector was relatively subdued. This trend reflected, inter alia, carrying cost of inventories in a number of industries such as fertilisers, sugar, petroleum and automobiles. In addition, credit flow to infrastructure had shown substantial increase which would not immediately reflect in the industrial production index due to gestation lags. Moreover, retail credit had increased significantly in line with higher production of consumer durables. The pace of credit growth since December 2000 moderated in line with decelerating manufacturing activity (Chart 9).
Sales of a sample of 1,060 non-government non-financial public limited companies rose by 15.3 per cent in the first half of 2000-01 as against a growth of 12.1 per cent (for 921 companies) in the corresponding period of the previous year. There was, however, a decline in the number of companies reporting post-tax profits. There was a deceleration in the growth of both gross profits and post-tax profits in comparison with the first half of 1999-2000. Corporate sales growth decelerated in the third quarter; however, post-tax profits showed improvement. As in the first half, number of companies reporting post-tax profits also declined in the third quarter of
2000-01.
Impact of Gujarat Earthquake
The earthquake which struck Gujarat on January 26, 2001 is widely regarded as unprecedented in its intensity measuring 7.7 on the Richter scale as per the US Geological Survey. It has caused extensive loss of life, property and economic activity. There has been massive damage to both private property and public property such as roads, railways, port and telecommunications networks. Initial estimates of the Earthquake Control Room of the State Government place the loss of property, both public and private, at Rs.21,262 crore. Infrastructure and utilities have suffered losses of Rs.1,080 crore while damages to industrial and corporate enterprises are estimated at Rs.8,000 crore. The joint assessment of the World Bank and the Asian Development Bank (ADB) under the Gujarat Earthquake Recovery Programme estimates a loss of Rs.9,900 crore (US $ 2.1 billion) in assets, which would entail reconstruction costs of Rs.10,600 crore (US $ 2.3 billion) and an output loss between Rs.2,300-3,000 crore (US $ 491-655 million) or 2 to 3 per cent of the State Domestic Product of Gujarat in aggregate over three years. It needs to be mentioned that these estimates are tentative and are likely to be revised significantly as more detailed assessment becomes available.
The contribution of Gujarat to the all-India foodgrains production is around 2.7 per cent. Oilseeds, cotton and tobacco are the major commercial crops, accounting for nearly 24 per cent, 32.3 per cent and 26.4 per cent, respectively, of the all-India production levels. According to the preliminary estimates prepared by the State Government, the damage to the agricultural sector on account of the earthquake has been estimated to be around Rs.730 crore. As per initial assessment reports, castor, cotton, groundnut, jowar and bajra crops were affected. The loss on account of the damages to storage houses and godowns have also been included in the estimates. The number of cattle deaths is placed at around 21,600. The earthquake has exacerbated deteriorating agricultural conditions which the State has been experiencing for the second consecutive year. Sixteen of the 25 districts in the State received deficient rains during the 2000 South-west monsoon with the entire Saurashtra region receiving no rain. The adverse agro-climatic conditions have resulted in a drop in rabi acreage under wheat, pulses and oilseeds. The total crop area during the rabi season up to February 5, 2001 was down by about 36 per cent.
Over 3,000 small-scale industries were affected, with the loss estimated at Rs.198 crore. Around 970 SSI units in ceramic, mosaic tile, roofing, refractory, powerloom, engineering and salt industries were severely affected. It is estimated that medium, and large-scale industrial units have suffered a loss of about Rs.2,000 crore. Around 24 medium and large-scale units have reported damages to their facilities amounting to Rs.122 crore. Large plants such as refineries, pharmaceutical and chemical units were, however, reported to be safe after the earthquake.
Gujarat is a major exporter of diamonds and gems and jewellery (about 70 per cent of total exports) and textiles. Moreover, the port of Kandla, which handles bulk container trade of almost 4 lakh tonnes, has been damaged. The loss for trade and industry is estimated at Rs.2,000 crore, as per the Earthquake Control Room reports.
Preliminary estimates of the damage indicate that there would be pressures on the fiscal position of the State over the medium term. In the joint World Bank - ADB assessment, the impact on the State’s fiscal deficit has been estimated at Rs.10,100 crore (US $ 2,170 million) in aggregate over three years. The Central Government introduced an additional 2 per cent surcharge on incomes of individuals and corporates to mitigate the financial strain on the State. The Union Budget 2001-02 has announced that the Government of Gujarat could raise funds additionally by the issue of tax-free earthquake relief bonds for individuals (including non-resident Indians) and others through the Reserve Bank.
Several measures have been taken by the Reserve Bank to address this situation. A package of special relief measures for Gujarat announced by the Reserve Bank included sanction of special limits up to Rs.1 lakh for restoration/ rehabilitation of businesses of small trades, self-employed and road transporters, etc.; grant of loans up to Rs.2 lakh for repairs/reconstruction of house/shops; stipulating additional limits/rescheduling existing limits for small scale industry (SSI), business and trade; relaxation in interest rates; allowing loans up to Rs.10 lakh at PLR and interest rates for loans exceeding Rs.10 lakh to be determined at the discretion of the financing bank; reckoning credit extended for repairs/ construction of houses/shops and to small trades, small business, self-employed and small road transporters etc. under the relief package as part of priority sector lending; delaying recovery of principal and interest for a period of two years in case of agricultural loans and rescheduling of the amounts not collected during two years for a period up to 7 years; and allowing consumption loan up to Rs.2,000 per eligible beneficiary.
Gujarat's limits for ways and means advances (WMA) have been completely relaxed and the terms of overdraft regulations for Gujarat have been eased for three months till end-April 2001. The normal WMA limit of Gujarat has been revised upwards to Rs.393 crore from the earlier limit of Rs.243 crore. With a view to assisting exporters affected by the earthquake in Gujarat, banks have been advised (i) to extend the period of packing credit at concessional rate even beyond 360 days in deserving cases where the goods are likely to be exported (the concessional rate ranges between 10-13 per cent); (ii) to convert the overdue packing credit into term loans after taking into account the availability of Export Credit Guarantee Corporation (ECGC) claim, repayable in suitable instalments; and (iii) not to classify the overdue loans as non-performing assets (NPA) in respect of i) and ii) above but to treat as NPA if interest and instalment of principal remains unpaid for 180 days, after it has become overdue, taking into account the revised due date fixed by the banks. Instructions are already in place for rescheduling/rephasing of existing loans and for extending fresh loans to agricultural borrowers affected by natural calamities. The rescheduled loans and the fresh facilities granted to such borrowers will be treated as current dues and need not be classified as NPA as per the income recognition, asset classification and provisioning norms. A special remittance of funds has been arranged for the Ahmedabad office of the Reserve Bank whose fresh note stock position is being constantly monitored. The Reserve Bank sanctioned soft loans of Rs.1,000 crore to the National Housing Bank (NHB) to provide financial assistance for construction of houses damaged in the earthquake. These loans were granted at 6 per cent rate of interest per annum and are repayable over 18 years, inclusive of a moratorium period of 3 years.
Page Last Updated on:


