 IST,
IST,
I. Growth, Saving and Investment
Growth Rates
Agricultural Situation
Industrial Performance
Saving and Investment
The Central Statistical Organisation (CSO) has estimated real GDP growth at 4.4 per cent in 2002-03, down from 5.6 per cent in 2001-02. According to these Advance Estimates, the impact of the adverse supply shock from drought conditions following the South-West monsoon turned out to be worse than initially anticipated. Real GDP originating from ‘agriculture and allied activities’ is estimated to have contracted by as much as 3.1 per cent in 2002-03, the loss of output being higher than that witnessed in the unprecedented drought of 1987. A modest, but broad-based recovery in industrial activity and the gathering of growth momentum in the services sector helped to mitigate the full effects of the drought. Despite some acceleration in relation to the preceding year, real GDP growth in both industrial and service sectors, if confirmed in the final CSO estimates, would be below trend, indicating the persistence of gaps in aggregate demand (Table 1).
Table 1 : Growth Rates of Real GDP | |||||||||||
(Per cent) | |||||||||||
Sector | Average | 2001- | 2002- | 2001-02 | 2002-03 | ||||||
from | 02* | 03# | |||||||||
1992-93 to | |||||||||||
2000-01 | Q1 | Q2 | Q3 | Q4 | Q1 | Q2 | Q3 | ||||
1 | 2 | 3 | 4 | 5 | 6 | 7 | 8 | 9 | 10 | 11 | |
1. | Agriculture & Allied Activities | 3.0 | 5.7 | -3.1 | 2.6 | 5.6 | 5.9 | 7.6 | 4.4 | 0.0 | -7.9 |
(27.9) | (23.9) | (22.2) | |||||||||
1.1 Agriculture | 3.1 | 5.7 | – | ||||||||
(25.5) | (21.9) | ||||||||||
2. | Industry | 6.6 | 3.2 | 5.8 | 2.4 | 3.0 | 3.5 | 3.4 | 4.1 | 6.1 | 6.0 |
(22.0) | (21.5) | (21.8) | |||||||||
2.1 Manufacturing | 7.2 | 3.4 | 6.1 | 2.9 | 3.1 | 3.4 | 3.1 | 3.8 | 6.4 | 6.3 | |
2.2 Mining and Quarrying | 4.1 | 1.0 | 4.8 | -2.5 | -0.2 | 3.6 | 3.5 | 5.3 | 5.1 | 4.6 | |
2.3 Electricity, Gas and | |||||||||||
Water Supply | 5.9 | 4.3 | 5.2 | 3.5 | 5.0 | 3.4 | 5.4 | 5.3 | 4.9 | 5.9 | |
3. | Services | 7.7 | 6.5 | 7.1 | 6.0 | 5.8 | 7.7 | 7.0 | 7.5 | 7.6 | 7.1 |
(50.1) | (54.6) | (56.0) | |||||||||
3.1 Trade, Hotels, | |||||||||||
Restaurants, Transport | |||||||||||
and Communication | 8.3 | 8.7 | 7.8 | 7.7 | 9.0 | 8.4 | 7.2 | 7.4 | 8.0 | 7.5 | |
3.2 Financing, Insurance, | |||||||||||
Real Estate and Business | |||||||||||
Services | 8.1 | 4.5 | 6.5 | 4.5 | 5.0 | 4.8 | 8.3 | 9.7 | 8.9 | 8.1 | |
3.3 Community, Social and | |||||||||||
Personal Services | 7.3 | 5.6 | 6.4 | 6.8 | 3.1 | 10.3 | 5.6 | 5.7 | 5.8 | 5.5 | |
3.4 Construction | 5.5 | 3.7 | 7.1 | 0.3 | 1.3 | 5.5 | 7.5 | 6.3 | 7.2 | 7.0 | |
4. | GDP at factor cost | 6.1 | 5.6 | 4.4 | 4.4 | 5.1 | 6.3 | 6.4 | 6.0 | 5.8 | 2.6 |
* Quick Estimates; # Advance Estimates; – Not available. | |||||||||||
Real activity picked up in the first quarter of 2002-03 (in relation to the corresponding period of the preceding year), with all sectors sharing in this improvement. Agriculture led the resumption of growth. Industrial performance rose on the back of a revival in ‘manufacturing’ and ‘mining and quarrying’. Growth of the services sector was more evenly spread, but fuelled mainly by the construction sector. The impact of the drought became evident in the second and third quarters of 2002-03. Real GDP growth in agriculture plunged to touch zero in the second quarter and turned negative at (-)7.9 per cent in the third quarter. Even though the pace of growth of real GDP originating from industry and services was more or less maintained, the setback to agricultural output reduced overall real GDP growth in the third quarter (Chart 1).
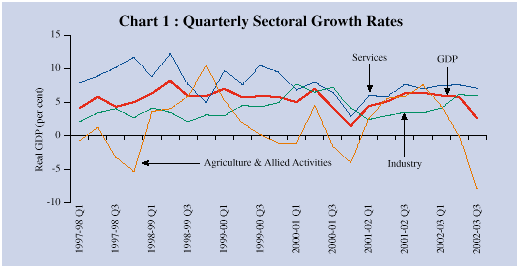
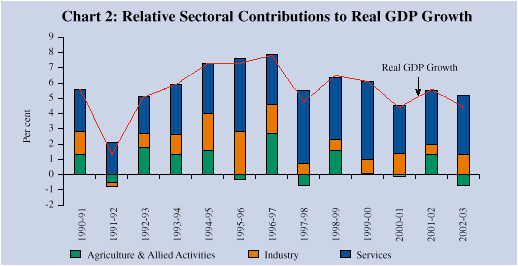
The growth experience over the last decade is underpinned by structural changes in the economy reflected in sectoral shifts. The share of agriculture in GDP underwent significant fluctuations as it fell from about 32 per cent in 1990-91 to 22 per cent in 2002-03. Corresponding gains in share were recorded by the services sector (46 per cent to 56 per cent). On the other hand, the share of industry in GDP has remained broadly unchanged at under 22 per cent. Relative contributions of sectors to real GDP growth have mirrored the structural shifts. Agriculture has made five years of negative contributions to growth since 1990. The robust growth of services has, however, insulated the overall growth process.
Services emerged as the dominant drivers in 2002-03, accounting for 88.3 per cent of real GDP growth, followed by industry (28.8 per cent). Agriculture and allied activities, on the other hand, recorded a negative contribution of 17.1 per cent (Chart 2).
According to the CSO’s advance estimates, real GDP originating from ‘agriculture and allied activities’ fell by 3.1 per cent for the year 2002-03 as a whole. The index of agricultural production is estimated to have undergone a sharp decline of 11.9 per cent during 2002-03 as against an increase of 5.9 per cent in 2001-02. A decennial deceleration, superimposed upon by high variability, has characterised the behaviour of agricultural activity, indicative of continued rain-dependency.
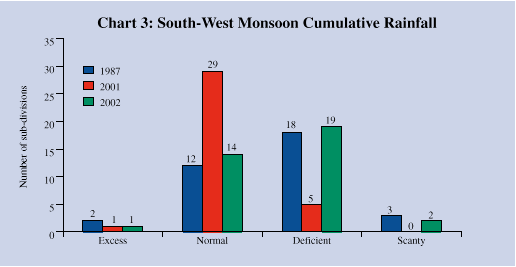
The year 2002-03 was declared as a drought year since the deficiency in the all-India cumulative South-West monsoon rainfall (19 per cent) was greater than 10 per cent of the long period average (LPA) range, as per the criterion of the India Meteorological Department. The scale and intensity of the drought in 2002 is comparable with that in 1987 when 21 sub-divisions received deficient/scanty rainfall and only 14 sub-divisions received excess/normal rainfall (Chart 3).
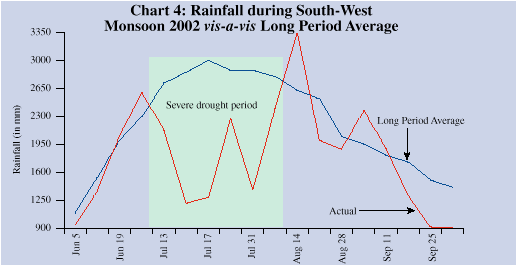
Moisture stress was severe in July 2002, the sowing month of kharif 2002 (Chart 4). The States worst hit by the drought conditions were Haryana, Rajasthan, Punjab, Uttar Pradesh, Orissa, Madhya Pradesh, Gujarat, Tamil Nadu and parts of Karnataka and Kerala. Of the 36 meteorological sub-divisions of the country, 21 sub-divisions received deficient/scanty rainfall and only 15 sub-divisions received normal/excess rainfall.
The kharif foodgrains production touched a low of 89.5 million tonnes during 2002-03, down by 22.1 million tonnes from the level attained in kharif 2001-02. This reflected an across-the-board decline. Rabi foodgrain production at 94.6 million tonnes is likely to be lower than in the previous year mainly due to the poor performance of wheat and rice. Rabi production of pulses and oilseeds is also expected to be lower (Table 2). Poor rains during the South-West monsoon and the North-East monsoon in 2002-03 resulted in the total live water storage in the 70 major reservoirs across the country falling to 42.6 billion cubic metres (BCM) as on January 27, 2003. This storage level is 33 per cent of the designed utilisable storage, 72.6 per cent of the preceding year’s level and only 58.4 per cent of the last ten years’ average.
Table 2 : Season-Wise Agricultural Production | ||||||||||
(Million Tonnes) | ||||||||||
Crops | 1998-99 | 1999-2000 | 2000-01 | 2001-02 | 2002-03 AE | |||||
Kharif | Rabi | Kharif | Rabi | Kharif | Rabi | Kharif | Rabi | Kharif | Rabi | |
1 | 2 | 3 | 4 | 5 | 6 | 7 | 8 | 9 | 10 | 11 |
Total Foodgrains | 102.9 | 100.7 | 105.5 | 104.3 | 104.7 | 94.6 | 111.6 | 100.5 | 89.5 | 94.6 |
Rice | 72.7 | 13.4 | 77.5 | 12.2 | 75.4 | 12.3 | 79.8 | 13.3 | 66.7 | 10.2 |
Wheat | - | 71.3 | - | 76.4 | - | 69.7 | - | 71.8 | - | 70.3 |
Coarse Cereals | 25.1 | 6.3 | 23.2 | 7.1 | 24.9 | 6.2 | 26.9 | 7.0 | 18.7 | 6.4 |
Pulses | 5.1 | 9.8 | 4.8 | 8.6 | 4.5 | 6.4 | 4.9 | 8.3 | 4.1 | 7.8 |
Nine Oilseeds | 15.8 | 9.0 | 12.5 | 8.2 | 11.9 | 6.5 | 12.9 | 7.6 | 8.4 | 7.2 |
Groundnut | 6.9 | 2.1 | 3.8 | 1.5 | 4.9 | 1.5 | 5.4 | 1.5 | 3.1 | 1.6 |
Soyabean | 7.1 | – | 7.1 | – | 5.3 | – | 5.9 | – | 4.3 | – |
Sugarcane $ | 288.7 | 299.3 | 296.0 | 300.1 | 279.3 | |||||
Cotton@$ | 12.3 | 11.5 | 9.5 | 10.1 | 8.6 | |||||
Jute and Mesta#$ | 9.8 | 10.6 | 10.6 | 11.6 | 11.0 | |||||
AE: Advance Estimates as on April 4, 2003. - Not available. | ||||||||||
The Ministry of Agriculture had set a target of 109.5 million tonnes for foodgrains production each for kharif as well as rabi 2002. The kharif targets for rice, coarse cereals and pulses were 78.5 million tonnes, 25.8 million tonnes and 6 million tonnes, respectively. The rabi targets comprised wheat at 78.0 million tonnes, rice at 14.4 million tonnes, coarse cereals at 7.2 million tonnes, and pulses at 10.0 million tonnes. The target for kharif and rabi oilseeds production had been set at 15.9 million tonnes and 11.1 million tonnes, respectively. The depressed performance in both kharif and rabi seasons of 2002-03 is expected to result in a significant shortfall in the output of all crops vis-a-vis their targets.
According to the third advance estimates of the Union Ministry of Agriculture, foodgrains production is estimated to have dropped sharply by 28.0 million tonnes to 184.1 million during 2002-03, the lowest since 1996-97. The worst affected were rice and coarse cereals. Non-foodgrains, especially oilseeds and sugarcane, also recorded considerable contraction in their production levels during 2002-03 (Table 3).
Table 3 : Crop-wise Targets/Achievements | ||||||||||
(Million Tonnes) | ||||||||||
Crops | 1998-99 | 1999-2000 | 2000-01 | 2001-02 | 2002-03 | |||||
T | A | T | A | T | A | T | A | T | A# | |
1 | 2 | 3 | 4 | 5 | 6 | 7 | 8 | 9 | 10 | 11 |
Rice | 84.2 | 86.1 | 86.0 | 89.7 | 90.0 | 87.7 | 92.0 | 93.1 | 93.0 | 77.0 |
Wheat | 70.0 | 71.3 | 74.0 | 76.4 | 74.0 | 69.7 | 78.0 | 71.8 | 78.0 | 70.3 |
Coarse Cereals | 34.3 | 31.3 | 34.5 | 30.3 | 33.0 | 31.1 | 33.0 | 33.9 | 33.0 | 25.1 |
Pulses | 15.5 | 14.9 | 15.5 | 13.4 | 15.0 | 10.9 | 15.0 | 13.2 | 16.0 | 11.8 |
Total Foodgrains | 204.0 | 203.6 | 210.0 | 209.8 | 212.0 | 199.3 | 218.0 | 212.0 | 220.0 | 184.1 |
Nine Oilseeds | 27.0 | 24.8 | 28.0 | 20.7 | 28.0 | 18.4 | 28.0 | 20.5 | 27.0 | 15.6 |
Sugarcane | 300.0 | 288.7 | 305.0 | 11.5 | 325.0 | 296.0 | 325.0 | 300.1 | 320.0 | 279.3 |
Cotton* | 14.8 | 12.3 | 15.0 | 10.6 | 14.5 | 9.5 | 14.5 | 10.1 | 15.0 | 8.6 |
Jute & Mesta** | 9.8 | 9.8 | 11.0 | 299.3 | 10.0 | 10.6 | 11.0 | 11.6 | 12.0 | 11.0 |
T: Target. | ||||||||||
Foodgrain procurement declined to 37.8 million tonnes during 2002-03 from 41.5 million tonnes a year ago. Off-take of foodgrains, on the other hand, improved significantly (Chart 5). The pick up in off-take was mainly on account of increased off-take under Other Welfare Schemes (OWS) followed by Open Market Sales (OMS), exports and Targeted Public Distribution System (TPDS).
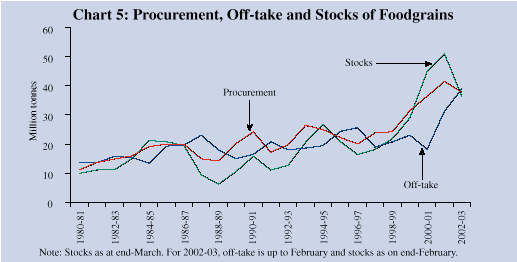
Foodgrains stock, which was at its peak at 64.8 million tonnes at end-May 2002, declined to 36.2 million tonnes as at end-February 2003 (Table 4). This was facilitated by special measures to liquidate the surplus stocks which included open market sales at prices much below economic cost, lowering of issue prices under Targeted Public Distribution System (TPDS) for Above Poverty Line (APL) families, increase in monthly allocation for APL, Below Poverty Line (BPL) and Antodaya families to 35 kg per month per family and utilisation of foodgrains for various welfare schemes. The reduced stock of foodgrains entailed a lower recourse to food credit which declined by more than Rs.11,000 crore between May 2002 and March 2003. For the rest of the year, the food stocks are expected to be in the range of 30-35 million tonnes.
Table 4 : Management of Food Stocks during 2002-03 | ||||||||
(in million tonnes) | ||||||||
Month | Opening | Foodgrains | Closing | Food | ||||
Stock of | Procure- | Foodgrains off-take | Stock | Credit$ | ||||
Foodgrains | ment | TPDS | OWS | OMS | Exports | |||
1 | 2 | 3 | 4 | 5 | 6 | 7 | 8 | 9 |
April 2002 | 51.0 | 13.3 | 1.2 | 0.4 | 0.2 | 1.0 | 62.6 | 52,484 |
(15.8) | ||||||||
May | 62.6 | 7.0 | 1.5 | 0.8 | 0.2 | 1.2 | 64.8 | 60,669 |
June | 64.8 | 1.8 | 1.6 | 1.3 | 0.2 | 0.9 | 63.1 | 61,008 |
July | 63.1 | 0.9 | 1.5 | 0.6 | 0.4 | 1.1 | 59.9 | 59,077 |
(24.3) | ||||||||
August | 59.9 | 0.2 | 1.8 | 0.5 | 1.1 | 1.5 | 55.4 | 56,400 |
September | 55.4 | 0.6 | 1.5 | 0.5 | 0.7 | 1.4 | 51.4 | 53,362 |
October | 51.4 | 7.1 | 1.8 | 1.2 | 0.7 | 0.9 | 53.6 | 52,705 |
(18.1) | ||||||||
November | 53.6 | 1.3 | 1.5 | 0.8 | 0.5 | 0.8 | 51.5 | 54,346 |
December | 51.5 | 1.3 | 1.7 | 1.2 | 0.4 | 0.9 | 48.2 | 51,947 |
January 2003 | 48.2 | 2.0 | 1.5 | 1.1 | 0.8 | 0.8 | 40.1 | 49,784 |
(16.8) | ||||||||
February | 40.1 | 1.4 | 1.8 | 1.1 | 0.3 | 0.7 | 36.2 | 50,227 |
March | 36.2 | 0.9 | – | – | – | – | – | 49,479 |
$ Outstanding in Rs. crore as on the last reporting Friday of the Month; | ||||||||
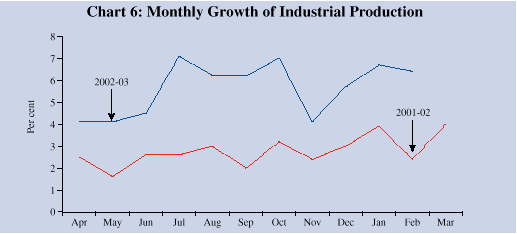
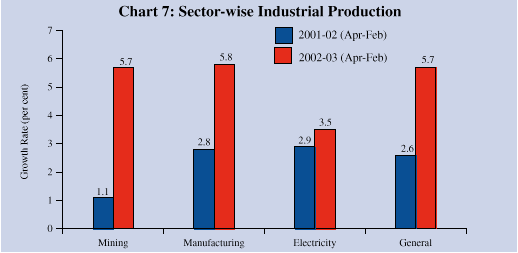
The growth of real GDP originating from industry firmed up from the second quarter of 2001-02 and reached 6.1 per cent in the second quarter of 2002-03, before declining marginally to 6.0 per cent in the third quarter of 2002-03. For the year 2002-03, real growth of industrial GDP is estimated at 5.8 per cent, up from 3.2 per cent in the preceding year. The Index of Industrial Production (IIP) also recorded a higher growth of 5.7 per cent in April-February 2002-03 as compared with 2.6 per cent a year ago. Industrial production showed an upward trend throughout 2002-03 and the year-on-year growth remained higher in all the months of 2002-03 than in the preceding year (Chart 6).
All constituent sub-sectors – manufacturing, mining and quarrying, electricity generation - shared in the acceleration of growth (Chart 7).
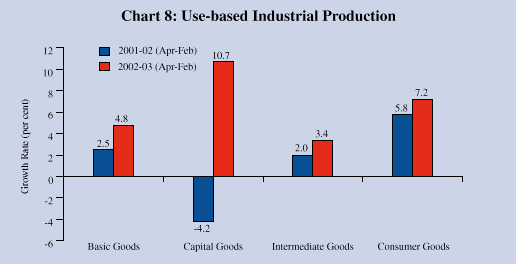
In terms of the use-based classification, growth in the basic and consumer goods sectors accelerated during April-February 2002-03. Within the consumer goods sector, the improvement was mainly on account of consumer non-durables as the production of consumer durables declined by 5.7 per cent. Activity in the capital goods sector resumed with a growth of 10.7 per cent after a decline of 4.2 per cent in the preceding year. In the intermediate goods sector, growth firmed up moderately (Chart 8).
The improvement in manufacturing output was spread over various industry groups. Within the 17 major groups, 8 groups recorded growth above the manufacturing sector’s average of 5.8 per cent. The major growth impulse emanated from five industry groups comprising ‘beverages, tobacco and related products’, ‘basic chemicals and chemical products’, ‘food products’, ‘transport equipment and parts’ and ‘basic metal and alloy industries’. These industry groups together contributed 74.3 per cent of the growth in manufacturing sector. Declines in output were mainly in industries such as ‘cotton textiles’, ‘leather and leather and fur products’ and ‘wood and wood products’. The industry group ‘machinery and equipment’, which has sizeable weight in the manufacturing output, continued to record subdued growth (Table 5).
Table 5 : Frequency Distribution of Industry Group Growth Rates | |||||||
Negative | 0-4 per cent | 4-8 per cent | Above 8 per cent | ||||
1 | 2 | 3 | 4 | ||||
1. | Other manufacturing | 1. | Machinery and | 1. | Jute and other vegetable | 1. | Beverages, tobacco and |
industries (0.9) | equipment other than | fibre textiles (except cotton) | related products (26.4) | ||||
transport equipment | (7.2) | ||||||
2. | Cotton Textiles (3.0) | (2.2) | 2. | Metal products and parts | 2. | Textile products | |
(except machinery and | (including wearing | ||||||
equipment) (6.8) | apparel) (15.5) | ||||||
3. | Leather and leather & fur | 3. | Wool, silk and man made | 3. | Transport equipment | ||
products (4.4) | fibre textiles (6.4) | and parts (14.5) | |||||
4. | Wood and wood products | 4. | Paper and paper products | 4. | Food products (9.3) | ||
furniture and fixtures | and printing, publishing & | ||||||
(18.5) | allied industries (5.3) | ||||||
5. | Rubber, plastic, petroleum | 5. | Basic metal and alloy | ||||
and coal products (4.9) | industries (8.4) | ||||||
6. | Non-metallic mineral | ||||||
products (4.7) | |||||||
7. | Basic chemicals and | ||||||
chemical products (except | |||||||
products of petrol and coal) | |||||||
(4.4) | |||||||
Note : Figures in brackets indicate growth rates. | |||||||
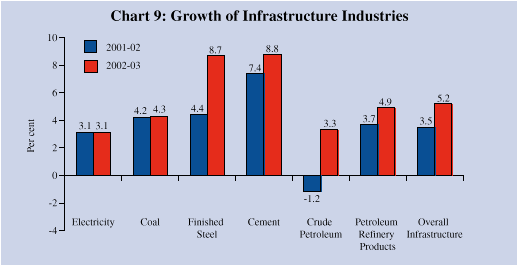
The performance of the infrastructure industries was encouraging. All the infrastructure industries except electricity recorded higher growth. Production of cement, finished steel, crude petroleum, petroleum refinery products and coal accelerated. The decline in the production of crude petroleum in 2001-02 was arrested and a modest increase of 3.3 per cent was recorded during 2002-03. The growth in electricity remained unchanged at 3.1 per cent during 2002-03 (Chart 9).
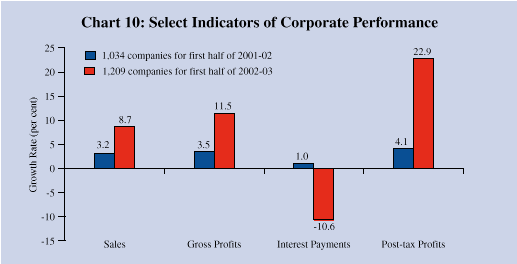
The industrial climate is turning favourable. The leading indicators of industrial production, i.e., non-food credit off-take, production and imports of capital goods, have all recorded an increase. In the capital goods sector, diesel engines, protection system/switch boards, process control instruments and computer systems are recording high growth. The improvement in industrial activity is being reinforced by robust export performance. The financial performance of the Indian corporate sector reflected a distinct improvement during 2002-03 (up to September 2002) as compared with the previous year. Growth of sales accelerated on account of better performance in sectors such as, ‘iron and steel’, ‘automobiles and ancillaries’, ‘electrical machinery’, ‘food processing’, ‘rubber and rubber products’, and ‘drugs and pharmaceuticals’. Furthermore, there was a substantial decline in interest payments attributable, inter alia, to softening of interest rates on corporate debt in the recent years. The post-tax profits of the corporate sector, thus, recorded a sharp improvement during the first half of 2002-03 (Chart 10).
The Business Confidence Index (BCI) survey conducted jointly by the Economic Times-National Council of Applied Economic Research (ET-NCAER) shows a 12.4 per cent improvement in the BCI in the third quarter of 2002-03 over the BCI level of the second quarter. The upswing in business confidence appears to be in all categories barring consumer non-durables. Industrial outlook surveys indicate improvement in the assessment of demand growth (order books and exports) and capacity utilisation. Similar optimism is reflected in other surveys of the business outlook as well as by the tracking of leading indicators.
The CSO’s Quick Estimates provide information on saving and investment behaviour up to 2001-02. The rate of gross domestic saving is placed at 24.0 per cent in 2001-02, a marginal improvement from 23.4 per cent recorded a year ago. This was mainly on account of the increase in the rate of household saving (22.5 per cent from 21.6 per cent) reflecting increased holdings of both financial and physical assets (Chart 11). Among the constituents of the household sector’s financial saving, currency holdings, bank deposits and claims on government rose in 2001-02, while non-bank deposits and holdings of contractual instruments declined. All other constituents experienced an erosion of saving. The rate of saving of the private corporate sector declined marginally (4.0 per cent in 2001-02 from 4.1 per cent in 2000-01), while the rate of public sector dis-saving continued to worsen (2.5 per cent in 2001-02 from 2.3 per cent in 2000-01) (Table 6).
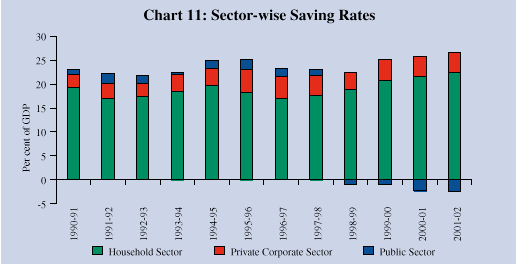
Table 6 : Gross Domestic Saving and Investment | |||||||||
Per cent of GDP | Amount in Rupees crore | ||||||||
(at current market prices) | |||||||||
Item | 1998- | 1999- | 2000- | 2001- | 1998- | 1999- | 2000- | 2001- | |
99 | 2000 | 01@ | 02* | 99 | 2000 | 01 @ | 02* | ||
1 | 2 | 3 | 4 | 5 | 6 | 7 | 8 | 9 | |
1. | Household Saving | 18.8 | 20.8 | 21.6 | 22.5 | 3,27,074 | 4,02,360 | 4,53,641 | 5,15,565 |
1.1) Financial Assets | 10.4 | 10.5 | 10.4 | 11.2 | 1,80,618 | 2,03,702 | 2,17,841 | 2,56,647 | |
1.2) Physical Assets | 8.4 | 10.3 | 11.2 | 11.3 | 1,46,456 | 1,98,658 | 2,35,800 | 2,58,918 | |
2. | Private Corporate Sector | 3.7 | 4.4 | 4.1 | 4.0 | 65,026 | 84,329 | 86,142 | 92,060 |
3. | Public Sector | -1.0 | -1.0 | -2.3 | -2.5 | -17,169 | -20,049 | -48,022 | -57,662 |
4. | Gross Domestic Saving (GDS) | 21.5 | 24.1 | 23.4 | 24.0 | 3,74,931 | 4,66,640 | 4,91,761 | 5,49,963 |
5. | Net Capital Inflow | 1.0 | 1.1 | 0.6 | -0.2 | 18,090 | 21,988 | 12,977 | -4,872 |
6. | Gross Domestic Capital | ||||||||
Formation (GDCF) | 22.6 | 25.2 | 24.0 | 23.7 | 3,93,021 | 4,88,628 | 5,04,738 | 5,45,091 | |
7. | Total Consumption Expenditure | 77.7 | 78.6 | 77.2 | 77.9 | 13,53,444 | 15,22,665 | 16,23,921 | 17,87,865 |
7.1) Private Final | |||||||||
Consumption Expenditure | 65.4 | 65.6 | 64.6 | 65.0 | 11,39,411 | 12,71,556 | 13,59,358 | 14,92,894 | |
7.2) Government Final | |||||||||
Consumption Expenditure | 12.3 | 13.0 | 12.6 | 12.8 | 2,14,033 | 2,51,109 | 2,64,563 | 2,94,971 | |
Memo Items | |||||||||
Saving-Investment gap (4-6)# | -1.0 | -1.1 | -0.6 | 0.2 | -18,090 | -21,988 | -12,977 | 4,872 | |
Public Sector $ | -7.6 | -8.0 | -8.7 | -8.8 | -1,31,714 | -1,54,533 | -1,82,047 | -2,02,744 | |
Private Sector $ | 7.7 | 8.4 | 9.5 | 10.3 | 1,34,436 | 1,62,911 | 2,00,187 | 2,37,619 | |
Private Corporate Sector | -2.7 | -2.1 | -0.8 | -0.8 | -46,182 | -40,791 | -17,654 | -19,028 | |
Household Sector | 10.4 | 10.5 | 10.4 | 11.2 | 1,80,618 | 2,03,702 | 2,17,841 | 2,56,647 | |
@ Provisional Estimates; | |||||||||
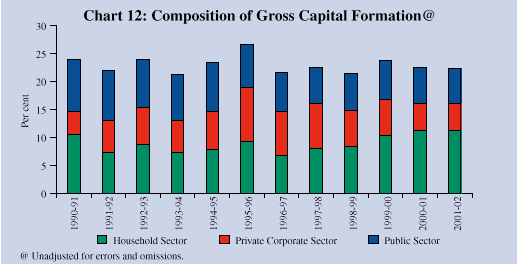
The investment rate has been declining after 1999-2000. In 2001-02, it fell further to 23.7 per cent from 24.0 per cent in 2000-01. The decline in the overall investment rate was primarily on account of the continuing slack in the private corporate sector as well as in the public sector during the period 2000-02 (Chart 12).
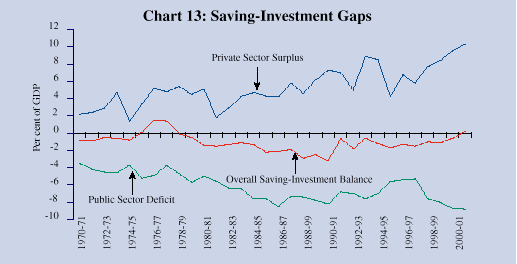
The overall saving-investment balance turned around into a surplus of 0.2 per cent of GDP in 2001-02 for the first time after the period 1975-78. While the public sector saving-investment gap widened to (-) 8.8 per cent of GDP in 2001-02 from (-) 8.7 per cent of GDP in the previous year, the private sector surplus increased to 10.3 per cent of GDP from 9.5 per cent (Chart 13).
Final consumption expenditure, which had declined to 77.2 per cent of GDP in 2000-01, increased to 77.9 per cent of GDP in 2001-02. This reflected an increase in both private and government final consumption expenditures after marginal declines in 2000-01.
Page Last Updated on:


