 IST,
IST,
I. Growth, Saving and Investment
Growth Rates
Agricultural Situation
Industrial Performance
Saving and Investment
The Central Statistical Organisation (CSO) has placed real GDP growth in 2003-04 at 8.1 per cent and revised its previous estimates for 2002-03 downwards to 4.0 per cent from 4.3 per cent. In 2002-03, the decline in real GDP originating in ‘agriculture and allied activities’ was more pronounced at (–)5.2 per cent than the earlier estimate of (–)3.2 per cent. The good monsoon in 2003, coupled with the base effect of this downward revision, produced a strong rebound in agricultural growth in 2003-04. Real GDP growth originating in ‘agriculture and allied activities’ is estimated at 9.1 per cent, the highest since 1988-89. Industrial performance improved steadily, led by manufacturing activity. The growth of real GDP originating in services is expected to have crossed the decennial average (7.5 per cent) in 2003-04 (Table 1). Activity in ‘trade, hotels, restaurants, transport and communication’ is estimated to have risen by close to 11 per cent in 2003-04, 2.5 percentage points above the decennial average.
With the robust macroeconomic performance of 2003-04, the Indian economy broke free of the adversities that had beset it in 2002-03. The overall real GDP growth in 2003-04 was the highest since 1991-92 and India turned out to be one of the fastest growing economies of the world. The buoyant, all-round revitalisation of growth places the economy within striking range of the Tenth Plan projection of 8 per cent to be achieved over the period 2002-07.
Table 1: Sectoral Growth Rates of Real GDP
| (Per cent) | ||||||||||||
| Sector | Average | 2002-03* | 2003-04# | 2002-03 | 2003-04 | |||||||
| 1992-93 to | | | ||||||||||
| 2001-02 | Q1 | Q2 | Q3 | Q4 | Q1 | Q2 | Q3 | |||||
| 1 | 2 | 3 | 4 | 5 | 6 | 7 | 8 | 9 | 10 | 11 | ||
| 1. | Agriculture & Allied Activities | 3.4 | -5.2 | 9.1 | 0.6 | -2.9 | -9.8 | -2.8 | 1.7 | 7.4 | 16.9 | |
| (27.5) | (22.0) | (22.2) | ||||||||||
| a. | Agriculture | 3.5 | -6.0 | n.a. | ||||||||
| 2. | Industry | 6.3 | 6.2 | 6.6 | 4.8 | 6.7 | 6.7 | 6.2 | 5.8 | 6.3 | 6.8 | |
| (22.0) | (22.0) | (21.7) | ||||||||||
| a. | Mining and Quarrying | 3.9 | 8.8 | 4.0 | 11.8 | 10.1 | 7.6 | 3.2 | 3.1 | 2.2 | 4.2 | |
| b. | Manufacturing | 6.8 | 6.2 | 7.1 | 4.0 | 6.7 | 6.9 | 7.1 | 6.4 | 7.3 | 7.4 | |
| c. | Electricity, Gas and | |||||||||||
| Water Supply | 5.6 | 3.8 | 5.4 | 4.3 | 3.9 | 4.8 | 2.4 | 4.8 | 2.9 | 5.2 | ||
| 3. | Services | 7.5 | 7.2 | 8.2 | 7.2 | 7.9 | 6.8 | 7.5 | 7.4 | 9.5 | 8.7 | |
| (50.5) | (56.1) | (56.1) | ||||||||||
| a. | Trade, Hotels, | |||||||||||
| Restaurants, Transport | ||||||||||||
| and Communication | 8.4 | 7.0 | 10.9 | 6.4 | 7.4 | 6.5 | 8.8 | 9.6 | 11.7 | 13.1 | ||
| b. | Financing, Insurance, | |||||||||||
| Real Estate and Business | ||||||||||||
| services | 7.8 | 8.8 | 6.4 | 9.6 | 9.8 | 8.6 | 4.4 | 7.1 | 7.3 | 7.7 | ||
| c. | Community, Social and | |||||||||||
| Personal services | 7.1 | 5.8 | 5.9 | 6.2 | 6.4 | 5.6 | 7.7 | 4.2 | 8.9 | 2.8 | ||
| d. | Construction | 5.2 | 7.3 | 6.0 | 7.1 | 9.5 | 7.4 | 7.5 | 5.7 | 6.4 | 5.1 | |
| 4. | GDP at factor cost | 6.1 | 4.0 | 8.1 | 5.1 | 5.5 | 2.0 | 4.9 | 5.7 | 8.4 | 10.4 | |
| *: QuickEstimates #: Advance Estimates; n.a.: Not available. Notes: | ||||||||||||
A sharp acceleration of real GDP commenced from the second quarter, strengthening to reach double-digits in the third quarter of 2003-04. Agriculture led the resurgence on the strength of a record kharif output which was reinforced in the second half of the year by a bumper rabi crop. Growth in manufacturing gained in each successive quarter, drawing from the revival of rural demand and exports. The overall expansion of the services sector was mainly driven by ‘trade, hotels, restaurants, transport and communication’. The acceleration in this segment and a steady improvement in performance of ‘finance, insurance, real estate and business services’ took real GDP growth originating in the services sector to 8.7 per cent in the third quarter.
The services sector remained the principal driver of the Indian economy, contributing 57 per cent of the growth of real GDP in 2003-04. ‘Agriculture and allied activities’ contributed 25 per cent of real GDP growth, compensating for the negative contribution of 31 per cent witnessed in 2002-03. On the other hand, industry’s contribution to growth declined to 18 per cent in 2003-04 from 34 per cent in the preceding year (Chart 1). The share of services in GDP has risen steadily from 47.5 per cent in 1992-93 to 56.1 per cent in 2003-04. The share of 'agriculture and allied activities' has declined from 31.5 per cent of GDP in 1992-93 to 22.2 per cent in 2003-04. The share of industry has remained broadly unchanged at 21-22 per cent. The shifts in sectoral shares reflect the longer-term structural changes that are transforming the Indian economy.
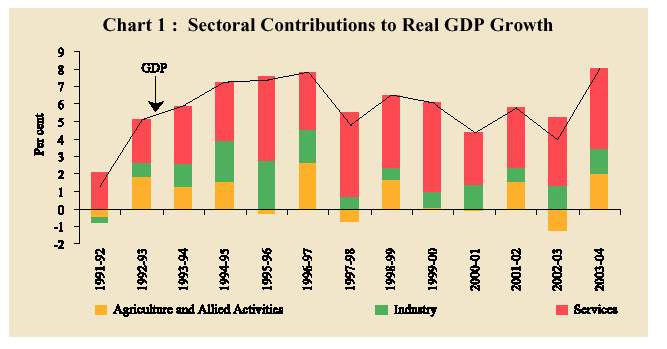
The underlying shifts in the production structure of the economy are reinforcing the leading role of services in the Indian economy. Boosting growth in ‘trade, hotels, restaurants, transport and communication’ is the expansion in new subscribers in cellular services, upsurge in tourist arrivals and higher occupancy of hotels. According to the CSO, net tonne kilometres and passenger kilometres in respect of railways grew by 5.5 per cent and 3.7 per cent, respectively, during the first three quarters of 2003-04. Production of commercial vehicles and cargo handled at major ports showed a growth of 35.7 per cent and 7.5 per cent, respectively.
The buoyancy in the services sector reflects its increasing synergies with the commodity producing sectors, demand for consumer services and external demand for a wide spectrum of knowledge-based services. Information technology (IT) services contribute more than three per cent of GDP. The ITES (IT Enabled Services)/ business process outsourcing (BPO) segments have witnessed high growth in recent years, especially in the form of services exports. The sector has benefited from a major rise in new investments during 2003-04, with Indian companies consolidating their presence in segments such as customer care and administration. According to the National Association of Software and Service Companies (NASSCOM), BPO is likely to have grown by 50 per cent during 2003-04.
Agricultural Situation
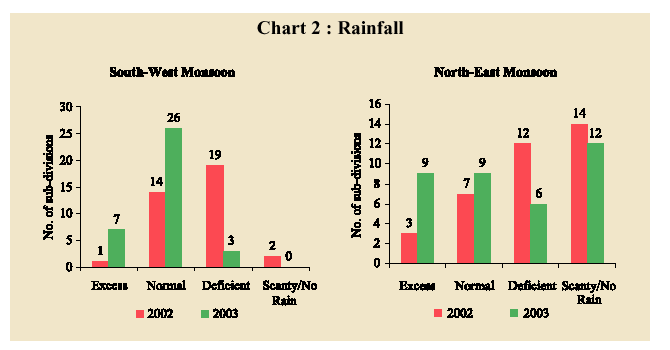
Moisture conditions turned favourable for a reinvigoration of agricultural activity in 2003-04. The cumulative rainfall recorded during the South-West monsoon was two per cent above the Long Period Average (LPA) with 33 out of the 36 meteorological sub-divisions receiving normal/excess rainfall. Only three subdivisions, viz., north and south interior Karnataka and Kerala received deficient rains. Fortuitously, rainfall in the sowing months of June and July 2003 was at 109 per cent and 107 per cent, respectively, of the LPA. The North-East monsoon was normal with the cumulative rainfall at nine per cent above the LPA. Normal/excess rainfall was received in 18 sub-divisions (10 in the corresponding period of 2002-03) while deficient/scanty/no rains occurred in the rest of the sub-divisions (Chart 2).
The live water storage in the major reservoirs was 23 per cent of the Full Reservoir Level (FRL) on March 19, 2004, which was 115 per cent of the preceding year’s level and 76 per cent of the decennial average. Despite the congenial conditions of water availability, a worrisome feature was the prevalence of localised droughts. In 2003-04, as many as 62 out of the 267 drought affected meteorological districts in 2002-03 continued to experience acute moisture stress. These areas were spread across Karnataka (16 districts), Tamil Nadu (nine districts), Kerala (seven districts), Punjab (five districts) and Maharashtra (four districts).
According to the Second Advance Estimates of the Ministry of Agriculture (February 16, 2004), foodgrains production is expected to have recorded a growth of 22 per cent to touch an all-time high of 212.2 million tonnes in 2003-04. Oilseeds output is estimated to have grown by over 60 per cent to scale a new peak. Cotton production is estimated to have risen by around 43 per cent, although it would still be lower than the peak of 14.2 million bales achieved in 1996-97. On the other hand, sugarcane production is expected to have declined by nine per cent mainly due to pest attack and localised drought in some of the major sugarcane growing areas. The Index of Agricultural Production (all crops) is, thus, expected to have gone up by 19.6 per cent in 2003-04 as against (-) 15.2 per cent recorded in 2002-03.
An across-the-board increase enabled the kharif foodgrains production to touch the target of 111 million tonnes set for 2003-04 (Table 2), up by 23 million tonnes from the level in 2002-03. Oilseeds production, in particular, is expected to have risen by about 84 per cent during kharif 2003-04. Rabi foodgrains production is also expected to be close to the target and higher by 17.2 per cent than the level in 2002-03. Wheat production is expected to have risen by 17 per cent and oilseeds production (rabi) by about 38 per cent. The favourable prospects for the rabi output emanated from the delayed withdrawal of the South-West monsoon, the subsequent moderate temperature in the north followed by a normal North-East monsoon. These conducive conditions resulted in an improvement in area coverage under major crops.
Table 2 : Agricultural Production
| Crop | Season | 2002-03 | 2003-04 | ||||
| Target (million tonnes) | Achieve- ment $ (million tonnes) | Area Coverage (% of normal area) | Target (million tonnes) | Achieve- ment $$ (million tonnes) | Area Coverage (% of normal area) | ||
| 1 | 2 | 3 | 4 | 5 | 6 | 7 |
8 |
| Rice | Kharif | 78.6 | 63.7 | 78.0 | 78.6 | 77.8 | 87.0 |
| Rabi | 14.4 | 9.0 | 90.0 | 14.4 | 10.1 | 92.0 | |
| Total | 93.0 | 72.7 | 93.0 | 93.0 | 87.9 | n.a. | |
| Wheat | Rabi | 78.0 | 65.1 | 94.0 | 78.0 | 76.1 | 103.0 |
| Coarse Cereals | Kharif | 25.8 | 20.0 | 86.0 | 27.0 | 27.7 | 99.0 |
| Rabi | 7.6 | 5.3 | 103.0 | 7.0 | 6.0 | 105.0 | |
| Total | 33.0 | 25.3 | 15.0 | 34.0 | 33.7 | n.a. | |
| Pulses | Kharif | 6.0 | 4.1 | 95.0 | 6.0 | 5.4 | 117.0 |
| Rabi | 10.0 | 7.0 | 117.0 | 9.0 | 9.0 | 141.0 | |
| Total | 16.0 | 11.0 | n.a. | 15.0 | 14.4 | n.a. | |
| Foodgrains | Kharif | 110.5 | 87.8 | n.a. | 111.4 | 111.0 | n.a. |
| Rabi | 109.5 | 86.4 | 100.0 | 108.3 | 101.2 | 111.0 | |
| Total | 220.0 | 174.2 | n.a. | 220.0 | 212.2 | n.a. | |
| Oilseeds | Kharif | 15.9 | 9.1 | 88.0 | 14.7 | 16.7 | 100.0 |
| Rabi | 11.1 | 6.0 | 108.0 | 10.0 | 8.3 | 125.0 | |
| Total | 27.0 | 15.6 | 24.7 | 24.7 | 25.0 | n.a. | |
| Sugarcane | Total | 320.0 | 281.6 | 102.0 | 320.0 | 255.5 | 95.0 |
| Cotton # | Total | 15.0 | 8.7 | 80.0 | 15.0 | 12.4 | 84.0 |
| Jute and Mesta ## | Total | 12.0 | 11.4 | 90.0* | 12.0 | 11.6 | 88.0* |
| $: Final Estimates; $$: Second Advance Estimates as on February 16, 2004; | |||||||
The stocks of foodgrains with the Food Corporation of India and State-level agencies were drawn down from the peak level of 64.8 million tonnes on June 1, 2002 to 22.8 million tonnes (13.6 million tonnes of rice, 8.6 million tonnes of wheat and 0.6 million tonnes of coarse grains) as on March 1, 2004. The foodgrains stocks, however, still remain above the norm (16.8 million tonnes) to be maintained as on January 1 as well as on April 1 (15.6 million tonnes).
The steep decline in the stocks was on account of lower procurement of wheat during the rabi marketing season of 2002-03 and 2003-04. Paddy procurement was lower during the kharif marketing season of 2002-03 (by 26 per cent), but higher (by about 33 per cent) during the kharif marketing season of 2003-04 (October 1, 2003 to April 26, 2004). The off-take of foodgrains during 2003-04 (April to end-February) was higher under the Targeted Production Distribution System (TPDS) (by 13 per cent) and other welfare schemes (OWS) (by 28 per cent) than in the preceding year; on the other hand, off-take under open market sales (OMS) declined (by 34 per cent) (Table 3).
Table 3 : Management of Food Stocks
| (Million tonnes) | ||||||||
| Month | Opening | Procurement | Off-take | Closing | Norm* | |||
| Stock of | Stock | |||||||
| Foodgrains | PDS | OWS | OMS | Exports | ||||
| 1 | 2 | 3 | 4 | 5 | 6 | 7 | 8 | 9 |
| 2003 | ||||||||
| April | 32.8 | 13.1 | 1.6 | 0.9 | 0.2 | 0.8 | 41.3 | 15.6 |
| May | 41.3 | 3.6 | 2.0 | 1.6 | 0.1 | 0.9 | 39.8 | |
| June | 39.8 | 1.0 | 1.5 | 2.5 | 0.2 | 1.3 | 35.2 | |
| July | 35.2 | 0.2 | 2.2 | 1.4 | 0.1 | 2.2 | 30.5 | 24.3 |
| August | 30.5 | 0.2 | 1.8 | 0.8 | 0.1 | 0.9 | 27.9 | |
| September | 27.9 | 0.2 | 2.2 | 1.0 | 0.1 | 0.9 | 23.7 | |
| October | 23.7 | 7.2 | 1.8 | 0.7 | 0.1 | 0.9 | 22.1 | 18.1 |
| November | 22.1 | 1.6 | 1.9 | 0.7 | 0.1 | 0.6 | 25.4 | |
| December | 25.4 | 2.9 | 1.7 | 0.7 | 0.2 | 0.5 | 25.0 | |
| 2004 | ||||||||
| January | 25.0 | 2.3 | 2.2 | 0.9 | 0.2 | 0.4 | 24.0 | 16.8 |
| February | 24.0 | 2.6 | 1.7 | 1.1 | 0.1 | 0.5 | 22.8 | |
| March | 22.8 | 2.1 | n.a. | n.a. | n.a. | n.a. | n.a. | |
| April @ | n.a. | 5.1 | n.a. | n.a. | n.a. | n.a. | n.a. | 15.6 |
| PDS: Public Distribution System; OWS: Other Welfare Schemes; @ : Up to April 19, 2004 | ||||||||
Industrial Performance
The strengthening of industrial growth in India was broad-based and occurred in an environment of accelerating industrial activity in various parts of the world, especially in East Asian economies. External demand embodied in exports provided a boost to a spectrum of manufacturing industries, supported by improvement in domestic demand conditions and reductions in excise duties on a host of intermediate inputs.
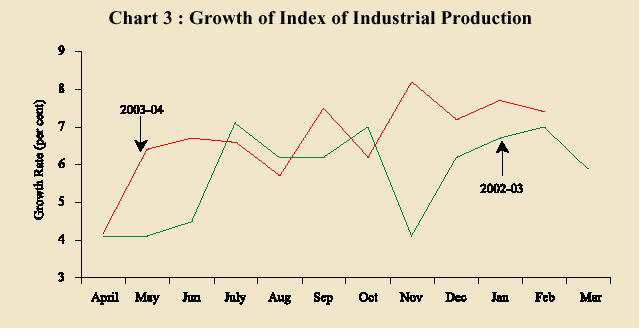
The CSO’s advance estimates indicate a distinct pick-up in the growth of real GDP originating in industry from the second quarter that was sustained in the third quarter of 2003-04. The upturn was evident as early as May 2003 in terms of the index of industrial production (IIP) (Chart 3). Over the period April 2003-February 2004, industrial production rose faster than in the preceding year on account of higher growth in the manufacturing sector (Chart 4). The CSO has placed the growth of real GDP originating in manufacturing at 7.1 per cent in 2003-04 as against 6.2 per cent in the preceding year.
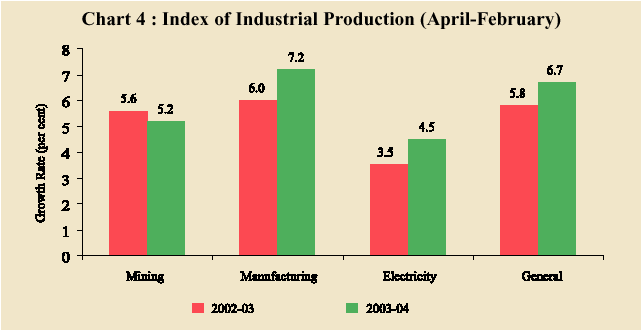
On a cumulative basis, the industrial sector recorded a higher growth during 2003-04 (up to February) as compared with the corresponding period of the previous year. Both the manufacturing and electricity sectors witnessed an acceleration in growth, while mining recorded a deceleration. The contribution of the manufacturing and electricity sectors to the overall IIP growth was also higher than in the preceding year.
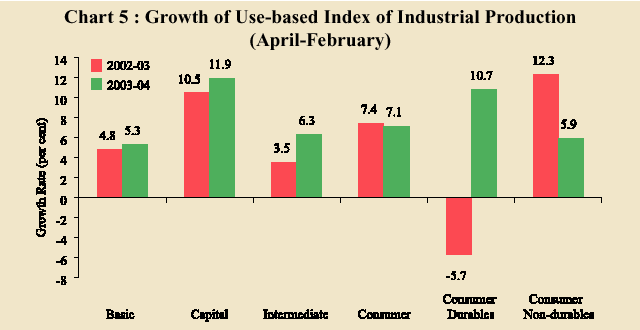
In terms of the use-based classification, all sectors except consumer goods showed improved performance during 2003-04. Higher growth in the basic goods sector was on account of increased generation of electricity in hydel and thermal power plants. The higher growth in the intermediate goods sector was in consonance with the general improvement in economic activity, particularly in agriculture. The capital goods sector maintained robust growth for the second year in succession. Consumer durables showed a significant turnaround during 2003-04, facilitated by an increase in retail lending and softening of interest rates. Within the consumer goods sector, consumer non-durables recorded lower growth than in the preceding year (Chart 5).
The improvement in manufacturing activity was well distributed. Within the 17 major groups, six groups constituting a weight of 28.7 per cent in the IIP registered a growth in the range of 7.4 per cent-18.0 per cent - well above the sectoral growth of 7.2 per cent. These six industry groups comprise 'transport equipment and parts’, ‘basic metal and alloy industries’, ‘machinery and equipment other than transport equipment’, ‘wood and wood products', ‘paper and paper products and printing, publishing & allied industries’ and ‘beverages, tobacco and related products’. The high growth in the transport
equipment sector was reflected in increased sales of cars and commercial vehicles. Higher production and import of capital goods facilitated growth in the machinery and equipment sector. These industry groups together contributed 67.9 per cent of the growth in the manufacturing sector. Seven industry groups achieved positive growth but less than the growth of manufacturing sector as a whole. On the other hand, four industry groups recorded negative growth, viz., 'jute and other vegetable fibre textiles (except cotton)’, ‘textile products (including wearing apparel)’, ‘cotton textiles’ and ‘leather and leather & fur products’ (Table 4).
Table 4 : Industry Group Growth Rates in 2003-04 (April-February)
| Negative | 0-4 per cent | 4-8 per cent | Above 8 per cent | ||||
| 1 | 2 | 3 | 4 | ||||
| 1. | Jute and other | 1. | Metal products and | 1. | Other manufacturing | 1. | Paper & paper products |
| vegetable fibre textiles | parts (except | industries (5.5) | and printing, publishing | ||||
| (except cotton) (-4.6) | machinery and | & allied industries (16.3) | |||||
| equipment) (3.5) | |||||||
| 2. | Textile products | 2. | Food products | 2. | Non-metallic mineral | 2. | Transport equipment |
| (including wearing | (1.8) | products (4.2) | and parts (17.9) | ||||
| apparel) (-2.7) | |||||||
| 3. | Leather and leather& | 3. | Rubber, plastic, | 3. | Basic metal and alloy | ||
| fur products (-3.3) | petroleum and coal | industries (9.8) | |||||
| products (5.5) | |||||||
| 4. | Cotton textiles (-4.1) | 4. | Basic chemicals & | 4. | Beverages, tobacco | ||
| chemical products | and related products | ||||||
| (except production | (8.4) | ||||||
| of petroleum & coal) | |||||||
| (7.1) | |||||||
| 5. | Wood and wood | 5. | Machinery and | ||||
| products, furniture & | equipment other | ||||||
| fixtures (7.4) | than transport | ||||||
| equipment (13.8) | |||||||
| 6. | Wool, silk and man- | ||||||
| made fibre textiles | |||||||
| (5.0) | |||||||
| Note: Figures in brackets are growth rates. | |||||||
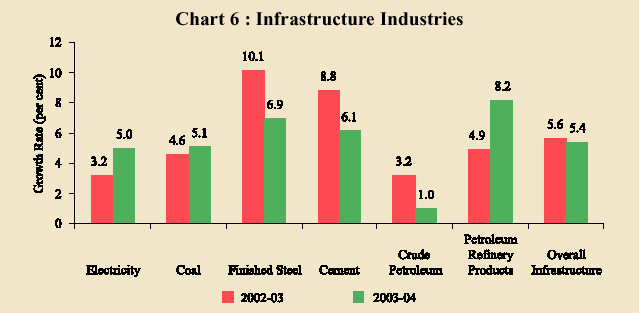
The performance of the infrastructure industries was generally lacklustre in 2003-04 with some improvement during February and March 2004. Crude petroleum was adversely affected on account of high water - oil ratio in some of the oil fields up to September 2003. Cement production slowed down on account of less than expected demand in the post-monsoon period. The increased prices of raw materials and other costs adversely affected steel production in 2003-04 (Chart 6).
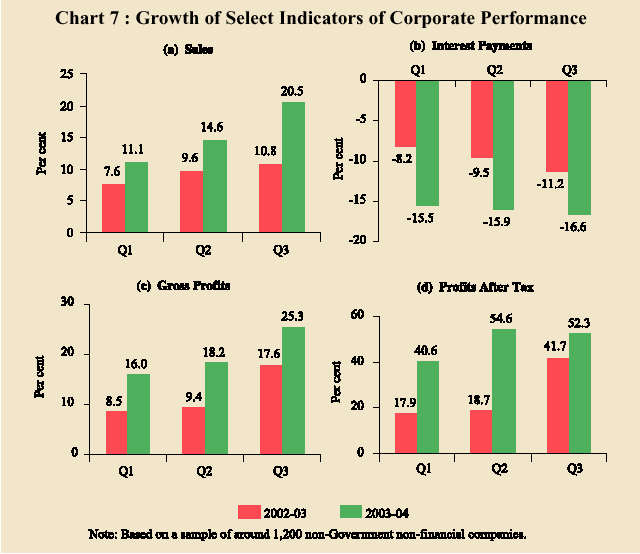
Indications of an improvement in the investment climate are getting clearer and a robust business optimism is permeating the Indian industry. Banks’ non-food credit off-take has picked up since the second half of 2003-04. Sanctions and disbursements by the All India Financial Institutions (AIFIs) were substantially higher. External capital flows have been of an unprecedented order. The buoyant performance of the private corporate business sector is reflected in marked and successive increases in growth of sales and profits. The corporate sector also experienced a steady decline in interest payments (Chart 7).
The continued buoyancy of the capital goods sector augurs well for industrial performance in future. The outlook for industry has improved considerably. The business expectations survey of the National Council of Applied Economic Research (NCAER) indicates a better outlook. The business confidence index shows a rise by 6.7 per cent in January-June 2004 over October 2003 -March 2004, reflecting the buoyant corporate results and a stable global environment. The Indian Leading Index of the Delhi School of Economics-Economic Cycle Research Institute (DSE-ECRI) released in March 2004, has also shown continued optimism. A majority of respondents in the business outlook survey of the Confederation of Indian Industry (CII) for October-March 2004 expected capacity utilisation in the range of 75-100 per cent with no change in inventory levels and increase in profit margins.
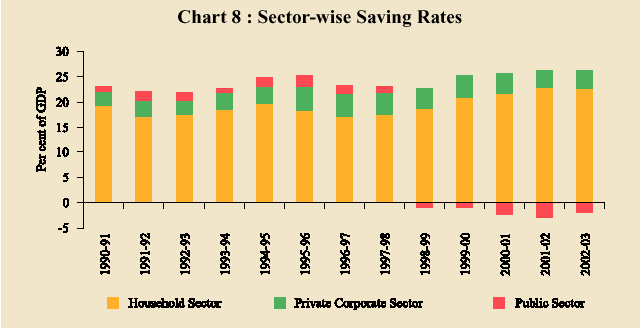
The latest estimates for saving and capital formation pertain to 2002-03. The CSO’s quick estimates indicate that the rate of Gross Domestic Saving (GDS) rose to 24.2 per cent of GDP at current market prices in 2002-03, entirely due to reduction in the public sector’s dis-saving (Chart 8). Households - the mainstay of overall saving in the economy - recorded a decline in terms of financial saving which, in turn, marginally reduced the rate of household sector saving. There was also a marginal decline in the rate of private corporate sector saving in 2002-03 (Table 5).
The rate of Gross Domestic Capital Formation (GDCF) increased from 23.1 per cent of GDP in 2001-02 to 23.3 per cent in 2002-03 solely because of the increase in the rate of investment of the household sector. Total consumption expenditure declined to 76.9 per cent of GDP in 2002-03 owing to a fall in private final consumption expenditure. Government final consumption expenditure, on the other hand, remained unchanged in relation to GDP.
Table 5 : Gross Domestic Saving and Investment
| Per cent of GDP** | Amount in Rupees crore | ||||||||
| Item | 1999- | 2000- | 2001- | 2002- | 1999- | 2000- | 2001- | 2002- | |
| 00 | 01 | 02@ | 03* | 00 | 01 | 02@ | 03* | ||
| 1 | 2 | 3 | 4 | 5 | 6 | 7 | 8 | 9 | |
| 1. | Household Sector Saving | 20.8 | 21.7 | 22.7 | 22.6 | 4,02,360 | 4,53,641 | 5,19,040 | 5,59,258 |
| a. Financial Assets | 10.5 | 10.4 | 11.1 | 10.3 | 2,03,702 | 2,17,841 | 2,54,304 | 2,54,407 | |
| b. Physical Assets | 10.3 | 11.3 | 11.6 | 12.3 | 1,98,658 | 2,35,800 | 2,64,736 | 3,04,851 | |
| 2. | Private Corporate Sector Saving | 4.4 | 4.1 | 3.5 | 3.4 | 84,329 | 86,142 | 78,849 | 84,169 |
| 3. | Public Sector Saving | -1.0 | -2.3 | -2.7 | -1.9 | -20,049 | -48,022 | -62,704 | -45,730 |
| 4. | Gross Domestic Saving (GDS) | 24.1 | 23.5 | 23.5 | 24.2 | 4,66,640 | 4,91,761 | 5,35,185 | 5,97,697 |
| 5. | Net capital inflow | 1.1 | 0.6 | -0.3 | -0.9 | 21,988 | 12,977 | -7,268 | -22,664 |
| 6. | Gross Domestic Capital | ||||||||
| Formation (GDCF) | 25.2 | 24.2 | 23.1 | 23.3 | 4,88,628 | 5,04,738 | 5,27,917 | 5,75,033 | |
| 7. | Total Consumption Expenditure | 78.6 | 77.7 | 77.9 | 76.9 | 15,22,664 | 16,24,255 | 17,78,358 | 18,99,959 |
| a. Private final consumption | 65.7 | 65.1 | 65.5 | 64.4 | 12,71,556 | 13,60,018 | 14,94,050 | 15,91,132 | |
| expenditure | |||||||||
| b. Government final | |||||||||
| consumption expenditure | 13.0 | 12.6 | 12.5 | 12.5 | 2,51,109 | 2,64,237 | 2,84,308 | 3,08,827 | |
| Memo Items | |||||||||
| Saving-Investment Balance (4-6) | -1.1 | -0.6 | 0.3 | 0.9 | -21,988 | -12,977 | 7,268 | 22,664 | |
| Public Sector Balance# | -8.0 | -8.7 | -8.6 | -7.5 | -1,54,533 | -1,82,047 | -1,95,707 | -1,86,116 | |
| Private Sector Balance# | 8.4 | 9.6 | 9.7 | 8.9 | 1,62,911 | 2,00,187 | 2,21,832 | 2,19,997 | |
| a. Private Corporate Sector | -2.1 | -0.8 | -1.4 | -1.4 | -40,791 | -17,654 | -32,472 | -34,410 | |
| b. Household Sector | 10.5 | 10.4 | 11.1 | 10.3 | 2,03,702 | 2,17,841 | 2,54,304 | 2,54,407 | |
| @ : Provisional Estimates; : Quick Estimates; | |||||||||
Since 2001-02, the rate of GDCF has remained below the rate of GDS, as reflected in current account surpluses in the balance of payments. The overall saving-investment surplus increased in 2002-03. The public sector saving -investment gap narrowed in 2002-03, reflecting its reduced dis-saving. Households' financial saving, on the other hand, suffered a marginal erosion.
Page Last Updated on:


