 IST,
IST,


I. Growth Saving and Investment
| Growth Rates |
| Agricultural Situation |
| Saving and Investment |
The Central Statistical Organisation (CSO) has estimated real GDP growth at 6.9 per cent in 2004-05, down from 8.5 per cent (revised estimates) in 2003-04. Macroeconomic performance in 2004-05 turned out to be stronger than anticipated. Although beset by an uneven and deficient South-West monsoon, below normal North-East monsoon and the base effect of a seven-year peak growth of 9.6 per cent achieved in 2003-04, real GDP originating from 'agricultural and allied activities' rose by 1.1 per cent in 2004-05. The industrial recovery firmed up and broadened during the year, led by manufacturing and 'electricity, gas and water supply', considerably mitigating the setback to agriculture. Real GDP originating from services continued to sustain the robust growth recorded in 2003-04 (Table 1).
|
Table 1 : Sectoral Growth Rates of Real GDP |
||||||||||||
|
Sector |
Average |
2003-04* |
2004-05# |
2003-04 |
2004-05 |
|||||||
|
(1992-93 to |
||||||||||||
|
2002-03) |
||||||||||||
|
Q1 |
Q2 |
Q3 |
Q4 |
Q1 |
Q2 |
Q3 |
||||||
|
1 |
2 |
3 |
4 |
5 |
6 |
7 |
8 |
9 |
10 |
11 |
||
|
1. |
Agriculture and |
|||||||||||
|
Allied Activities |
2.4 |
9.6 |
1.1 |
0.1 |
7.2 |
1 8.2 |
1 0.5 |
3.3 |
- 0.8 |
- 1.1 |
||
|
(27.0) |
(21.7) |
(20.5) |
||||||||||
|
a) Agriculture |
2.4 |
|||||||||||
|
2. |
Industry |
6.3 |
6.5 |
8.3 |
5.6 |
6.0 |
6.4 |
7.9 |
7.6 |
8.8 |
9.1 |
|
|
(22.0) |
(21.6) |
(21.9) |
||||||||||
|
a) Mining and Quarrying |
4.4 |
6.4 |
5.3 |
4.5 |
4. 2 |
5.8 |
9.0 |
6.1 |
4.9 |
4.8 |
||
|
b ) Manufacturing |
6.8 |
6.9 |
8.9 |
6.1 |
6. 9 |
7.0 |
7.6 |
8.0 |
9.3 |
1 0.4 |
||
|
c) Electricity, Gas and |
||||||||||||
|
Water Supply |
5.4 |
3.7 |
6.3 |
3.0 |
1.1 |
3.0 |
9.5 |
6.3 |
9.3 |
4.4 |
||
|
3. |
Services |
7.6 |
8.9 |
8.6 |
7.8 |
1 0.5 |
9.5 |
7.6 |
8.9 |
8.0 |
8.7 |
|
|
(51.0) |
(56.7) |
(57.6) |
||||||||||
|
a) Trade, Hotels, Restaurants, |
||||||||||||
|
Transport and |
||||||||||||
|
Communication |
8.5 |
1 1.8 |
1 1.3 |
8.0 |
1 0.4 |
1 3.6 |
1 3.8 |
1 1.0 |
1 1.6 |
1 0.5 |
||
|
b ) Financing, Insurance, Real |
||||||||||||
|
Estate and Business services |
7.8 |
7.1 |
7.1 |
6.4 |
7.2 |
7.3 |
8.5 |
7.0 |
5.9 |
8.1 |
||
|
c) Community, Social and |
||||||||||||
|
Personal services |
6.7 |
5.8 |
6.0 |
9.0 |
1 4.9 |
5.2 |
-3.1 |
9.3 |
4.5 |
5.8 |
||
|
d ) Construction |
5.5 |
7.0 |
5.7 |
7.5 |
7.8 |
5.9 |
7.6 |
3.6 |
5.2 |
8.0 |
||
|
4. |
GDP at factor cost |
5.9 |
8.5 |
6.9 |
5.6 |
8.8 |
1 1.0 |
8.2 |
7.4 |
6.6 |
6.2 |
|
|
* :Quick Estimates. |
||||||||||||
The performance of the Indian economy in 2004-05 has generated considerable optimism about medium-term macroeconomic prospects. It is heartening to note that in spite of the sharp slowdown in agriculture, the overall growth of GDP in 2004-05 was higher than the average growth attained over the preceding 12-year period beginning 1992-93. Consequently, the average growth of 6.5 per cent recorded during the first three years of the Tenth Plan period (2002-07) has already outstripped the average of 5.5 per cent achieved in the Nineth Plan period, i.e. , 1997-2002 and is broadly in line with the average of 6.7 per cent achieved in the Eighth Plan period (1992-97). These stylised facts indicate that the structural acceleration of growth that is underway is based on solid foundations, including a weather-proofing of the economy. These factors are equipping India to remain among the fastest growing economies of the world in the medium-term.
The salutary effects of the bumper rabi crop of 2003-04, reinforced by a strong pick-up in activity in the industrial and the services sectors, were reflected in an improvement in real GDP growth in the first quarter of 2004-05. In the second and third quarters, the uneven spread of the South-West monsoon from mid-July, despite the early onset, led to an absolute decline in agricultural growth. Deceleration in growth rates of financing, insurance, real estate, business services, community, social and personal services in relation to the corresponding quarter of the previous year dampened the buoyancy of the overall services sector in the second quarter of 2004-05 with the slowing down becoming more pronounced in the third quarter of 2004-05 due to deceleration in ‘trade, hotels, restaurants, transport and communication’. Real GDP growth originating in the industrial sector sustained its momentum through the first three quarters of 2004-05.
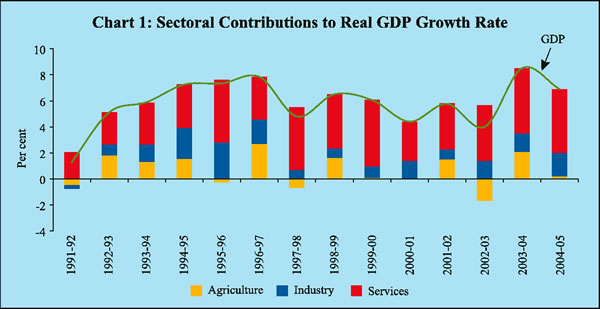
A significant feature of the macroeconomic developments in 2004-05 was the resurgence of the industrial sector, propelled by buoyant exports and a brightening of the domestic investment climate in an environment of rising business optimism and consumer confidence. Industry contributed 26 per cent to overall growth of the economy, up from 17 per cent in 2003-04, in spite of a secular decline in its share in GDP. 'Agriculture and allied activities', on the other hand, exhibited considerable volatility in terms of contribution to real GDP growth. In 2004-05, ‘agriculture and allied activities’ contributed 3 per cent of real GDP growth as against 24 per cent in 2003-04 (Chart 1).
The services sector remained the main engine of growth of the economy during 2004-05. Recent gains in growth momentum under 'trade, hotels, transport and communication' were consolidated during the year, benefiting from a sharp rise in net tonne kilometres (8.2 per cent) and passenger kilometres (6.9 per cent) in respect of railways, a surge in the production of commercial vehicles (30.4 per cent), expansion in cargo handled at major ports (11.1 per cent), increase in the gross trading index (8.6 per cent) and rising tele-density
as a result of a 30.3 per cent increase in the stock of telephone connection, during April-December, 2004-05. The growth of ‘community, social and personal services’ remained stable at the previous year's level, reflecting the commitment to fiscal consolidation and expenditure containment.
India has been consolidating its position as a world leader in software and Information Technology (IT) services. According to the National Association of Software and Services Companies (NASSCOM), the Indian software industry is expected to raise its export revenues by 35 per cent during 2004-05 to US $ 17.3 billion, reflecting the increasing returns to knowledge advantage. The financial services sector including banks, insurance companies and securities firms account for the largest share of India's software and IT services exports at 37 per cent during 2003-04, followed by the telecommunication and the manufacturing sectors. The Information Technology Enabled Services-Business Process Outsourcing (ITES-BPO) segment generated a revenue of US $ 3.9 billion in 2003-04 and is expected to grow by 44.4 per cent during 2004-05 on top of 45.3 per cent in 2003-04. Alongside the rapid expansion of the IT-ITES sector's contribution to GDP from 1.4 per cent at the end of the 1990s to 3.5 per cent in 2003-04, employment in the sector surged from 5,22,250 in 2001-02 to 8,41,500 in 2003-04. Besides capitalising on labour cost, arbitraging on time zone and language, Indian IT companies are increasingly positioning themselves to seek larger shares in the global IT services market, currently estimated at US $ 396 billion. The increasing consolidation through mergers and acquisitions, expansion of services that are being offered from India, higher value end-services, cost competitiveness and expansion in capacity underscore the strengthening of the Indian ITES-market. Even in the ITES-BPO segment, cross-selling, strong balance sheets, end-to-end service offerings are setting the tone of competitive expansion. Indian IT companies have been moving-up in the value chain into IT consulting and system integration, hardware support and installation and processing services besides emerging areas such as healthcare, telecommunication, retail and government services.
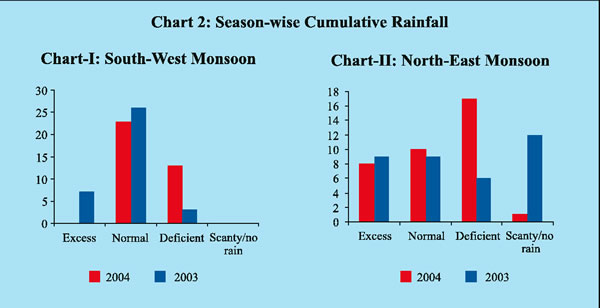
Adverse moisture conditions affected agricultural activity in 2004-05, eroding the gains of the strong rebound in growth that had occurred in 2003-04. The cumulative area weighted rainfall during the South-West monsoon (June 1 to September 30, 2004) was 13 per cent below the Long Period Average (LPA) as compared with two per cent above the LPA during the previous year. The rainfall was also unevenly distributed with 23 out of 36 meteorological sub-divisions registering excess/normal rainfall and 13 with deficient/scanty rainfall (Chart 2). At the sub-divisional level, Himachal Pradesh, West Uttar Pradesh, Punjab, West Rajasthan, Vidharbha and Telangana experienced moderate drought conditions. North-West India was the worst affected with a seasonal rainfall deficiency of 22 per cent, followed by the South Peninsula (15 per cent), Central India (11 per cent) and North-East India (6 per cent). Of the 524 meteorological districts, 25 per cent districts experienced a moderate drought, while seven per cent underwent severe drought conditions (seasonal rainfall deficiency exceeding 50 per cent) at the end of the season. The unsatisfactory spread of the South-West monsoon, particularly in the main sowing month of July, resulted in decline in sown area of major crops and a shift to short-duration low yielding varieties.
The North-East monsoon season (October 1 to December 31, 2004) was satisfactory up to November 24, 2004 but deteriorated thereafter. The cumulative area weighted rainfall during the season was 11 per cent below normal as compared with nine per cent above normal during the previous year.
The total live water storage in the 73 major reservoirs monitored by the Central Water Commission was 23 per cent of the Full Reservoir Level (FRL) on April 8, 2005, viz., 112 per cent of the preceding year's level and 89 per cent of the decennial average.
According to the Third Advance Estimates released by the Ministry of Agriculture, kharif foodgrains production in 2004-05 is estimated to be around 104 million tonnes - a shortfall of 11 per cent over the preceding year. The decline was mainly in the production of coarse cereals. Kharif oilseeds also recorded a shortfall of over 12 per cent. The satisfactory beginning of the NorthEast monsoon coupled with a comfortable water reservoir position augured well for rabi sowing. Rabi foodgrains production - placed at over 106 million tonnes - is expected to exceed the previous year's level (97 million tonnes) and recoup some of the loss of kharif output. Rabi oilseeds are also expected to register a sizeable increase (2 3 per cent).
The Third Advance Estimates placed the total foodgrains production during 2004-05 at over 210 million tonnes, down from over 213 million tonnes in the preceding year. The production of coarse cereals (-10 per cent) and rice (-1 per cent) is expected to have suffered a decline. Wheat and pulses output is, however, expected to have exceeded the previous year's level. Among non-foodgrains, the production of cotton is expected to have recorded a significant growth (16 per cent), while the output of sugarcane and oilseeds is estimated to have declined marginally (Table 2).
The total stocks of foodgrains with the Food Corporation of India and other Government agencies declined from a peak level of 41.3 million tonnes as
|
Table 2 : Agricultural Production – Crop-wise and Season-wise |
|||||||||
|
Crop |
2003-04 |
2004-05 |
|||||||
|
Target |
Achievement |
Area Coverage |
Target |
Achievement $ |
Area Coverage |
||||
|
(million |
(million |
(% of normal |
(million |
(million |
(% of normal |
||||
|
tonnes) |
tonnes) |
area) |
tonnes) |
tonnes) |
area)@ |
||||
|
1 |
2 |
3 |
4 |
5 |
6 |
7 |
|||
|
Rice |
9 3.0 |
8 8.3 |
91 |
9 3.5 |
8 7.1 |
8 7.0 |
|||
|
Wheat |
78 |
7 2.1 |
101 |
7 9.5 |
7 4.1 |
101 |
|||
|
Coarse Cereals |
34 |
3 8.1 |
104 |
3 6.8 |
3 4.3 |
94 |
|||
|
Pulses |
1 5.0 |
1 4.9 |
130 |
1 5.3 |
1 5.0 |
122 |
|||
|
Foodgrains |
|||||||||
|
Kharif |
1 1 1.7 |
1 1 6.9 |
1 1 3.8 |
1 0 4.1 |
|||||
|
Rabi |
1 0 8.3 |
9 6.6 |
1 1 1.3 |
1 0 6.4 |
|||||
|
Total |
2 2 0.0 |
21 3.5 |
1 0 3 |
2 2 5.1 |
21 0.4 |
98 |
|||
|
Oilseeds |
|||||||||
|
Kharif |
1 4.7 |
1 7.0 |
99 |
1 6.3 |
1 4.7 |
115 |
|||
|
Rabi |
1 0.0 |
8.1 |
121 |
9.9 |
1 0.5 |
132 |
|||
|
Total |
2 4.7 |
2 5.3 |
1 0 7 |
2 6.2 |
2 5.2 |
121 |
|||
|
Sugarcane |
3 2 0.0 |
2 3 7.3 |
106 |
2 7 0.0 |
2 3 4.7 |
90 |
|||
|
Cotton # |
1 5.0 |
1 3.9 |
83 |
1 5.0 |
1 6.1 |
97 |
|||
|
Jute |
and Mesta ## |
1 1.2 |
1 1.2 |
98 * |
1 1.8 |
1 0.0 |
85 * |
||
|
$:Third Advance Estimates. |
|||||||||
on May 1, 2003 to 21.6 million tonnes (14.2 million tonnes of rice and 7.3 million tonnes of wheat) as on February 1, 2005. The foodgrain stocks, however, remained well above the buffer stock norms (Table 3).
|
Table 3 : Management of Foodstocks |
||||||||||
|
(Million Tonnes) |
||||||||||
| Month |
Opening |
Foodgrains |
Off-take |
Closing |
Norms * |
|||||
|
Stock of |
Procurement |
Stock |
||||||||
| Foodgrains |
TPDS |
OWS |
OMS - |
Exports |
||||||
|
Domestic |
||||||||||
|
1 |
2 |
3 |
4 |
5 |
6 |
7 |
8 |
9 |
||
|
2 0 0 3 |
||||||||||
|
April |
3 2.8 |
1 3.1 |
1.6 |
0.9 |
0.2 |
0.8 |
4 1.3 |
1 5.8 |
||
|
May |
4 1.3 |
3.7 |
2.0 |
1.6 |
0.1 |
0.9 |
3 9.8 |
|||
|
June |
3 9.8 |
0.9 |
1.5 |
2.5 |
0.2 |
1.3 |
3 5.2 |
|||
|
July |
3 5.2 |
0.2 |
2.3 |
1.4 |
0.1 |
2.2 |
3 0.5 |
2 4.3 |
||
|
August |
3 0.5 |
0.2 |
1.9 |
0.8 |
0.1 |
0.9 |
2 7.9 |
|||
|
September |
2 7.9 |
0.2 |
2.2 |
1.0 |
0.1 |
0.9 |
2 3.7 |
|||
|
October |
2 3.7 |
6.4 |
1.8 |
0.7 |
0.1 |
0.9 |
2 2.1 |
1 8.1 |
||
|
November |
2 2.1 |
2.4 |
2.1 |
0.7 |
0.1 |
0.6 |
2 5.4 |
|||
|
December |
2 5.4 |
2.1 |
1.9 |
0.7 |
0.2 |
0.5 |
2 5.0 |
|||
|
2 0 0 4 |
||||||||||
|
January |
2 5.0 |
3.5 |
2.4 |
0.9 |
0.2 |
0.4 |
2 4.0 |
1 6.8 |
||
|
February |
2 4.0 |
2.2 |
1.9 |
1.1 |
0.1 |
0.5 |
2 2.8 |
|||
| March |
2 2.8 |
2.1 |
2.5 |
1.2 |
0.1 |
0.4 |
2 0.6 |
|||
|
April |
2 0.6 |
1 5.7 |
2.0 |
0.5 |
0.0 |
0.3 |
3 2.4 |
1 5.8 |
||
|
May |
3 2.4 |
3.1 |
2.3 |
0.6 |
0.0 |
0.1 |
3 2.3 |
|||
|
June |
3 2.3 |
1.3 |
2.3 |
1.0 |
0.0 |
0.1 |
3 0.6 |
|||
|
July |
3 0.6 |
0.5 |
2.4 |
1.0 |
0.0 |
0.1 |
2 7.2 |
2 4.3 |
||
|
August |
2 7.2 |
0.2 |
2.4 |
1.0 |
0.0 |
0.1 |
2 3.0 |
|||
|
September |
2 3.0 |
0.2 |
2.5 |
1.0 |
0.0 |
0.1 |
2 0.3 |
|||
|
October |
2 0.3 |
6.5 |
2.4 |
0.8 |
0.0 |
0.0 |
2 3.7 |
1 8.1 |
||
|
November |
2 3.7 |
2.7 |
2.4 |
0.6 |
0.0 |
0.0 |
21.8 |
|||
|
December |
21.8 |
2.6 |
2.6 |
0.7 |
0.0 |
0.0 |
21.7 |
|||
|
2 0 0 5 |
||||||||||
|
January |
21.7 |
3.9 |
2.3 |
0.8 |
0.0 |
0.0 |
21.6 |
1 6.8 |
||
|
February |
21.6 |
2.3 |
N.A |
N.A |
N.A |
N.A |
N.A |
|||
| March |
N.A |
1.7 |
N.A |
N.A |
N.A |
N.A |
N.A |
|||
|
TPDS: Targeted Public Distribution System. |
||||||||||
The procurement of foodgrains (rice and wheat) during 2004-05 was higher by 11 per cent in relation to the previous year. The offtake of foodgrains during 2004-05 (April to January) was higher under the Targeted Public Distribution System (TPDS) by over 20 per cent, reflecting the impact of lower agricultural production in some parts of the country due to deficient rainfall. On the other hand, offtake declined under Open Market Sales (OMS) and Other Welfare Schemes (OWS) due to the comfortable supply position. Exports of foodgrains declined due to reduced level of stocks with the Food Corporation of India and other agencies.
The industrial recovery that has set in during the second half of 2003-04 firmed up further in 2004-05, driven mainly by the manufacturing sector. As in 2003-04, surging exports provided a stimulus to manufacturing activity, benefiting from the environment of accelerating industrial activity in other parts of the world. The noteworthy feature of the industrial performance of 2004-05 was the significant improvement in domestic demand that provided a boost to a number of manufacturing industries.
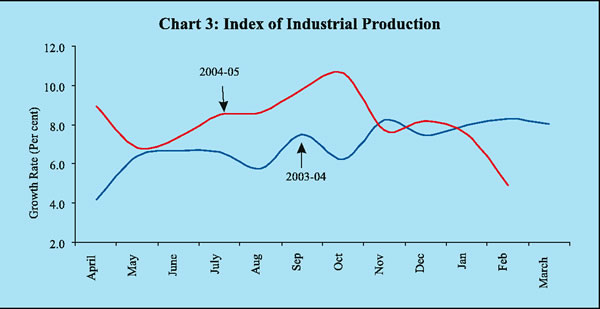
According to the CSO's advance estimates, the upturn in the growth of value-added originating in industry, which occurred in the fourth quarter of 2003-04, was sustained through the third quarter of 2004-05. This was strongly correlated with the index of industrial production (IIP) which rose sharply between May and October 2004 before losing some momentum thereafter (Chart 3). The CSO placed the growth of real GDP originating in manufacturing at 8.9 per cent for 2004-05 as against 6.9 per cent in the preceding year.
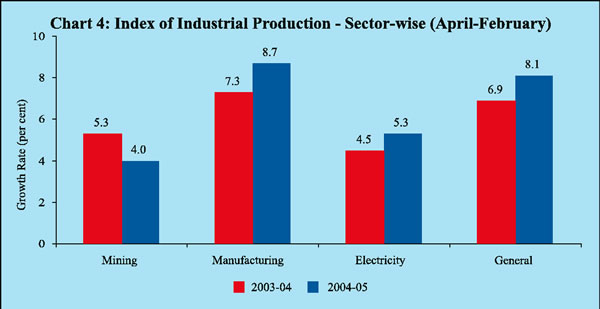
All the components of industry except mining and quarrying shared in the acceleration of activity during the year (Chart 4). The manufacturing sector recorded the highest growth with a contribution of 89.8 per cent to the overall growth of the industrial sector. Electricity generation recorded a faster expansion due to the higher plant load factor achieved by thermal power plants and improved hydro-generation on the back of comfortable reservoir levels. Output in the mining sector declined marginally despite improved coal mining activities due to higher demand and dispatches.
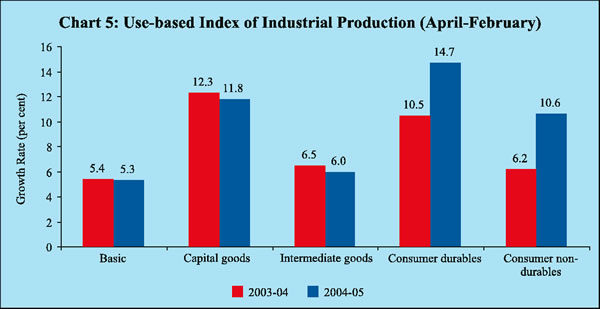
Within the 17 major groups of the manufacturing sector, four groups, viz. , 'machinery and equipment other than transport equipment', 'other manufacturing industries', 'textile products (including wearing apparel)' and 'chemical and chemical products except products of petroleum coal' - constituting 28.7 per cent of the IIP - registered growth in the range of 15-20 per cent (up to February). The high growth in 'machinery and equipment other than transport equipment' was reflective of the expansion of capacity and the improved industrial investment. The surge in the growth of 'basic chemicals and chemical products' drew strength from the overall improved demand from other industries. These two industry groups together contributed 64.1 per cent of the growth in the manufacturing sector. Ten industry groups achieved positive growth but less than the growth of the manufacturing sector. On the other hand, two industry groups recorded decline in output, viz., 'food products' and 'wood and wood products, furniture and fixtures' (Table 4).
|
Table 4 : Manufacturing Industry Groups – Growth Rates in 2004-05(April-February) |
|||||||||
|
Negative |
0-5 per cent |
5-10 percent |
Above 10 per cent |
||||||
|
1 |
2 |
3 |
4 |
||||||
|
1. Food products (-0.6) |
1. Rubber, plastic, petroleum and coal |
1. Cotton textiles (7.3) |
1. Machinery and equipment other than transport equipment (19.6) |
||||||
|
2. Wood and wood products, furniture & fixtures(-8.5) |
2. Jute and other vegetable fibre textiles (3.3) |
2. Metal products and parts (6.6) |
2. Other Manufacturing industries (17.3) |
||||||
|
3. Transport equipment and parts(3.5) |
3. Paper & paper products and printing, publishing & allied industries (8.5) |
3. Basic chemicals and chemical products(15.3) |
|||||||
|
4. Wool, silk and man-made fibre textiles (2.9) |
4. Leather and leather & fur products(5.2) |
4. Textile products (16.5) |
|||||||
|
5. Basic metal and alloy industries(4.9) |
5. Beverages, tobacco and related products (10.03) |
||||||||
|
6. Non-metallic Mineral products(1.2) |
|||||||||
|
Note: Figures in brackets indicate growth rates. |
|||||||||
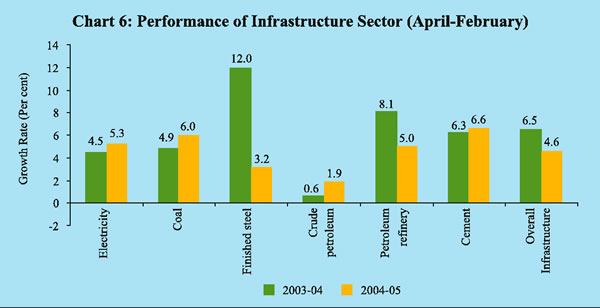
In contrast to the acceleration in manufacturing activity, the output of the infrastructure sector slowed down mainly on account of the subdued performance of finished steel and petroleum refinery products industries (Chart 6).
Increased production and imports of capital goods, the surge in banks' non-food credit, the significant increase in sales and profits in the financial performance of the corporate sector together reflect an improvement in the industrial climate. The sharp rise in the incremental flow of funds to industry during 2004-05 reflected the extensive use of bank financing by medium and large industries. External commercial borrowings, including short-term trade credit, increased sharply in 2004-05. Similarly, the resources raised by companies from the primary market were also considerable during the year.
Surveys of business confidence indicate that this upbeat sentiment is shared by corporate India. The Business Confidence Index (BCI) of the National Council of Applied Economic Research (NCAER) showed an improvement for January 2005 to 142.5 from 136.0 reported in the previous round of the survey in October 2004. According to the Reserve Bank's Industrial Outlook Survey, the Business Expectations Index for January-March 2005 stood at 122.5 points, registering a rise of 0.4 per cent over the previous quarter. The Confederation of Indian Industry's Business Outlook Survey for October 2004-March 2005 points to improved capacity utilisation and higher capital investment. The Dun & Bradstreet's Business Optimism Index for the fourth quarter of 2004-05 recorded an increase of 28.4 per cent over the previous quarter. The positive outlook for the industrial sector is an indication of expanding activity and confidence and augurs well for sustaining the recent acceleration of industrial growth.
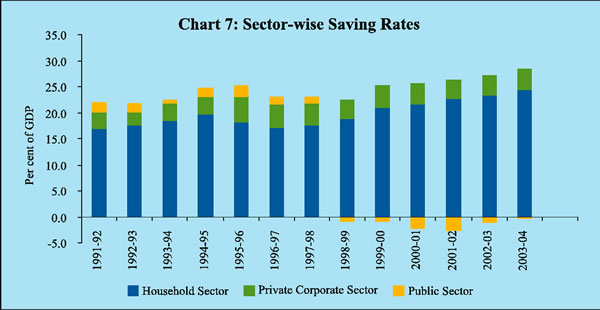
The CSO's quick estimates for 2003-04 indicate that the rate of Gross Domestic Saving (GDS) increased significantly to 28.1 per cent of GDP at current market prices from 26.1 per cent in 2002-03. The household sector continued to be the major contributor with its rate of saving climbing steadily since 1996-97. Improvement in the financial performance of joint stock companies, co-operative banks and societies enabled the rate of private corporate sector saving to be marginally higher in 2003-04 than in the previous year. The rate of public sector dissaving has declined considerably sin c e 2002-03, benefiting from better performance in government administration, departmental and non-departmental enterprises (Chart 7).
|
Table 5 : Gross Domestic Saving and Investment |
|||||||||
|
Per cent of GDP |
Amount in Rupees |
crore |
|||||||
|
Item |
2000- |
2001- |
2002- |
2003- |
2000- |
2001- |
2002- |
2003- |
|
|
01 |
02 |
03@ |
04* |
01 |
02 |
03@ |
04* |
||
|
1 |
2 |
3 |
4 |
5 |
6 |
7 |
8 |
9 |
|
|
1. Household Sector Saving |
21.6 |
2 2.6 |
2 3.3 |
2 4.3 |
452268 |
513110 |
574681 |
671692 |
|
|
a) Financial Assets |
1 0.4 |
1 1.2 |
1 0.3 |
1 1.4 |
216774 |
253964 |
254439 |
314261 |
|
|
b ) Physical Assets |
1 1.3 |
1 1.4 |
1 3.0 |
1 3.0 |
235494 |
259146 |
320242 |
357431 |
|
|
2. Private Corporate Sector Saving |
4.1 |
3.6 |
3.8 |
4.1 |
86142 |
81076 |
94269 |
114157 |
|
|
3. Public Sector Saving |
-2.3 |
-2.7 |
-1.1 |
-0.3 |
-48361 |
-61912 |
-26652 |
-9429 |
|
|
4. Gross Domestic Saving (GDS) |
2 3.5 |
2 3.4 |
2 6.1 |
2 8.1 |
490049 |
532274 |
642298 |
776420 |
|
|
5. Net Capital Inflow(+)/Outflow(-) |
0.4 |
-0.8 |
-1.3 |
-1.8 |
8130 |
-18731 |
-32010 |
-49552 |
|
|
6. Gross Domestic Capital Formation |
|||||||||
|
(GDCF) |
2 3.8 |
2 2.6 |
2 4.8 |
2 6.3 |
498179 |
513543 |
610288 |
726868 |
|
|
7. Total Consumption Expenditure |
7 7.7 |
7 6.0 |
7 6.2 |
7 5.3 |
1624255 |
1772054 |
1876679 |
2077958 |
|
|
a) Private Final Consumption |
|||||||||
|
Expenditure |
6 5.1 |
6 5.5 |
6 4.3 |
6 4.0 |
1360018 |
1488781 |
1585132 |
1765849 |
|
|
b) Government Final |
|||||||||
|
Consumption Expenditure |
1 2.6 |
1 0.5 |
1 1.8 |
1 1.3 |
264237 |
283273 |
291547 |
312109 |
|
|
Memo Items |
|||||||||
|
Saving-Investment Balance |
(4-6) |
-0.4 |
0.8 |
1.3 |
1.8 |
-8130 |
18731 |
32010 |
49552 |
|
Public Sector Balance# |
-8.6 |
-8.9 |
-6.4 |
-5.9 |
-179866 |
-202007 |
-158618 |
-163515 |
|
|
Private Sector Balance# |
9.4 |
1 0.1 |
9.9 |
1 1.0 |
197207 |
230269 |
242958 |
304241 |
|
|
a) Private Corporate Sector |
-0.9 |
-1.0 |
-0.5 |
-0.4 |
-19567 |
-23695 |
-11481 |
-10020 |
|
|
b ) Household Sector |
1 0.4 |
1 1.2 |
1 0.3 |
1 1.4 |
216774 |
253964 |
254439 |
314261 |
|
|
@ : Provisional Estimates. |
|||||||||
The rate of GDCF has remained below the rate of GDS since 2001-02, reflecting the current account surpluses in the balance of payments. The overall saving-investment surplus increased to 1.8 per cent in 2003-04 from 1.3 per cent in 2002-03. While the private sector saving-investment surplus increased in 2003-04 in keeping with the uptrend that occurred in 1997-98, the public sector's saving-investment deficit narrowed further, extending the onset of fiscal adjustment since 2001-02.

Share this page:


Install the RBI mobile application and get quick access to the latest news!
Scan the QR code to install our app


Page Last Updated on:


