 IST,
IST,


I. Output
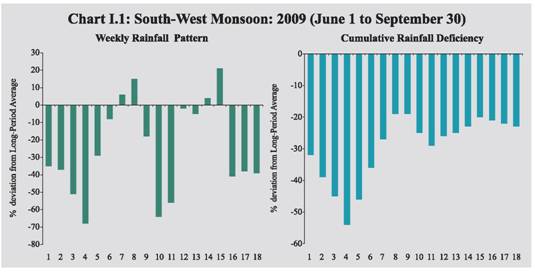
India's GDP growth during the first quarter of 2009-10 at 6.1 per cent represents a modest recovery from the 5.8 per cent growth registered during the preceding two quarters, though still lower than 7.8 per cent growth that was achieved in the first quarter of 2008-09 and the 8.8 per cent average growth experienced during 2003-08. The sequential recovery over the previous quarter was driven by notable turnaround in industrial output. During April to August 2009-10, both industry and core infrastructure sectors have shown accelerated growth and few lead indicators of services sector activities also suggest some pick up in growth momentum. The deficient monsoon coupled with recent floods in some States and their expected adverse impact on the kharif agricultural production, however, entail downside risk for the overall growth prospects. I.1 After a phase of distinct deceleration in growth during the second half of 2008-09, the Indian economy exhibited signs of recovery with higher growth in GDP during the first quarter of 2009-10 and acceleration in the pace of recovery in industrial output and core infrastructure activities. According to the estimates released by the Central Statistical Organisation (CSO) in August 2009, real GDP growth during the first quarter of 2009-10 was placed at 6.1 per cent, which is higher than 5.8 per cent recorded during the preceding two quarters of 2008-09. The growth during the first quarter of 2009-10 was supported by rebound in industrial activity, particularly the turnaround in manufacturing sector (from the negative growth in the previous quarter) and relative resilience of growth in services, notwithstanding the recent deceleration. The real GDP growth during the first quarter of 2009-10, however, was lower than 7.8 per cent recorded in the first quarter of 2008-09, which reflects the persistence of the impact of the synchronised global recession, notwithstanding the emerging signs of recovery. (Table 1.1). Agricultural Situation I.2 Deficient monsoon has emerged as the key factor in dampening the pace of recovery in India’s growth in the near-term. The South-West Monsoon had arrived in Kerala on May 23, 2009, i.e., one week ahead of the normal schedule. The progress of monsoon, however, got delayed significantly and with every delay, the rainfall deficiency and the prospects of drought like conditions also increased. The cumulative rainfall during the season (up to September 30, 2009) over the entire country has been 23 per cent below normal as against 1 per cent below normal during the corresponding period of the previous year. The shortfall in rainfall as per the foodgrains production weighted index of the Reserve Bank has been higher (27 per cent below normal) as compared to the corresponding period of the previous year (4 per cent above normal). The deficiency in rainfall during the South-West monsoon season has exceeded the revised forecast of the India Meteorological Department (IMD) issued in August, according to which rainfall during the season (June to September, 2009) was likely to be below normal at 93 per cent of the Long Period Average (with a model error of ± 4.0 per cent). The temporal distribution of the rainfall activity shows that the initial concerns about shortfall in June rainfall receded somewhat in July, which helped to improve the sowing position. The rainfall turned deficient again during the first half of August 2009, before picking up subsequently since the middle of the month (Chart I.1).
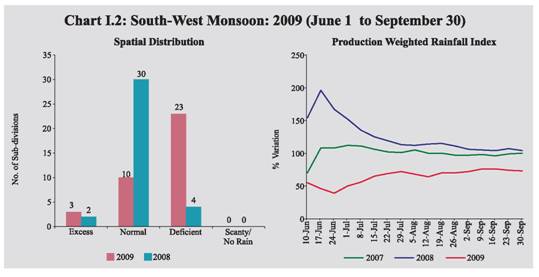
I.3 The spatial distribution of rainfall reveals that of the 36 meteorological subdivisions, cumulative rainfall has been excess/normal in 13 sub-divisions (32 subdivisions last year) (Chart I.2). The pick up in rainfall activity since mid-August 2009 has resulted in substantial improvement in the country’s water reservoir level, though it continues to remain below last year’s level. As on October 22, 2009, the total live water storage in the 81 major reservoirs of the country was 64.0 per cent of the Full Reservoir Level (FRL) (72.0 per cent during the corresponding period last year). I.4 As on September 30, 2009, around 300 districts have been declared drought hit, partially or wholly, in 12 States. During the season, flood incidents were also reported in some States, viz., Karnataka, Assam, Meghalaya, Arunachal Pradesh, West Bengal, Orissa, Bihar, Jharkhand, Uttar Pradesh, Uttarakhand, Haryana, Punjab, Himachal Pradesh, Gujarat, Maharashtra, Madhya Pradesh, Kerala and Andhra Pradesh. I.5 The deficient South-West monsoon has impacted the kharif sowing, which is about 5.4 per cent below that of the last year. Latest sowing position indicates that sowing of all crops during the current kharif season as on October 16, 2009 was 92 per cent of the normal level (Table 1.2). Sowing of most pulses and cotton are higher than last year levels, while the sowing of coarse cereals and jute remained the same as last year, though paddy sowing has been substantially affected (16 per cent below last year’s level). Other crops whose sowing has been affected somewhat include oilseeds and sugarcane. Considering that Kharif paddy is an important crop accounting for about 86 per cent of total rice production and 36 per cent of total foodgrains production in India, the shortfall in its sowing could be expected to depress the overall foodgrains production during 2009-10. I.6 The impact of the overall deficiency in rainfall during South-West monsoon season has to be assessed in the context of the pick up in monsoon in the later part of August and in September that could help standing crops in improving their yield. Besides, rainfall has been more deficient in the irrigated belt of the country like Punjab and Haryana where availability of irrigation, particularly in the snow fed Northern river basin could offset some of the potential loss in output. Shortfall in rice sowing during this kharif is being partly compensated in some parts of the country by sowing of short duration Boro rice (post kharif) and shortfall in groundnut sowing is being partly offset by sowing of Toria that could be sown even in the late kharif season. Moreover, delayed withdrawal of South-West monsoon augurs well for rabi crops, particularly winter wheat and oilseeds on account of high moisture retention in the soil. In addition, Indian agriculture is substantially diversified now. Kharif ‘cereals, pulses and oilseeds’ contribute only around 20 per cent to total agricultural output. Rabi contributes another 20 per cent to the overall agricultural GDP. The balance 60 per cent comes from allied sector comprising of horticulture, livestock and fisheries, which has been growing at above 5 per cent during last few years. I.7 Moreover, in recent years, the share of rabi output in total foodgrains production has been increasing and during 2008-09, the rabi accounted for almost half of the overall foodgrains production. During 2008-09, despite shortfall in kharif sowing (-2.3 per cent), the foodgrains production touched an all-time peak, mainly because of higher rabi sowing (2.9 per cent), which compensated for the loss in kharif output (Chart I.3). In view of the drought like situation prevailing in some of the States, the Government of India has initiated several timely measures to overcome the shortfall in kharif production, which include provision of incentives for supplemental irrigation facilities via the diesel subsidy in States having more than 50 per cent deficiency in rainfall; planned efforts to increase rabi production through ensuring availability of seeds, fertilisers and other inputs to farmers and issuing several policies/ advisories with regard to water conservation techniques and providing flexibility to States in the use of funds under various central schemes. In view of the above, there is a possibility of rabi production compensating somewhat for the loss in kharif output as in the previous year, provided that North-East monsoon and climatic conditions remain favourable during the rabi season of 2009-10. I.8 According to IMD, during the Post Monsoon Season (October-December) cumulative rainfall for the period October 1 to 21, 2009 was 12 per cent above normal as compared with 40 per cent below normal during the corresponding period of the previous year. The spatial distribution of rainfall reveals that of the 36 meteorological sub-divisions, cumulative rainfall was excess/normal in 26 subdivisions (5 sub-divisions last year). I.9 According to the Fourth Advance Estimates, the total foodgrains production during 2008-09 reached to a record level of 233.9 million tonnes, about 3 million tonnes higher than the previous year (Table 1.3). The increase in foodgrains production could be mainly attributed to increase in the output of rice and wheat.
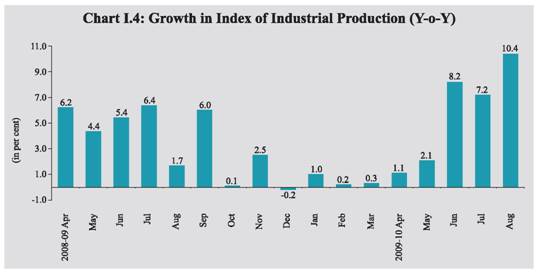
Food Management I.10 The procurement of rice and wheat during 2009-10 (up to October 20, 2009) was higher than that in the corresponding period of the previous year (Table 1.4). As a result, the total stock of foodgrains with the Food Corporation of India (FCI) and other Government agencies reached a peak of 54.8 million tonnes as on June 1, 2009. Since then, the stocks have declined on account of off-take being higher than the procurement and were at 44.3 million tonnes as on October 1, 2009. The stocks of both rice and wheat are, however, much higher than their norms. Industrial Performance I.11 During the current financial year,
industrial production has exhibited
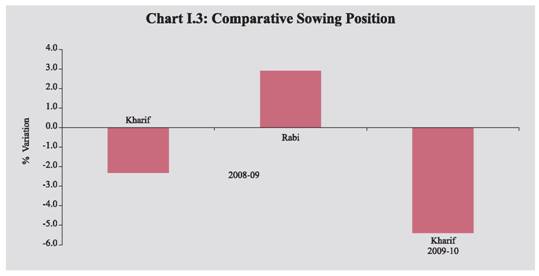
recovery from the loss of growth
momentum witnessed during the second
half of 2008-09. After a short phase of
deceleration, the industrial growth turned
negative in December 2008 and thereafter
turned positive, but remained depressed till
the end of 2008-09. Since April 2009, the
recovery has been more visible and
industrial output clocked double digit
growth in August 2009, which is the highest
recorded since November 2007. The
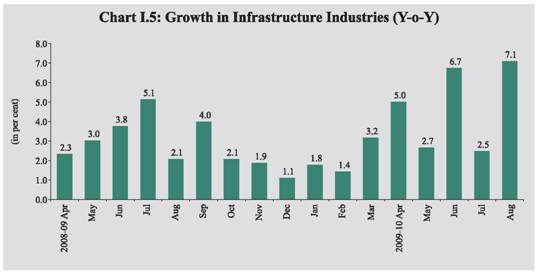
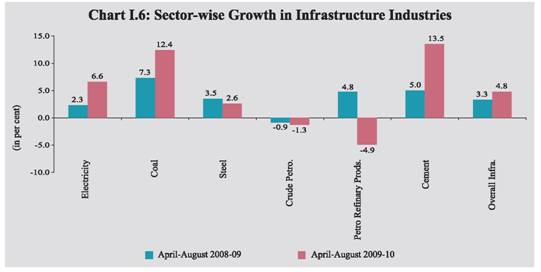
I.12 In terms of use-based classification, while there was noticeable acceleration in basic and intermediate goods segments, the performance of capital and consumer goods still remained sluggish during April-August 2009-10 over the corresponding period of last year. The continuous rise in intermediate goods production indicates pick up in upstream industries and strength in inventory investments. The growth in the capital goods sector, which recovered with robust growth in June 2009 from negative territory during March-May 2009, fell sharply in July 2009, before recouping subsequently with buoyant growth in August 2009. Despite robust growth in the durables goods segment, the growth in the consumer goods remained weak during April-August 2009-10, reflecting mainly the contraction in non-durables output. Non-durables segment has, however, displayed recovery with positive growth in June-August 2009. I.13 Out of 17 two-digit manufacturing industry groups, eight industry groups accounting for 38.4 per cent weight in the IIP recorded decelerated/negative growth during April-August 2009-10 (Table 1.7). I.14 The basic goods sector has manifested steady acceleration during April-August 2009-10, mainly on account of improved performance in electricity, non-metallic mineral products like cement and basic metals. After decline in growth for seven consecutive months (August 2008 to February 2009), intermediate goods sector has recovered strongly since March 2009 and showed a double digit growth in August 2009. Demand seems to have picked up in 2009-10 for intermediate products such as ‘wool, silk and man-made fibre textiles’, ‘wood and wood products’, ‘non metallic mineral products’, ‘metal products and parts except machinery equipment’ and ‘machinery and equipment other than transport equipment. On the contrary, the sharp deceleration in the growth witnessed in the capital goods sector in April-August 2009 as compared to the same period last year has been on account of lower growth in production of ‘machinery and equipment other than transport equipment’ and ‘transport equipment and parts’. The trend in production of capital goods has been volatile, reflecting some uncertainty in investment outlook and the competition from imports. I.15 The positive growth in consumer non-durables during July and August 2009 was on account of ‘cotton textiles’, ‘wool and man-made fibre textiles’, ‘paper and paper products’, ‘leather and fur products’, ‘rubber, plastic, petroleum and coal products’ and ‘machinery and equipment other than transport equipment’. The trends in consumer durables show steady rise in production since January 2009 driven by the production of giant tubes, tractor tyres, window type air conditioners, refrigerators, washing/laundry machines, electric fans, telephone instruments, TV receivers, passenger cars, motor cycles, etc. Infrastructure I.16 During the current financial year 2009-10 (April-August), the core infrastructure sector recorded higher growth at 4.8 per cent compared to 3.3 per cent during the corresponding period of the previous year led by acceleration in coal, cement, and electricity (Chart I.5). The production of crude oil and petroleum refinary products, however, recorded a decline. The production of finished steel witnessed decelerated growth during the period (Chart I.6).
Services Sector I.17 The services sector recorded a lower growth of 7.7 per cent during the first quarter of 2009-10 compared with the double digit growth of 10.0 per cent during the corresponding period of last year. The growth in sub-sectors such as ‘trade, hotels, transport and communication’ and ‘construction’, exceeded the growth in the preceding two quarters but remained lower than the first quarter of 2008-09. However, ‘financing, insurance, real estate and business services’ recorded acceleration in growth compared to the first quarter of 2008-09, reflecting the improved conditions in the financial markets (see Table 1.1). I.18 The slowdown in the services sector is reflected in its contribution to real GDP growth, which receded to 4.9 per cent in the first quarter of 2009-10 from 6.3 per cent during the corresponding period of the previous year (Table 1.8). I.19 The lead indicators of services sector activity for 2009-10, so far, suggest decline in growth in respect of foreign tourist arrivals and production of commercial vehicles, while most of the other lead indicators pertaining to transport services also display a subdued outlook. The production of cement has, however, shown a turnaround along with some buoyancy in steel output, indicating growing momentum in construction activities. There is also pick up in the growth in respect of passengers handled at domestic terminals (Table 1.9). Telecommunication services remain buoyant on considerable growth in the cell phone connections.
I.20 In sum, the aggregate supply conditions as reflected in the growth of GDP indicate that although there is a recovery from the slowdown of the second half of 2008-09, the pace of revival remains subdued. The deficient and uneven precipitation during the South-West monsoon season coupled with recent floods in some States have considerably increased the downside risks for the kharif production during 2009-10. Nonetheless, given the recent past experience and the proactive measures already initiated by the Government, the rabi production may partly reverse the shortfall in kharif production, if climatic and North-East monsoon conditions remain favourable during the rabi season. During the current financial year 2009-10 (April-August), the industrial production has staged a recovery (5.8 per cent) from the loss of growth momentum that it witnessed during the second half of 2008-09. Similarly, the core infrastructure sector during 2009-10 (April-August) has also displayed higher growth (4.8 per cent) over the comparable period last year, underpinned by considerable acceleration in coal, cement, and electricity. Some of the lead indicators for the services sector also show signs of momentum in growth. |
|||||||||||||||||||||||||||||||||||||||||||||||||||||||||||||||||||||||||||||||||||||||||||||||||||||||||||||||||||||||||||||||||||||||||||||||||||||||||||||||||||||||||||||||||||||||||||||||||||||||||||||||||||||||||||||||||||||||||||||||||||||||||||||||||||||||||||||||||||||||||||||||||||||||||||||||||||||||||||||||||||||||||||||||||||||||||||||||||||||||||||||||||||||||||||||||||||||||||||||||||||||||||||||||||||||||||||||||||||||||||||||||||||||||||||||||||||||||||||||||||||||||||||||||||||||||||||||||||||||||||||||||||||||||||||||||||||||||||||||||||||||||||||||||||||||||||||||||||||||||||||||||||||||||||||||||||||||||||||||||||||||||||||||||||||||||||||||||||||||||||||||||||||||||||||||||||||||||||||||||||||||||||||||||||||||||||||||||||||||||||||||||||||||||||||||||||||||||||||||||||||||||||||||||||||||||||||||||||||||||||||||||||||||||||||||||||||||||||||||||||||||||||||||||||||||||||||||||||||||||||||||||||||||||||||||||||||||||||||||||||||||||||||||||||||||||||||||||||||||||

Share this page:


Install the RBI mobile application and get quick access to the latest news!
Scan the QR code to install our app


Page Last Updated on:


