 IST,
IST,


I. Output
GDP growth is reverting to its earlier high growth trajectory led by broad-based growth momentum. Services sector growth and enhanced agricultural output supported the strengthening of the growth process. Industrial growth was robust, albeit with greater volatility. With both services sector and agriculture performing well, sustainability of growth requires continued buoyancy in the industrial sector. Robust growth has coincided with growing sectoral imbalances, particularly in some items where demand is growing faster than capacity, thereby exerting pressure on inflation. For high growth to coexist with a low inflation regime, structural policy measures to limit the magnitude of imbalances would be critical. As downside risks recede, economy is back on the high growth trajectory I.1 With 8.9 per cent growth in the first half of 2010-11, India continues to be one of the fastest growing economies in the world. The uncertainty about the durability of the robust growth seen in Q1 of 2010-11 waned significantly with the momentum continuing in Q2. Notwithstanding the impact of a lower base, the first half GDP growth suggests return to the high growth path (Table I.1). The robust growth momentum in Q2 reflected the continued buoyancy of services sector and further pickup in agricultural performance due to a normal South-West monsoon. Industrial growth, though moderated on account of the base effect, remained on the higher side, but volatile. Rabi outlook suggests continuation of the growth momentum in agriculture sector I.2 Normal rainfall during South-West monsoon and satisfactory progress of North- East monsoon (121 per cent of long period average as on December 31, 2010) have brightened the prospects of agricultural performance during 2010-11. While, the area sown during kharif 2010-11 was 7 per cent higher than that in last year, the area sown during rabi season so far (January 14, 2011) with respect to major rabi crops, namely – wheat and pulses - had surpassed the levels achieved during the corresponding period of last year as well as the normal area sown for the respective crops (Table I.2). Improved sowing positions due to satisfactory monsoon along with improved reservoir positions indicate promising progress for rabi crop.
I.3 As per the First Advance Estimates for kharif production, total kharif foodgrain production during 2010-11 is estimated to be 10.4 per cent higher than the previous year. As regards rabi crop, based on rainfall pattern, higher sowing and improved reservoir positions, production of wheat, rabi pulses (which accounted for around 70 per cent of the overall pulses production in 2009-10) and oilseeds is expected to be higher than the previous year. The year on year growth over a very low base, however, masks the stagnation in per capita availability of food grains. As a result, strong growth in the agriculture sector and a normal monsoon have not eased the pressure on food inflation. Widening demand-supply gaps in some sectors exerting sustained pressures on food inflation I.4 Notwithstanding stronger growth outlook for the agriculture sector, prices of several agricultural commodities continue to remain downward sticky, reflecting structural imbalances. The Eleventh Plan Document estimates the demand-supply gap to be around 13.4 per cent in oilseeds, 18.7 per cent in pulses and around 2.0 per cent in food grains during 2009-101. I.5 Average growth rate of foodgrains production, at 1.6 per cent during 1990-2010, trailed behind the average population growth of 1.9 per cent. With robust growth, the pace of increase in per capita disposable income has far exceeded the rate at which supply is growing. The per capita net availability of foodgrains per day has declined from 510 grams in 1991 to 436 grams in 2008. Supply of major agricultural crops has not kept pace with demand on account of lower rate of increase in yield, inadequate irrigation coverage and excessive dependence on monsoon.
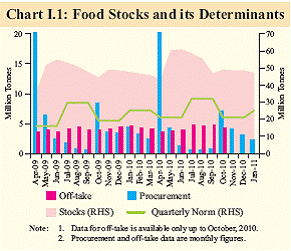
While low yield and increased cost of inputs have pushed dairy prices up, untimely and erratic rainfall affected supply of onions and vegetables in markets I.6 Growing population coupled with rising income levels has altered dietary habits causing substantial increase in demand for various agricultural products, particularly pulses and vegetables as well as other protein-based products like meat, eggs, milk and fish. Inadequate response of production to structural changes in demand pattern continues to fuel demand-supply mismatch in these products. In the case of milk, supply side constraints have put pressure on prices. Also, the rise in input prices of items such as feedstock, labour and fuel have contributed to further pressure on prices. For poultry products like eggs and chicken, a rise in poultry feed prices resulted in higher prices. Excess rainfall in various parts of the country led to damage to crops like onion, potato and tomato, as well as various fruit items. The onion crop was affected in Andhra Pradesh and Karnataka due to cyclonic rainfall in October 2010 and in other states such as Maharashtra, Madhya Pradesh, Gujarat and Rajasthan due to untimely and erratic rainfall in November 2010. Pest infestation has also been a major cause of shortfall in supply of onions. Ample food stocks provide food security, but do not ease pressure on food inflation, partly due to the nature of items driving food inflation which lie beyond the ambit of food security I.7 Food stocks with public procurement agencies, though declining in recent months, continued to remain much higher than their respective buffer stock norms and food security reserve requirements. Lower monthly average procurement of food grains, viz., rice and wheat (up to January 14, 2011) coupled with higher monthly average off-take (up to October 2010) resulted in a decline in food stocks in recent months. The total stock of food grains with the Food Corporation of India (FCI) and other government agencies, which stood at 60.9 million tonnes on June 1, 2010 came down to 47.3 million tonnes on January 1, 2011 (Chart I.1). The policy on food management has to focus on better supply management in relation to demand, besides addressing the structural capacity constraints in food items.
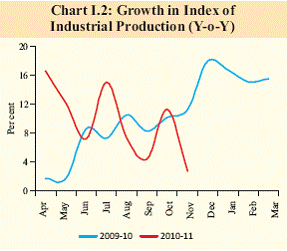
Industrial growth has been robust, but also volatile I.8 The industrial sector recorded a growth of 9.5 per cent during April-November 2010, mainly driven by the performance of the manufacturing and mining sectors (Table I.3). The growth pattern has, however, been volatile through the months of the current year (Chart I.2). I.9 Growth in electricity generation remained modest. Acceleration in manufacturing sector growth was driven by the production of capital goods and consumer durables. Consumer nondurables continued to remain subdued, primarily on account of deceleration in growth of industries such as wheat flour/maida, rice bran oil, coffee, hair oil, hsl lamps, fluorescent tubes and rubber foot wear.
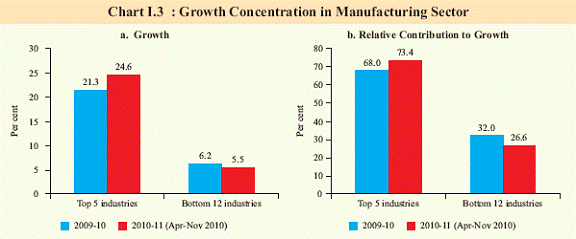
Manufacturing sector growth yet to become broad-based I.10 During April-November 2010, despite nine out of seventeen industries (contributing to about 36 per cent of the weight in the IIP) exhibiting higher growth than last year, manufacturing sector growth is yet to become broad-based. Nearly 73 per cent of the overall growth during the period was contributed by the top five manufacturing industries, with a combined weight of 24.6 per cent in IIP (Chart I.3). Capacity utilisation in core sector remains broadly unchanged, but robust growth entails the risk of capacity pressures I.11 During April-October 2010, capacity utilisation levels in the infrastructure sector did not stretch much relative to last year (Table I.4). The lower capacity utilisation in the cement sector partly reflects larger capacity addition relative to demand.
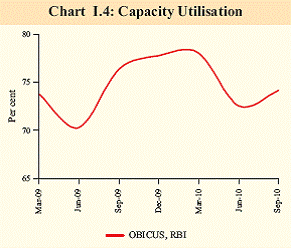
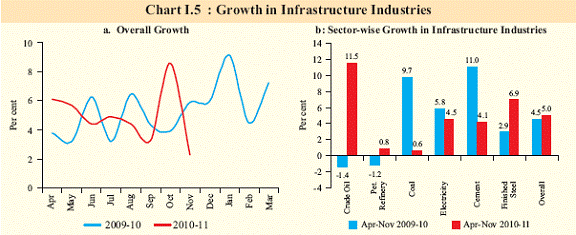
I.12 The Order Books, Inventories and Capacity Utilisation Survey (OBICUS) of the Reserve Bank indicates that capacity utilisation increased during Q2 of 2010-11 but remained below the previous peak (Chart 1.4). I.13 During the second quarter of 2010-11 employment growth situation improved as compared with the previous quarter as well as the corresponding quarter of last year (Table I.5). Growth in core infrastructure lags behind both GDP and industrial sector growth I.14 The six core industries (26.6 per cent of the total weight in IIP) recorded a moderate 5 per cent growth during April-November 2010 over that of the preceding year (Chart I.5). Electricity generation exhibited subdued growth, primarily due to under performance of thermal power generation constrained by negative or very low growth in each type of fossil fuel, especially coal. Coal production, which remained subdued during the current financial year, may continue to fall short of target on account of increasing sensitivity to environmental norms.
Services sector, which has the dominant share in GDP, exhibits sustained momentum I.15 Led by “trade, hotel, restaurant, transport, storage and communication” and “financing, insurance, real estate and business services”, service sector growth during Q2 of 2010-11 showed gradual acceleration over the previous three quarters. The strong growth of various lead indicators, including commercial vehicles production, cell phone connections, air cargo and passengers handled at domestic and international terminals during the year so far, suggest continuation of the recent growth pattern (Table I.6).
For growth momentum to become sustainable, risks to inflation from structural imbalances needs priority attention I.16 The improved kharif production thus far, favourable prospects for rabi production on account of the satisfactory progress of the North- East monsoon and the resultant increase in area coverage under rabi crop in 2010-11 would, going forward, sustain the growth momentum of the agriculture sector. Serious disruptions to supply of agricultural products due to temporary as well as structural shocks call for immediate focus on removal of bottlenecks, minimisation of post-harvest losses, reduction in transaction costs, improvement in cold storage and warehouse facilities and promotion of coordinated supply chains. Services sector growth momentum could continue, as reflected by its various lead indicators. Industrial production, however, is expected to moderate on account of the base effect. The deceleration in the growth of core infrastructure during November 2010 and slowdown in Manufacturing PMI during December 2010 indicate uncertainty about the course of IIP growth in the near term. Downside risks to growth from global uncertainty and increase in oil and commodity prices remain, though a major disruption to growth from these risks appears unlikely. 1Report of the Working Group for the Eleventh Five Year Plan (2007-12) on Crop Husbandry, Agricultural Inputs, Demand and Supply Projections and Agricultural Statistics. Supply pertains to actual domestic production based on Fourth Advance Estimates, while demand estimates in case of oilseeds is based on normative approach, and as regard pulses and foodgrains, the estimates are based on behavioural approach. |
||||||||||||||||||||||||||||||||||||||||||||||||||||||||||||||||||||||||||||||||||||||||||||||||||||||||||||||||||||||||||||||||||||||||||||||||||||||||||||||||||||||||||||||||||||||||||||||||||||||||||||||||||||||||||||||||||||||||||||||||||||||||||||||||||||||||||||||||||||||||||||||||||||||||||||||||||||||||||||||||||||||||||||||||||||||||||||||||||||||||||||||||||||||||||||||||||||||||||||||||||||||||||||||||||||||||||||||||||||||||||||||||||||||||||||||||||||||||||||||||||||

Share this page:


Install the RBI mobile application and get quick access to the latest news!
Scan the QR code to install our app


Page Last Updated on:


