 IST,
IST,


II Recent Economic Development (Part 2 of 3)
(Rupees crore)
| Item | Financial Year | April-November | ||
| (2003-04) | 2003-04 | |||
| Budget | April- | Percentage | Growth | |
| Estimates | November | to BE | Rate | |
| (Per cent) | (Per cent) | |||
| 1 | 2 | 3 | 4 | 5 |
| Revenue Deficit | 1,12,292 | 76,701 | 68.3 | 13.0 |
| Fiscal Deficit | 1,53,637 | 93,656 | 61.0 | 12.3 |
| Gross Primary Deficit | 30,414 | 23,818 | 78.3 | 46.9 |
2.44 Under the debt-swap scheme, the States swapped a part of their high-cost liabilities (on account of small savings) to the Centre, contracted prior to April 1999, with fresh low-cost market borrowings and current liabilities on account of small savings. This helped the States to reduce interest cost of their debt. The Centre, in turn, used these proceeds to discharge part of its liabilities towards the NSSF. Thus, transactions under the debt-swap scheme were reflected in both the non-Plan expenditure (discharge of liabilities to NSSF) and non-debt capital receipts (pre-payment by States) of the Central Government.
2.45 The growth in the gross fiscal deficit (GFD) of the Centre emanated mainly from the higher revenue deficit. Among the other components of the GFD, capital outlay was higher and net lending registered a negative growth. The revenue deficit constituted 81.9 per cent of the GFD as against 73.1 per cent projected in the budget estimates for 2003-04, indicating that a larger share of borrowed resources is being used for current expenditure leaving a lesser amount for investment purposes (Table 2.22).
2.46 Notwithstanding modest successes in expenditure containment in the recent period, the slippages from the budgetary projections underscores the deterioration in the 'quality' of fiscal adjustment. The quality of the fiscal deficit has worsened, with the revenue deficit having increased substantially indicating that a larger share of borrowed funds is preempted by consumption expenditure.
2.47 The growth in revenue receipts for the first eight months of the current fiscal year was higher than the budgeted growth for 2003-04. The rise in revenue receipts was the result of both improved tax collection as well as higher non-tax revenue. Corporation tax rose significantly during April-November 2003, perhaps indicating the improvement in the corporate scenario. The higher non-tax revenue was mainly on account of improved collections from economic services (Table 2.23). Non-debt capital receipts rose three-fold with respect to the level during April-
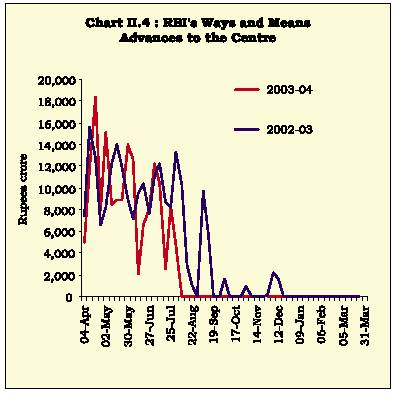
Table 2.22: Decomposition of GFD
| Item | April-November | |||
| 2002-03 | 2003-04 | |||
| 1 | 2 | 3 | ||
| Revenue Deficit | 67,888 | 76,701 | ||
| Capital Outlay | 14,654 | 47,969 | ||
| Net Lending | 3,974 | -29,474 | ||
| Disinvestment | -3,122 | -1,540 | ||
| Gross Fiscal Deficit | 83,394 | 93,656 | ||
| Notes: | 1. | As disinvestment proceeds reduce GFD, they are indicated with a negative sign. | ||
| 2. | Figures include Rs.32,602 crore received under the State debt-swap scheme and used for discharge of liabilities with NSSF. | |||
Table 2.23: Revenue Receipts of the Centre
| Item | Financial Year | April-November | |||
| (2003-04) | 2003-04 | ||||
| Budget Estimates | April-November | Percentage to BE | Growth Rate | ||
| 1 | 2 | 3 | 4 | 5 | |
| I. | Revenue Receipts | 2,53,935 | 1,37,084 | 54.0 | 10.9 |
| Tax Revenue (Net) | 1,84,169 | 90,010 | 48.9 | 12.0 | |
| Non-Tax Revenue | 69,766 | 47,074 | 67.5 | 8.8 | |
| II. | Gross tax revenue | 2,51,527 | 1,29,185 | 51.4 | 9.4 |
| Corporation Tax | 51,499 | 21,987 | 42.7 | 31.7 | |
| Income Tax | 44,070 | 20,715 | 47.0 | 7.5 | |
| Customs Duties | 49,350 | 31,916 | 64.7 | 7.6 | |
| Union Excise Duties | 96,791 | 48,790 | 33.0 | 1.1 |
REPORT ON CURRENCY AND FINANCE
November 2002 mainly reflecting the state debt- swap operations amounting to Rs.32,602 crore between June and November 2003. The realisation from disinvestments was Rs.1,540 crore.
2.48 The aggregate expenditure during April-November 2003 registered a substantial increase mainly on account of discharge of liabilities towards NSSF. Excluding redemption of securities to the NSSF, aggregate expenditure during the first eight months of the current fiscal year grew by 10.2 per cent as against a growth of 8.6 per cent budgeted for the full fiscal year. The higher growth in expenditure was on account of increase in revenue expenditure (Table 2.24). Of the total expenditure, non-Plan expenditure constituted 76.2 per cent. The composition of Plan and non-Plan expenditures, net of NSSF repayments, was, however, in tune with budget estimates, which was 72.4 per cent and 27.6 per cent, respectively. Interest payments, defence and subsidies together constituted a substantial portion of the non-Plan expenditure (net of NSSF repayments). Under the
Table 2.24: Expenditure of the Centre
| Item | Financial Year | April-November | |||
| (2003-04) | 2003-04 | ||||
| Budget | (April- | Percentage | Growth | ||
| Estimates November) | to BE | Rate | |||
| (Per | (Per | ||||
| cent) | cent) | ||||
| 1 | 2 | 3 | 4 | 5 | |
| Total Expenditure | 4,38,795 | 2,80,051 | 63.8 | 24.7 | |
| I. | Plan Expenditure | 1,20,974 | 66,577 | 55.0 | 15.4 |
| II. | Non-Plan Expenditure | 3,17,821 | 2,13,474 | 67.2 | 27.9 |
| Of which: | |||||
| Interest Payments | 1,23,223 | 69,838 | 56.7 | 4.0 | |
| Defence | 65,300 | 30,640 | 46.9 | 4.3 | |
| Major Subsidies | 48,636 | 33,726 | 69.3 | 30.7 | |
| III. | Revenue Expenditure | 3,66,227 | 2,13,785 | 58.4 | 11.6 |
| IV. | Capital Expenditure | 72,568 | 66,266 | 91.3 | 100.4 |
State debt-swap arrangement, the States had prepaid loans against small savings to the tune of Rs.32,602 crore during the April-November 2003. The Central Government, in turn, used the proceeds to discharge its liabilities with the NSSF.
Public Debt
2.49 The widening fiscal gap led to a steep rise in the outstanding liabilities of the Central Government. The outstanding domestic debt of the Central Government as a ratio to GDP is budgeted to rise (Table 2.25). The sharp increase in the debt-GDP ratio, reflective of burgeoning interest payments, essentially represents the overhang of outstanding liabilities contracted at a high interest cost in the past.
State Finances: 2003-04
2.50 The States’ budgets for 2003-04 envisage continued efforts towards fiscal consolidation through augmentation of revenue and containment of expenditure. All major deficit indicators, viz., the gross fiscal deficit (GFD), revenue deficit and primary deficit, are budgeted lower in 2003-04 as compared with the revised estimates for 2002-03 (Table 2.26). The decline in GFD is mainly on account of expected improvement in the revenue account and net lending, which would more than compensate the increase in capital outlay.
2.51 In 2003-04, the aggregate (revenue and capital) receipts of States are budgeted higher. The States’ own revenue receipts (States’ own tax and non-tax) would contribute about 65 per cent of the total increase in revenue receipts, while the rest would be accounted by current transfers (States’ share in Central taxes and grants from the Centre). Consequently, the share of States’ own revenue in financing their total expenditure is expected to move up from 42 per cent in 2002-03 to 44 per cent in 2003-04. The decline in
Table 2.25: Combined Liabilities and Debt-GDP ratio
| Outstanding Liabilities | Debt to GDP ratio | |||||
| Year | Centre | States | Combined | Centre | States | Combined |
| (end-March) | (Rupees crore) | (in per cent) | ||||
| 1 | 2 | 3 | 4 | 5 | 6 | 7 |
| 1990-91 | 3,14,558 | 1,10,289 | 3,50,957 | 55.3 | 19.4 | 61.7 |
| 1996-97 | 6,75,676 | 2,43,525 | 7,73,629 | 49.4 | 17.8 | 56.5 |
| 2001-02 | 13,66,409 | 5,89,797 | 16,32,084 | 59.5 | 25.7 | 71.1 |
| 2002-03 RE | 15,61,876 | 6,94,289 | 18,66,626 | 63.2 | 28.1 | 75.5 |
| 2003-04 BE | 17,80,064 | 7,90,702 | 21,10,681 | 64.9 | 28.8 | 76.9 |
| RE Revised Estimates. | BE | Budget Estimates. | ||||
| Note: Data regarding States are provisional. | ||||||
RECENT ECONOMIC DEVELOPMENTS
Table 2.26: Major Deficit Indicators of State Governments
| (Rupees crore) | ||||||
| Item | 2000-01 | 2001-02 | 2002-03 (BE) | 2002-03 (RE) | 2003-04 (BE) | |
| 1 | 2 | 3 | 4 | 5 | 6 | |
| Gross Fiscal deficit | 89,532 | 95,986 | 1,02,882 | 1,16,730 | 1,08,861 | |
| (4.3) | (4.2) | (4.0) | (4.7) | (4.0) | ||
| Revenue Deficit | 53,569 | 59,233 | 48,314 | 61,302 | 49,008 | |
| (2.5) | (2.6) | (1.9) | (2.5) | (1.8) | ||
| Primary Deficit | 37,830 | 33,497 | 30,629 | 42,584 | 26,573 | |
| (1.8) | (1.5) | (1.2) | (1.7) | (1.0) | ||
| RE | Revised Estimates. | BE Budget Estimates. | ||||
| Note: Figures in brackets are per cent to GDP. | ||||||
capital receipts is expected mainly on account of the budgeted decline in recovery of loans and advances, market borrowings and reserve funds (Table 2.27).
2.52 Reflecting increased efforts by the State Governments to contain expenditure, the growth in budgeted aggregate expenditure has been moderate during 2003-04. Component-wise, the deceleration in expenditure is pronounced on the capital account. However, a continued deterioration in the expenditure pattern is noticed during recent years due to a higher growth in the non-developmental component vis-à-vis the developmental component. Consequently, the share of developmental expenditure in the total, which had declined in 2002-03, is budgeted to decline further to 54.8 per cent in 2003-04 (Table 2.28). Within non-developmental heads, interest and pension payments would together account for 28.8 per cent of the total revenue expenditure.
2.53 As per the budget estimates for 2003-04, the financing pattern of GFD indicates that the small savings receipts (special securities issued to NSSF)
would continue to contribute a major share. The shares of small savings receipts, loans from the Centre, and State provident funds in the financing of GFD is budgeted higher as compared with the revised estimates of the previous year (Table 2.29).
2.54 As a result of persistent fiscal deficits, the outstanding debt of the States is estimated to reach 28.8 per cent of the GDP by end-March 2004 from 28.1 per cent as at end-March 2003. The growing stock of States’ debt has brought into focus the issue of fiscal sustainability of States.
2.55 The likely fiscal outturn of the State Governments during the current year is not yet evident. During April-October 2003, on an annual average basis, the outstanding ways and means advances (WMA) and overdrafts (OD) from the Reserve Bank were at a lower level as compared with those prevailing during the same period of the previous year. The outstanding WMA and OD of State Governments, at Rs.5,876 crore as on January 2, 2004, was lower by 10.4 per cent than the level on
Table 2.27: Receipts and Expenditure of States
| Item | 2001-02 | 2002-03 | 2003-04 | Percentage | |
| (RE) | (BE) | (Col.4 over 3) | (Col.3 over 2) | ||
| 1 | 2 | 3 | 4 | 5 | 6 |
| Aggregate Receipts | 3,80,107 | 4,37,292 | 4,69,446 | 7.4 | 15.0 |
| (16.6) | (17.7) | (18.4) | |||
| Revenue Receipts | 2,55,599 | 2,93,873 | 3,32,919 | 13.3 | 15.0 |
| (11.1) | (11.9) | (13.0) | |||
| Capital Receipts | 1,24,507 | 1,43,419 | 1,36,527 | -4.8 | 15.2 |
| (5.4) | (5.8) | (5.3) | |||
| Total Expenditure | 3,77,554 | 4,42,609 | 4,76,039 | 7.6 | 17.2 |
| (16.4) | (17.9) | (18.6) | |||
| Revenue Expenditure | 3,14,833 | 3,55,175 | 3,81,927 | 7.5 | 12.8 |
| (13.7) | (14.4) | (14.9) | |||
| Capital Expenditure | 62,722 | 87,434 | 9,41,12 | 7.6 | 39.4 |
| (2.7) | (3.5) | (3.7) | |||
| Note: Figures in brackets are per cent to GDP. |
| BE | Budget Estimates. | ||
| RE Revised Estimates. | |||||
REPORT ON CURRENCY AND FINANCE
Table 2.28: Expenditure Pattern of State Governments
| Item | 2001-02 | 2002-03 | 2003-04 | |
| (RE) | (BE) | |||
| 1 | 2 | 3 | 4 | |
| 1. | Developmental | 2,16,629 | 2,47,873 | 2,60,977 |
| Expenditure | (57.4) | (56.0) | (54.8) | |
| 2. | Non-Developmental | 1,38,062 | 1,60,596 | 1,77,025 |
| Expenditure | (36.6) | (36.3) | (37.2) | |
| 3. | Others* | 22,863 | 34,140 | 38,037 |
| (6.1) | (7.7) | (8.0) | ||
| Total Expenditure | 3,77,554 | 4,42,609 | 4,76,039 | |
| (1+2+3) | (100.0) | (100.0) | (100.0) | |
| * Includes expenditure towards compensation and assignments to local bodies, grants-in-aid contribution, | ||||
| Note: Figures in brackets are per cent of total expenditure. | ||||
January 3, 2003 (Chart II.5). In 2002-03, 21 State Governments were in overdraft from the Reserve Bank. In the current fiscal year (up to December 1, 2003), 15 States have resorted to overdrafts from the Reserve Bank.
2.56 The States’ continued efforts towards fiscal consolidation include measures for revenue augmentation, expenditure containment and other institutional reforms like PSU restructuring and power sector reforms. On the revenue front, strengthening of tax efforts and rationalisation of user charges mainly relating to power, water and transport are under way. In view of the apprehensions expressed by a large number of States, the Union Budget for 2003-04 envisaged that the Central Government would compensate 100 per cent of the loss in the first year, 75 per cent of the loss in the second year and 50 per cent in the third year on account of the introduction of VAT by the States. The implementation of VAT has, however, been postponed subsequent to the Union Budget. On the expenditure front, a number of States have proposed to continue their efforts towards containment of revenue expenditure through restrictions on fresh recruitment/ creation of new posts and curbs on the increase in administrative expenditure. Some States have proposed introduction of a contributory pension scheme for their newly-recruited staff.
2.57 Several States have initiated measures to provide statutory backing to fiscal reforms through enabling legislation. The objective is to eliminate the revenue deficit and contain the fiscal deficit in the medium-term. The Central Government has also initiated measures to encourage medium-term fiscal reforms at the State level. The immediate concern about the current high level of debt has prompted the introduction of the debt-swap scheme on mutual agreement between the Central and the State Governments. Recognising the need to reduce the interest burden of the States, all loans from the Centre to the State Governments bearing coupons in excess of 13 per cent are to be swapped with market borrowings and small savings proceeds at prevailing interest rates over a period of three years ending in 2004-05.

Table 2.29: Financing of Gross Fiscal Deficit of State Governments
| Year | Loans from the | Market | Special securities | Small savings, | Others # | Gross Fiscal | |
| Centre | borrowings (net) | issued to NSSF | PF etc. | Deficit (2+3+4+5) | |||
| 1 | 2 | 3 | 4 | 5 | 6 | 7 | |
| 2001-02 | 9.5 | 17.7 | 39.5 | 10.6 | 22.7 | 100 | |
| 2002-03 (RE) | 7.0 | 19.9 | 42.7 | 9.2 | 21.2 | 100 | |
| 2003-04 (BE) | 10.7 | 12.4* | 46.3 | 9.7 | 21.0 | 100 | |
| RE Revised Estimates. | BE | Budget Estimates. | |||||
| # Include loans from FIs, reserve funds, deposits and advances, etc. | |||||||
| * Does not include the market borrowings for debt swap. | |||||||
RECENT ECONOMIC DEVELOPMENTS
2.58 With the power sector reforms gaining importance in recent years, 22 States have either constituted or notified the constitution of State Electricity Regulatory Commissions (SERCs) for determining tariff structure, 15 of which have issued tariff orders. Various other measures have also been undertaken - particularly unbundling of electricity boards into separate entities performing separate functions.
III. MONETARY AND CREDIT SITUATION
Monetary Conditions
2.59 The monetary policy stance of the Reserve Bank continued to be the provision of adequate liquidity to meet credit growth and support investment demand in the economy while continuing a vigil on movements in the price level. The Reserve Bank also proposed to continue with the prevailing stance of preference for a soft and flexible interest rate environment within the framework of macroeconomic stability. The monetary policy stance was reflected in cuts of 25 basis points in the Bank Rate to 6.0 per cent (April 29, 2003), 50 basis points in the repo rate to 4.5 per cent (August 25, 2003) and 25 basis points in the cash reserve ratio (CRR) to 4.5 per cent of the banks’ net demand and time liabilities (June 14, 2003).
2.60 The Mid-Term Review of the Monetary and Credit Policy stressed that monetary management and macroeconomic developments have been in conformity with the stance announced in the annual Monetary Policy Statement of April 2003. It, was, therefore, proposed to continue with the stance for the remaining half of the current year. However, taking into account the favourable progress of the monsoon and other macroeconomic developments during the first half of the year, the Reserve Bank revised the GDP growth projection to 6.5-7.0 per cent with an upward bias from around 6.0 per cent, and inflation projection to 4.0-4.5 per cent with a downward bias from 5.0-5.5 per cent. In January 2004, the Reserve Bank revised its growth projections further to around 7.0 per cent with a continued upward bias. As regards inflation, while the downward bias may not be attainable, the range of 4.0-4.5 per cent continues to be relevant for policy purposes unless there are unanticipated shocks. Consistent with the expected growth and inflation rates, the April 2003 statement placed expected M3 and non-food credit (including non-SLR investments) growth at 14.0 per cent and 15.5-16.0 per cent, respectively; these monetary and credit projections were retained in the Mid-Term Review. Several measures were announced to
improve the credit delivery mechanism, micro-credit delivery, money market development and supervision of banks and other financial institutions.
2.61 Monetary management in 2003-04, as in recent years, had to contend with persistent excess supplies in the foreign exchange market. The Reserve Bank, therefore, had to actively modulate discretionary liquidity through open market operations (OMO), including repo operations through the Liquidity Adjustment Facility (LAF), to steer monetary conditions in line with the desired objectives. In line with the policy preference for a soft and flexible interest rate environment, the interest rates in the money and government securities markets softened during the course of the financial year.
2.62 The monetary experience suggests that sustained excessive monetary expansion has often spilled over into inflation. While the increase in foreign exchange reserves reflects the growing investor confidence in the Indian economy and provides an insurance cover against adverse external shocks, there is also the need to mitigate the inflationary potential by counter-balancing the domestic and external sources of monetisation.
2.63 The scope of the Reserve Bank to conduct direct sterilisation operations is, by and large, circumscribed by its stock of Government paper, which could be sold outright or furnished as collateral in the LAF repo auctions. The Reserve Bank of India Act, 1934 does not allow the Reserve Bank to borrow clean beyond its paid-up capital of Rs.5 crore or pay interest on balances held by banks beyond the CRR prescribed by the central bank and also below the statutory minimum of 3.0 per cent of net demand and time liabilities. This constrains its ability to mop up surplus liquidity from the market by borrowing funds without a collateral on the lines of a deposit facility. The ability of the Reserve Bank to trade the surpluses of the external sector with the deficit of the Government account is also limited by the stock of Government securities in its books. As the Reserve Bank statutorily cannot pay interest on Government balances, the Government invests its surplus cash balances into Government securities held by the Reserve Bank, thereby reducing its stock available for OMO. The pressure of sudden large-scale inflows in most emerging market economies, including India, has led to a search for alternative strategies of sterilisation. Against the background of international experience with various instruments of sterilisation and application of available instruments within the existing financial and legal structure, the Reserve
REPORT ON CURRENCY AND FINANCE
Bank’s Working Group on Instruments of Sterilisation recommended a two-pronged approach of strengthening and refining the existing instruments and exploring new instruments appropriate in the Indian context (see Chapter VI).
2.64 The operating procedures of monetary policy have been changing rapidly in India, as in other emerging market economies, as channels of monetary policy transmission shift in the course of financial liberalisation. As part of the increasing market orientation of monetary policy, the Reserve Bank has gradually put in place a liquidity management framework in the form of a LAF not only to adjust the quantum of marginal liquidity but also to transmit signals regarding the price of liquidity. While the LAF has emerged as the principal instrument in the monetary policy operating framework of the Reserve Bank, its operation in the present form in conjunction with other supporting instruments has given rise to certain conceptual and operational issues which need to be addressed to enhance the efficacy of monetary operations (Box II.2). The Reserve Bank’s Internal Group on Liquidity Adjustment Facility reviewed LAF operations in a cross-country perspective, keeping in view recent developments in the financial markets as well as in technology. These were addressed in two parts, in terms of day-to-day liquidity management and in terms of sterilisation operations. While it is difficult to distinguish operationally between the sterilisation operations and liquidity management operations under LAF, the Group emphasised the need to conceptually distinguish surplus liquidity of a 'temporary' nature arising from banks’ cash management practices from surplus liquidity of a somewhat 'enduring' nature arising from sustained capital flows.
Reserve Money
2.65 Reserve money growth during the fiscal year 2003-04 (up to January 16, 2004) continued to be driven by the sustained accretion to the Reserve Bank’s foreign currency assets (Table 2.30). The expansionary effect on reserve money was, however, contained through sterilisation operations.
Box II.2
Internal Group on Liquidity Adjustment Facility
Recommendations Regarding Day-to-Day Liquidity Management:
• Pursuing the objective of conducting LAF operation on real-time basis, in the light of substantial technological developments.
• Introduction of a standing deposit facility, with enabling amendment of the Reserve Bank of India Act, 1934 to accord the Reserve Bank greater flexibility in its use of the repo facility with a view to achieving balanced development of various segments of the money market. Pending legislative amendments, the Reserve Bank could explore possibilities of modifying the current CRR provision to accommodate a standing deposit type facility -placement of deposits at the discretion of banks, unlike CRR, which is applicable to all banks irrespective of their liquidity position.
• Since the interest rate on standing deposit type facility is designed to provide a floor to the interest rate corridor, the remuneration of such deposits should be at a rate lower than the repo rate. The remuneration of eligible cash balances under CRR, if any, could be delinked from the Bank Rate and placed at a rate lower than the repo rate.
• Enlarging the minimum tenor of the LAF operations from overnight to seven days to be conducted on daily basis to enable balanced development of various segments of money market, with the flexibility to conduct overnight repo if the situation so warrants.
• Conducting fixed rate LAF auctions, to enhance the ability of the Reserve Bank to transmit policy signals to the market, with the flexibility to use the variable price auction format if the situation so warrants.
• Injecting liquidity at a single interest rate, i.e., the reverse repo rate set above the repo rate, thereby forming a ceiling to the corridor.
• Aligning of the Bank Rate to the reverse repo rate so that the entire liquidity support, including refinance, could be made available at the reverse repo rate/Bank Rate. In the recent period, with the economy remaining in surplus mode, the importance of the Bank
Rate seems to have reduced. However, while the Reserve Bank may continue to announce the Bank Rate independently, as at present, it should be aligned, under normal circumstances, to the reverse repo rate. If liquidity conditions shift to deficit mode on a more enduring basis, the reverse repo rate would be placed within the corridor. The interest rate on liquidity injection at the marginal lending facility in the nature of standing liquidity facility, in such a situation, would form the ceiling to the corridor. In such a scenario, the Bank Rate should, under normal circumstances, be aligned to the marginal lending rate (i.e., standing refinance rate). However, the standing deposit rate would continue to operate as the floor to the LAF corridor.
Shifting the timing of LAF to the middle of the day, say, 12 noon to ensure that marginal liquidity is kept in the system for a longer time in an environment of the real-time gross settlement (RTGS) system and low CRR before coming on to the Reserve Bank’s repo window once intra-day liquidity (IDL) is available under the RTGS system. To take care of unforeseen contingencies in mismatches, the Reserve Bank could consider discretionary announcement of timing of both repo auctions and reverse repo auctions at late hours.
Strengthening the Reserve Bank’s liquidity forecasting model to provide a more scientific basis to the decision making process for LAF operations.
Recommendations Regarding Sterilisation:
Additional instruments of sterilisation to be explored so as to reduce the liquidity pressure on the LAF window. The Group has proposed that as and when the RBI Act is amended, the standing deposit facility could provide an additional instrument of sterilisation. As proposed by the Reserve Bank’s Working Group on Instruments of Sterilisation, setting up of a Market Stabilisation Fund (MSF) could be useful as an option, which can be operationalised whenever considered necessary.
RECENT ECONOMIC DEVELOPMENTS
Table 2.30: Variations in Major Components and Sources of Reserve Money
|
| 2002-03 | 2003-04 | (up to | 2002-03 | 2003-04 | |||||
| Item | Jan. 16) | Q1 | Q2 | Q3 | Q4 | Q1 | Q2 | |||
| 1 | 2 | 3 | 4 | 5 | 6 | 7 | 8 | 9 | ||
| Reserve Money | ||||||||||
| 31,091 | 25,683 | -8,850 | 6,791 | 7,917 | 25,233 | 17,201 | -18,291 | 23,834 | ||
| (9.2) | (7.0) | |||||||||
| Components | ||||||||||
| 1. | Currency in circulation | 31,499 | 35,225 | 14,633 | -5,901 | 11,206 | 11,561 | 17,885 | -5,969 | 17,966 |
| (12.6) | (12.5) | |||||||||
| 2. | Bankers’ Deposits with RBI | -801 | -10,339 | -23,873 | 12,451 | -2,427 | 13,048 | -1,606 | -12,633 | 5,961 |
| 3. | ‘Other’ Deposits with the RBI | 393 | 798 | 389 | 241 | -861 | 624 | 921 | 310 | -92 |
| Sources | ||||||||||
| 1. | RBI’s net credit to Government Sector | -31,499 | -77,366 | -4,212 | -19,779 | -17,427 | 9,919 | -4,451 | -53,146 | -12,506 |
| Of which : to Central Government | -28,399 | -76,066 | 1,455 | -19,555 | -17,882 | 7,583 | 434 | -53,744 | -15,844 | |
| (-20.1) | (-67.3) | |||||||||
| 2. | RBI’s Credit to Banks and Commercial Sector | -6,468 | -4,887 | -6,537 | -784 | 8 | 844 | -1,564 | -2,525 | -796 |
| 3. | NFEA of RBI | 94,275 | 1,10,501 | 19,279 | 19,619 | 34,766 | 20,611 | 22,710 | 25,720 | 51,931 |
| (35.7) | (30.8) | |||||||||
| 4. | Government’s Net Currency Liabilities to the Public | 705 | 169 | 168 | 256 | 157 | 124 | 87 | 60 | 23 |
| 5. | Net Non-Monetary Liabilities of RBI | 25,922 | 2,734 | 17,548 | -7,479 | 9,587 | 6,265 | -419 | -11,600 | 14,818 |
| Memo: | ||||||||||
| 1. | Net Domestic Assets | -63,184 | -84,818 | -28,130 | -12,828 | -26,849 | 4,623 | -5,509 | -44,011 | -28,097 |
| 2. | FCA, adjusted for revaluation | 82,090 | 1,03,573 | 8,145 | 22,881 | 31,060 | 20,004 | 23,943 | 31,832 | 37,560 |
| 3. | NFEA/Reserve Money (per cent) (end-period) | 97.1 | 118.7 | 86.1 | 90.2 | 98.2 | 97.1 | 98.6 | 110.5 | 117.0 |
|
| FCA : Foreign Currency Assets. | |||||||||
| NFEA : Net Foreign Exchange Assets. | ||||||||||
| Note: Data based on March 31 for Q4 and last reporting Friday for all other quarters. | ||||||||||
| Figures in brackets are percentage variations during the year. | ||||||||||
2.66 The sterilisation operations in the form of open market sales of government securities and repo operations offset the primary liquidity emanating from the Reserve Bank’s primary subscriptions (Rs.14,500 crore). Consequently, the Reserve Bank’s net credit to the Centre declined sharply (Table 2.31). Reflecting the scale effect of CRR cuts and the substitution effect of large-scale capital flows, the share of net foreign assets in reserve money has increased dramatically to 119 per cent by January 16, 2004 from less than 10 per cent as at end-March 1990.
2.67 Besides the conventional open market operations, the Reserve Bank continued to appropriately supplement its ability to absorb excess liquidity emanating from sustained capital flows by various means:
As a temporary measure, the notified amount for 91-day Treasury Bills was raised to Rs.1,500 crore for eight auctions between August 6, 2003 and September 24, 2003 but brought back to Rs.500 crore from October 1, 2003.
With a view to sustaining liquidity management amidst the steady reduction in the stock of Government securities, the Government of India converted the entire stock of Government of India Treasury Bills (Conversion) Special Securities held by the Reserve Bank (Rs.61,818 crore) into marketable securities on private placement basis.
Acquisition of Government paper by funding prepayment of the Government’s external debt.
Monetary Survey
2.68 Broad money (M3) growth declared during 2003-04 (up to January 9, 2004), remaining within the trajectory of 14.0 per cent indicated in the monetary and credit policy (Table 2.32). The lower M3 growth account of a declaration in banks’ time deposits. Apart from the effect of redemption of Resurgent India Bonds (RIBs), there was a slowdown in domestic time deposit accretion reflecting moderation in deposit rates by banks. Relative rigidity of the interest rates on small savings has also made financial savings in small savings and Government
REPORT ON CURRENCY AND FINANCE
Table 2.31: Variation in Net Reserve Bank Credit to the Centre
| Variable | 2002-03 | 2002-03 | 2003-04 | ||||||||
| Q1 | Q2 | Q3 | Q4 | Q1 | Q2 | Q3 | |||||
| 1 | 2 | 3 | 4 | 5 | 6 | 7 | 8 | 9 | |||
| Net Reserve Bank Credit to the Centre (1+2+3+4-5) | -28,400 | 1,455 | -19,555 | -17,882 | 7,582 | 435 | -53,744 | -15,845 | |||
| 1. | Loans and Advances | -5,176 | 2,472 | -7,648 | 0 | 0 | 8,145 | -8,145 | 0 | ||
| 2. | Treasury Bills held by the Reserve Bank | -15 | -18 | 0 | 0 | 3 | -3 | 0 | 0 | ||
| 3. | Reserve Bank’s Holdings of Dated Securities | -24,731 | -6,107 | -11,761 | -17,979 | 11,116 | -11,300 | -45,530 | -15,795 | ||
| 4. | Reserve Bank’s Holdings of Rupee Coins | -92 | 64 | -146 | 97 | -106 | 163 | -69 | -51 | ||
| 5. | Central Government Deposits | -1,614 | -5,044 | 0 | 0 | 3,431 | -3,430 | 0 | 0 | ||
| Memo Items* | |||||||||||
| 1. | Market Borrowings of Dated Securities by the Centre # | 1,25,000 | 49,000 | 35,000 | 23,000 | 18,000 | 44,000 | 36,000 | 15,000 | ||
| 2. | Reserve Bank’s Primary Subscription to Dated Securities | 36,175 | 22,018 | 1,157 | 0 | 13,000 | 5,000 | 0 | 0 | ||
| 3. | Repos (-) / Reverse Repos (+) (LAF), net position £ | 1,940 | -20,355 | 8,845 | 10,371 | 3,079 | -25,052 | 1,557 | -3,580 | ||
| 4. | Net Open Market Sales # | 53,781 | 7,020 | 19,918 | 15,693 | 11,150 | 5,620 | 16,671 | 14,225 | ||
| 5. | Primary Operations $ | 23,616 | 29,598 | -8,642 | -12,527 | 15,187 | 25,643 | -32,609 | 2,304 | ||
| * | At face value. | # | Excludes Treasury Bills. | £ Includes fortnightly repos. | |||||||
| $ | Adjusted for Centre’s surplus investment. | ||||||||||
| Quarterly variations are based on March 31 for Q4 and last reporting Fridays for other quarters. | |||||||||||
of India Relief Bonds more attractive than fixed deposits. Besides, the lower interest rates on fixed deposits have also resulted in lower interest accruals (included under time deposits). Currency demand recorded an increase commensurate with the recovery in agricultural activity.
Table 2.32: Monetary Indicators
| Variable | Outstanding as on | Year-on-year | |||||
| March 31, 2003 | 2003 | 2004 | |||||
| (As on January 10) | (As on January 9) | ||||||
| Absolute | Per cent | Absolute | Per cent | ||||
| 1 | 2 | 3 | 4 | 5 | 6 | ||
| I. | Reserve Money* | 3,69,061 | 33,893 | 10.8 | 47,826 | 13.8 | |
| II. | Broad Money (M3) | 16,95,551 | 2,02,262 | 13.9 | 2,27,825 | 13.5 | |
| a) | Currency with the Public | 2,70,983 | 31,276 | 13.3 | 38,952 | 14.6 | |
| b) | Aggregate Deposits | 14,21,326 | 1,70,674 | 14.0 | 1,87,605 | 13.2 | |
| i) Demand Deposits | 1,98,602 | 19,567 | 11.9 | 39,072 | 21.2 | ||
| ii) Time Deposits | 12,22,725 | 1,51,108 | 14.3 | 1,48,533 | 12.0 | ||
| Of which: Non-Resident Foreign | 92,271 | 3,568 | 4.0 | -19,697 | -21.1 | ||
| III. | NM | 3 | 16,15,205 | 1,96,731 | 14.7 | 2,35,779 | 15.3 |
| IV. | a) | L1 | 16,70,480 | 2,06,336 | 15.0 | 2,50,197 | 15.8 |
| Of which: Postal Deposits | 55,275 | 9,605 | 24.2 | 14,418 | 29.3 | ||
| b) | L2 | 16,76,776 | 2,01,957 | 14.5 | 2,50,524 | 15.7 | |
| Of which: FI Deposits | 6,296 | -4,379 | -42.2 | 327 | 5.5 | ||
| c) | L3 | 16,96,349 | 2,02,629 | 14.4 | 2,51,816 | 15.6 | |
| Of which: NBFC Deposits | 19,573 | 672 | 3.7 | 1,292 | 6.9 | ||
| V. | Major Sources of Broad Money | ||||||
| a) | Net Bank Credit to the Government (i+ii) | 6,78,059 | 67,435 | 11.6 | 73,389 | 11.3 | |
| i) Net Reserve Bank Credit to | 1,20,679 | -31,548 | -20.8 | -72,049 | -59.9 | ||
| Of which: to the Centre | 1,12,985 | -30,694 | -21.4 | -72,611 | -64.2 | ||
| ii) Other Banks’ Credit to Government | 5,57,379 | 98,983 | 23.0 | 1,45,437 | 27.4 | ||
| b) | Bank Credit to Commercial Sector | 8,62,068 | 87,529 | 11.9 | 1,08,134 | 12.5 | |
| Of which: Scheduled Commercial Banks’ | |||||||
| Non-food Credit | 6,35,192 | 86,401 | 16.8 | 1,10,047 | 17.1 | ||
| c) | Net Foreign Exchange Assets of | 3,93,715 | 95,632 | 33.3 | 1,22,151 | 31.9 | |
| Data provisional. FI : Financial Institutions; | NBFC : Non-Banking Financial Companies. | ||||||
| * Variations pertain to January 16, 2004 and corresponding period of previous year. | |||||||
| Note: | M3, NM3, L1, L2, L3 and deposits are adjusted for the full impact of mergers while credit is adjusted for the initial impact of mergers during 2002-03. | ||||||
| For items III, IVa, IVb and non-resident foreign currency deposits, variation figures pertain to October while that for item IVc pertain to September. | |||||||
RECENT ECONOMIC DEVELOPMENTS
Bank Credit
2.69 Bank credit to the commercial sector has shown signs of pick up since August 2003. Non-food credit growth recorded a larger expansion on a year-on-year basis (Table 2.32). Food credit contracted reflecting a further decline in food stocks (Table 2.33).
2.70 Housing credit has emerged as an important driver of credit growth benefiting from tax incentives as well as softening of interest rates, increasing by 222 per cent since end-March 2000. Credit to the priority sector has revived with a substantial increase in the advances to ‘other priority sectors’ (Table 2.34). Over the years, the definition of ‘other priority sectors’ has been widened in consonance with the coverage of priority sectors. The latest disaggregated data on this category, pertaining to 2002-03, reveal that the bulk of the higher off-take under ‘other priority sectors’ emanated from housing loans up to Rs.10 lakh in rural and semi-urban areas. Credit to industry, however, recorded a decline during April to November 2003 although it has started picking up in recent months. The decline in credit to industry was mainly on account of industries such as petroleum, fertilisers, coal, iron and steel, cotton textiles and cement. On the other hand, industries such as infrastructure, electricity and gems and jewellery recorded an increase in credit. The decline in overall credit to industry during April to November 2003 can be attributed to, inter alia, an increased recourse by corporates to internal sources of financing enabled by higher profits as well as higher external commercial borrowings (ECBs).
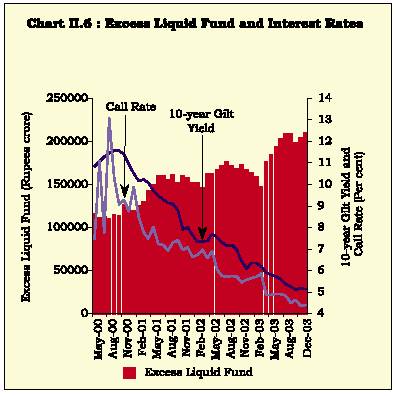
2.71 In the face of increased capital flows, commercial banks’ holding of government and other approved securities increased sharply during the year.
As a result, scheduled commercial banks’ holding of government and other approved securities – much higher than the prescribed Statutory Liquidity Ratio (SLR) of 25.0 per cent – increased even further during 2003-04, reaching 41.4 per cent by end-December 2003. The increase in the excess liquid funds of the commercial banks, i.e., the resources still available after meeting statutory pre-emptions and credit off-take, flowing into the government securities market contributed to the reduction of the secondary market yields of Government securities across the spectrum (Chart II.6).
Priority Sector Lending
2.72 In continuation of several initiatives taken, and keeping in view the recent developments in credit flows to different sectors, certain specific measures with respect to the priority sector announced in the November 2003 Mid-Term Review were:
Depending on the good track record and financial position of the SSI units, banks may increase the loan amount from Rs.15 lakh up to Rs.25 lakh (with the approval of their Boards) for dispensation of the collateral requirement.
The interest rate on the deposits of foreign banks placed with SIDBI towards their priority sector shortfall will be at the Bank Rate.
SIDBI would take appropriate steps to ensure that the priority sector funds are used expeditiously and benefits of reductions in interest rates are passed on to the borrowers.
All new loans granted by banks to NBFCs for the purpose of on-lending to the SSI sector would also be reckoned under priority sector lending.
Table 2.33: Select Banking Indicators: Financial Year Variations
| Item | 2001-02 | 2002-03 | 2002-03 | 2003-04* | ||||
| Absolute | Per cent | Absolute | Per cent | Absolute | Per cent | Absolute | Per cent | |
| 1 | 2 | 3 | 4 | 5 | 6 | 7 | 8 | 9 |
| Aggregate Deposits | 1,40,742 | 14.6 | 1,47,822 | 13.4 | 1,27,857 | 11.6 | 1,56,539 | 12.2 |
| Demand Deposits | 10,496 | 7.4 | 17,241 | 11.3 | 5,799 | 3.8 | 25,073 | 14.7 |
| Time Deposits | 1,30,246 | 15.9 | 1,30,581 | 13.7 | 1,22,058 | 12.8 | 1,31,466 | 11.8 |
| Bank Credit | 78,289 | 15.3 | 94,949 | 16.1 | 61,281 | 10.4 | 62,774 | 8.6 |
| Food Credit | 13,987 | 35.0 | -4,499 | -8.3 | -3,836 | -7.1 | -12,943 | -26.2 |
| Non-food Credit | 64,302 | 13.6 | 99,448 | 18.6 | 65,117 | 12.2 | 75,717 | 11.1 |
| Investments | 68,110 | 18.4 | 1,09,276 | 24.9 | 85,555 | 19.5 | 1,10,323 | 20.1 |
| Government Securities | 71,141 | 20.9 | 1,12,241 | 27.3 | 88,309 | 21.5 | 1,07,392 | 20.5 |
| Other Approved Securities | -3,032 | -10.1 | -2,964 | -10.9 | -2,754 | -10.2 | 2,931 | 12.1 |
| * Data provisional. | ||||||||
| Note: Deposits are adjusted for the full impact of mergers while credit is adjusted for the initial impact of mergers during 2002-03. | ||||||||
REPORT ON CURRENCY AND FINANCE
Table 2.34: Sectoral and Industry-wise Deployment of Gross Bank Credit of Scheduled Commercial Banks
| Item | Outstanding | Variation | |||||
| as at end- | 2002-03 | 2003-04 | |||||
| November 2003 | Absolute | Per cent | Absolute | Per cent | |||
| 1 | 2 | 3 | 4 | 5 | 6 | ||
| Priority sector # | 2,36,117 | 7,132 | 4.1 | 24,508 | 11.6 | ||
| of which : Agriculture | 79,641 | 4,980 | 8.2 | 6,123 | 8.3 | ||
| Small Scale | 61,017 | -139 | -0.2 | 623 | 1.0 | ||
| Others | 95,115 | 2,291 | 4.0 | 17,418 | 22.4 | ||
| Industry (Medium and Large) | 2,33,075 | 16,505 | 9.6 | -2,093 | -0.9 | ||
| Housing | 45,466 | 6,802 | 30.4 | 8,879 | 24.3 | ||
| Wholesale Trade | 22,667 | 672 | 3.3 | 89 | 0.4 | ||
| Rest of the sectors | 1,25,382 | 9,574 | 10.4 | 11,269 | 9.9 | ||
| Non-food Gross Bank Credit | 6,62,707 | 40,685 | 8.4 | 42,652 | 6.9 | ||
| Memo Items | |||||||
| (i) Export Credit | 52,112 | 328 | 0.8 | 2,910 | 5.9 | ||
| (ii) Credit to Industry (Small, Medium and Large) | |||||||
| Petroleum | 11,460 | 170 | 1.5 | -3,283 | -22.3 | ||
| Infrastructure | 30,315 | 3,135 | 21.2 | 4,018 | 15.3 | ||
| Cement | 6,126 | 604 | 14.3 | -305 | -4.7 | ||
| Cotton Textiles | 15,379 | 1,131 | 9.6 | -383 | -2.4 | ||
| Iron and Steel | 25,933 | 1,254 | 6.3 | -2,132 | -7.6 | ||
| Electricity | 12,601 | 221 | 2.4 | 1,428 | 12.8 | ||
| Engineering | 26,140 | -790 | -3.3 | -132 | -0.5 | ||
| Fertilisers | 5,807 | 329 | 6.0 | -1,116 | -16.1 | ||
| Computer Software | 2,809 | 314 | 18.9 | 198 | 7.6 | ||
| Gems and Jewellery | 8,956 | 1,090 | 16.9 | 1,423 | 18.9 | ||
# Excluding investments in eligible securities. $ Data adjusted for mergers since May 2002.
Note : Data are provisional and relate to select scheduled commercial banks which account for about 90 per cent of bank credit of all scheduled commercial banks.
Micro-Credit Delivery
2.73 Several steps were also taken in respect of micro credit, based on the recommendations of the informal groups constituted to examine micro-finance delivery. The measures included in the Mid-Term Review were:
Banks should provide adequate incentives to their branches in financing self-help groups (SHGs) and establish linkages with them. The procedures be made simple and easy while providing total flexibility to suit local conditions.
The group dynamics of working of the SHGs should be left to themselves and need neither be regulated nor formal structures imposed or insisted upon.
There should be a hassle-free approach to micro-financing of SHGs including financing of consumption expenditures.
NABARD would reinforce its commitment to maintaining and enhancing the flow to micro-finance while simplifying the process.
NABARD would also devise mechanisms for experience sharing among bank branches actively involved in extending micro-finance.
RECENT ECONOMIC DEVELOPMENTS
Price Situation
2.74 The global inflation environment remains stable (Table 2.35). In the US, the fear of an unwelcome fall in inflation has diminished with the inflation risk viewed as balanced. Headline consumer price inflation (CPI) fell to 1.8 per cent in November 2003 from 2.0 per cent in October 2003 due to an accelerated decline in goods prices in face of a steady rise in services’ prices, which is entirely holding up inflation. In the Euro area, inflation is expected to remain around the ECB target of close to two per cent, as appreciation of the euro and cyclical recovery in productivity are expected to dampen inflationary pressures from higher oil prices, unprocessed food prices, as well as planned increases in indirect taxes and administered prices. In the UK, the broad-based recovery is expected to increase underlying inflationary pressures. In Japan, deflationary pressures continue to persist. In China, consumer prices increased mainly due to food and farm products prices; prices of most manufactured products are still falling. Hong Kong and Taiwan continue to experience declining prices while in Singapore, inflation is below one per cent.
2.75 Inflation in India has generally remained benign during 2003-04 so far (Chart II.7). Inflation trends in the last two months have not been unexpected but the magnitude of price rise has been above the original expectations. As noted earlier, in the normal course, it is expected that the inflation rate would fall during the period mid-January to March 2004. While the downward bias in the Mid-Term Review may not be attainable, the range of 4.0-4.5 per cent for inflation by end-March 2004 continues to be relevant for monetary policy making, unless there are unanticipated shocks.
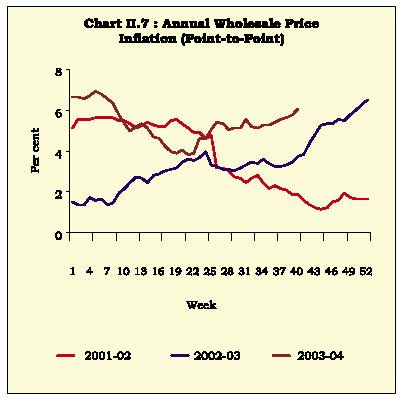
2.76 Inflation measured as annual year-on-year (y-o-y) variations in the wholesale price index (WPI) peaked at 6.9 per cent in the first week of May 2003. This resulted from the upward revision in electricity prices and supply disruptions due to the transporters’ strike in April, more than offsetting the effect of fortnightly downward revisions in POL prices beginning April 16, 2003. Inflation ebbed thereafter up to August 23, 2003 driven by a decline in the prices of mineral oil, oil seeds, oilcakes, fruits and cement which more than offset inflationary pressures from iron and steel prices, vegetable prices and hike in administered coal prices. In the subsequent weeks, increases in prices of domestic mineral oil (following continued hardening of international crude prices), electricity, fruits, oil seeds and textiles pushed inflation up to 6.1 per cent by January 3, 2004 (Chart II.8).
Table 2.35: Annual Consumer Price Inflation
| Country/Area | 1995 | 1996 | 1997 | 1998 | 1999 | 2000 | 2001 | 2002 | 2003 P |
| 1 | 2 | 3 | 4 | 5 | 6 | 7 | 8 | 9 | 10 |
| Advanced Economies | 2.6 | 2.4 | 2.1 | 1.5 | 1.4 | 2.2 | 2.2 | 1.5 | 1.8 |
| United States | 2.8 | 2.9 | 2.3 | 1.5 | 2.2 | 3.4 | 2.8 | 1.6 | 2.1 |
| Japan | -0.1 | 0.0 | 1.7 | 0.6 | -0.3 | -0.9 | -0.7 | -0.9 | -0.3 |
| Euro Area | 2.7 | 2.2 | 1.6 | 1.1 | 1.1 | 2.1 | 2.4 | 2.3 | 2.0 |
| Developing Countries | 23.3 | 15.3 | 9.9 | 10.4 | 6.5 | 5.8 | 5.8 | 5.3 | 5.9 |
| Developing Asia | 13.2 | 8.2 | 4.8 | 7.7 | 2.5 | 1.8 | 2.7 | 2.0 | 2.5 |
| China | 17.1 | 8.3 | 2.8 | -0.8 | -1.4 | 0.4 | 0.7 | -0.8 | 0.8 |
| India | 10.2 | 9.0 | 7.2 | 13.2 | 4.7 | 4.0 | 3.8 | 4.3 | 4.0 |
| P : IMF Projections. | |||||||||
| Note : Data are on a calendar year basis. | |||||||||
| Source : World Economic Outlook, IMF, September 2003. | |||||||||
REPORT ON CURRENCY AND FINANCE
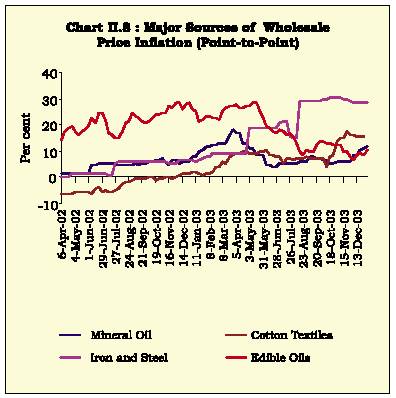
2.77 The major sources of y-o-y inflation have been few items such as iron and steel, mineral oils, electricity, oilseeds and edible oils, vegetables, raw cotton and cotton textiles; these explain more than 70 per cent of the y-o-y inflation. Firming of iron and steel prices, in line with international price movements, is attributed to increased domestic as well as foreign demand (largely from China) in the face of domestic production approaching its potential. Edible oils inflation reflects the impact of the last year’s drought - the prices have been broadly stable since mid-May 2003 on an expected rebound in domestic production of oilseeds. Higher raw cotton prices were due to weak domestic crop in the last season as well as low global stocks; prices have though largely stabilised since end-July on expectations of a better crop. On the whole, manufactured products group contributed 52.5 per cent to the y-o-y inflation as on January 3, 2004 as compared with 53.3 per cent during the corresponding period last year (Table 2.36).
Table 2.36: Annual Point-to-Point WPI Inflation by Component (Base 1993-94=100)
| Group/ Item | Annual Variation | Weighted | |||||||
| Weight | 2000-01 | 2001-02 | 2002-03 | 2003-04 | 2002-03 | 2003-04 | |||
| (Jan. 3, 2004) | (Jan. 3, 2004) | ||||||||
| 1 | 2 | 3 | 4 | 5 | 6 | 7 | 8 | ||
| All Commodities | 100.0 | 4.9 | 1.6 | 6.5 | 6.1 | 100.0 | 100 | ||
| A. | Primary Articles | 22.0 | -0.4 | 3.9 | 6.1 | 4.8 | 21.6 | 17.9 | |
| i) Cereals | 4.4 | -5.5 | 0.8 | 4.0 | 0.2 | 2.9 | 0.1 | ||
| ii) Pulses | 0.6 | 7.1 | -3.3 | 0.3 | 2.5 | 0.0 | 0.3 | ||
| iii) Fruits and Vegetables |
| 2.9 | -2.9 | 14.4 | -1.2 | 11.4 | -0.6 | 5.5 | |
| iv) Raw Cotton |
| 1.4 | 7.8 | -21.3 | 34.3 | 27.1 | 5.4 | 5.3 | |
| v) Oilseeds |
| 2.7 | 2.8 | 6.8 | 30.0 | 11.5 | 10.6 | 4.9 | |
| vi) Sugarcane |
| 1.3 | 10.5 | 6.2 | 11.5 | 0.0 | 2.8 | 0.0 | |
| B. | Fuel, Power, Light and Lubricants | 14.2 | 15.0 |
3.9 |
10.8 |
8.7 |
33.9 |
29.1 |
|
|
i) Mineral Oil |
|
7.0 |
17.0 |
1.2 |
18.4 |
11.9 |
29.7 |
21.0 |
|
|
ii) Electricity |
|
5.5 |
11.5 |
9.2 |
3.4 |
4.1 |
4.2 |
5.3 |
|
|
iii) Coal Mining |
|
1.8 |
18.1 |
-1.9 |
0 |
9.2 |
0 |
2.9 |
|
|
C. |
Manufactured Products |
63.7 |
3.8 |
0.0 |
5.1 |
5.6 |
44.3 |
52.5 |
|
|
i) Sugar |
|
3.6 |
-0.9 |
-3.8 |
-15.0 |
7.1 |
-7.0 |
2.9 |
|
|
ii) Edible Oils |
|
2.8 |
-4.8 |
12.5 |
27.4 |
10.4 |
8.5 |
4.1 |
|
|
iii) Oil Cakes |
|
1.4 |
0.4 |
14.3 |
40.3 |
-4.4 |
8.8 |
-1.3 |
|
|
iv) Cotton Textiles |
|
4.2 |
6.3 |
-6.7 |
8.3 |
14.9 |
4.8 |
9.3 |
|
|
v) Man-made Fibre |
|
4.4 |
1.7 |
-5.0 |
17.4 |
2.8 |
5.8 |
1.1 |
|
|
vi) Fertilisers |
|
3.7 |
3.4 |
3.6 |
2.1 |
0.1 |
1.2 |
0.1 |
|
|
vii) Iron and Steel |
|
3.6 |
1.3 |
0.0 |
9.2 |
28.6 |
4.4 |
15.0 |
|
|
viii) Cement |
|
1.7 |
20.3 |
-4.7 |
1.1 |
2.3 |
0.3 |
0.6 |
|
|
ix) Non-electrical Machinery |
|
3.4 |
6.9 |
5.4 |
2.5 |
2.4 |
1.2 |
1.3 |
|
|
x) Electrical Machinery |
|
5.0 |
11.8 |
-1.1 |
-1.3 |
0.5 |
-0.7 |
0.3 |
|
|
xi) Transport Equipment and Parts |
|
4.3 |
5.8 |
1.3 |
-0.9 |
0.3 |
-0.6 |
0.2 |
|
RECENT ECONOMIC DEVELOPMENTS
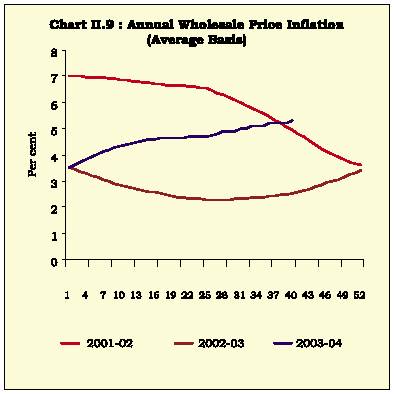
2.78 Average inflation, measured as annual percentage variation in the average wholesale price index, was 5.3 per cent on January 3, 2004 as compared with 2.5 per cent a year back (Chart II.9).
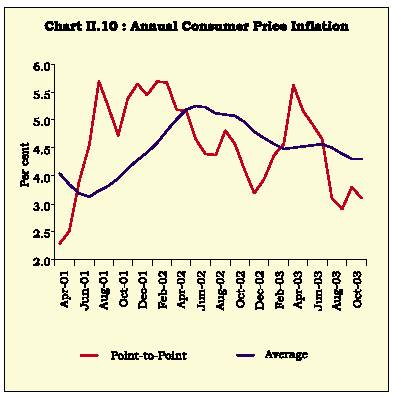
2.79 At the retail level, y-o-y consumer price inflation, as measured by the annual variation in the consumer price index for industrial workers (CPI-IW), decelerated to 3.1 per cent in November 2003 from 3.6 per cent in November 2002. On an annual average basis also, it stood lower at 3.8 per cent as against 4.5 per cent a year ago (Chart II.10).
IV. FINANCIAL MARKETS Money Market
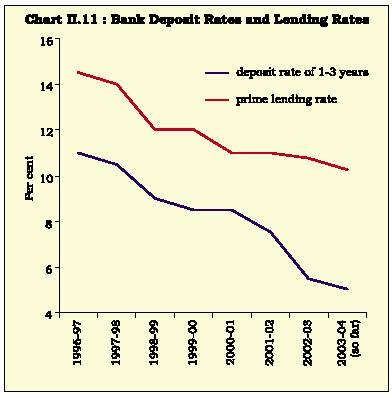
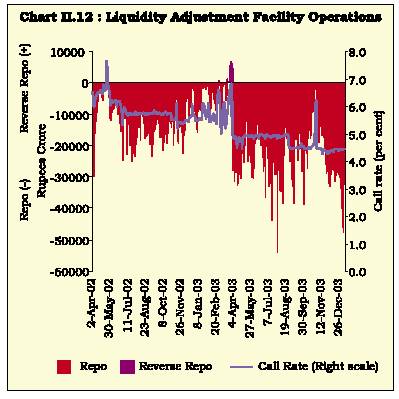
2.80 Money markets were characterised by ample liquidity during 2002-03 and the current financial year so far. This reflected sustained accretions of capital inflows, contraction in food credit, liquidity overhang, as also easing of monetary conditions. Banks were consequently able to fund the increased credit demand emanating from industrial revival without impinging on interest rates (Chart II.11). The Reserve Bank continued to appropriately manage liquidity conditions through open market (including the LAF) operations (OMOs) and facilitated the orderly behaviour of money markets (Chart II.12). Mirroring the comfortable liquidity conditions, the interest rates softened across the various segments of the money market (Table 2.37).
2.81 The orderly behaviour of money markets facilitated the smooth progress of further reforms in the money market. The aim of developing a proper short-term rupee yield curve has been pursued in recent years by calibrating a switch of the market participants away from uncollateralised overnight call/ notice money markets to other money market segments. The money market reform process continued to adopt a multi-pronged approach:
The move towards a pure inter-bank call/notice money market was accelerated by reducing the lending limit of non-bank participants further by 10 percentage points to 75 per cent of their average daily call/ notice money market lendings
REPORT ON CURRENCY AND FINANCE
of 2000-01 effective the fortnight beginning June 14, 2003. The purpose of this was to facilitate further deepening of the repo and term money markets. Subsequently, with effect from December 27, 2003, non-banks’ access to call/ notice money market was reduced by another 15 percentage points to 60 per cent of their average daily call/notice money lending during 2000-01. Primary dealers (PDs) would be allowed to borrow, on average, in a reporting fortnight, up to 200 per cent of their net owned funds as at end-March of the preceding financial year with effect from February 7, 2004.
Measures were undertaken to make other money market instruments freely accessible to non-bank participants.
With the operationalisation of the LAF, the collateralised lending facility (CLF) was phased out by October 5, 2002 and the standing facility was
Table 2.37: Money, Gilt, Foreign Exchange and Equity Markets: Select Indicators
|
Month |
Average |
Average |
Turnover |
Average |
Average |
RBI’s |
Forward |
Net |
Average |
Average |
Average |
Average |
Average |
Average |
|
Daily |
Call |
in Govt. |
Daily |
Exchange |
net |
premia |
OMO |
Daily |
Daily |
Daily |
Daily |
BSE |
S & P |
|
|
Call |
Rates |
Securities |
Inter- |
Rate |
Foreign |
3-month |
Sales(-) |
Repos |
Reverse |
BSE |
NSE |
Sensex |
CNX |
|
|
Money |
(Per |
(Rs. |
bank |
(Rs. per |
Currency |
(Per |
Purcha- |
(LAF) |
Repos |
Turnover |
Turn- |
Nifty |
||
|
Turnover |
cent) |
crore)* |
Turnover |
US $) |
Sales (-)/ |
cent) |
ses (+) |
Outstan- |
(LAF) |
(Rs. |
over |
|||
|
(Rs. |
(US $ |
Purch- |
(Rs. |
ding |
Outstan- |
crore) |
(Rs. |
|||||||
|
crore) |
million) |
ases(+) |
crore) |
(Rs. |
ding |
crore) |
||||||||
|
(US $ |
crore) |
(Rs. |
||||||||||||
|
million) |
crore) |
|||||||||||||
|
1 |
2 |
3 |
4 |
5 |
6 |
7 |
8 |
9 |
10 |
11 |
12 |
13 |
14 |
15 |
|
2002-03 |
||||||||||||||
|
April |
41,616 |
6.58 |
1,93,091 |
6,541 |
48.92 |
477 |
6.12 |
-5,307 |
8,119 |
1,322 |
1,312 |
2,424 |
3435 |
1121 |
|
May |
39,326 |
6.90 |
1,20,173 |
4,966 |
49.00 |
86 |
6.23 |
-1,525 |
1,924 |
17 |
1,279 |
2,499 |
3303 |
1080 |
|
June |
28,905 |
6.04 |
1,16,846 |
4,836 |
48.97 |
241 |
5.37 |
-189 |
10,420 |
0 |
1,166 |
2,212 |
3257 |
1066 |
|
July |
32,386 |
5.75 |
2,35,586 |
4,922 |
48.76 |
1,829 |
4.40 |
-6,538 |
17,092 |
0 |
1,162 |
2,235 |
3215 |
1035 |
|
August |
32,269 |
5.72 |
2,44,717 |
4,564 |
48.59 |
1,179 |
4.09 |
-7,025 |
19,046 |
0 |
1,132 |
2,196 |
3053 |
978 |
|
September |
28,883 |
5.75 |
1,70,345 |
4,429 |
48.44 |
965 |
3.94 |
-6,355 |
19,483 |
0 |
1,221 |
2,325 |
3086 |
987 |
|
October |
30,469 |
5.73 |
2,48,038 |
4,156 |
48.37 |
1,171 |
3.81 |
-71 |
20,653 |
0 |
1,316 |
2,472 |
2950 |
955 |
|
November |
25,821 |
5.45 |
3,34,605 |
5,093 |
48.25 |
2,115 |
3.66 |
-11,073 |
13,859 |
2 |
1,367 |
2,703 |
3058 |
992 |
|
December |
24,305 |
5.58 |
2,95,943 |
5,054 |
48.14 |
1,679 |
3.32 |
-4,548 |
10,911 |
0 |
1,456 |
2,951 |
3316 |
1074 |
|
January |
24,034 |
5.66 |
3,55,821 |
4,941 |
47.93 |
1,785 |
3.42 |
-10,996 |
6,325 |
13 |
1,343 |
2,816 |
3328 |
1073 |
|
February |
20,682 |
5.71 |
1,39,689 |
5,205 |
47.73 |
2,335 |
3.55 |
-88 |
4,259 |
45 |
1,235 |
2,542 |
3279 |
1056 |
|
March |
24,357 |
5.86 |
1,31,947 |
5,542 |
47.64 |
1,849 |
3.60 |
-66 |
2,265 |
1,570 |
1,013 |
2,158 |
3156 |
1016 |
|
2003-04 |
||||||||||||||
|
April |
17,338 |
4.87 |
2,26,803 |
5,585 |
47.38 |
1,432 |
2.08 |
-7 |
27,372 |
109 |
1,041 |
2,449 |
3037 |
965 |
|
May |
18,725 |
4.87 |
2,99,933 |
5,960 |
47.08 |
2,342 |
1.10 |
-5,569 |
25,223 |
10 |
1,072 |
2,604 |
3033 |
963 |
|
June |
20,544 |
4.91 |
3,00,504 |
5,837 |
46.71 |
896 |
2.76 |
-44 |
24,805 |
0 |
1,187 |
2,933 |
3387 |
1069 |
|
July |
18,698 |
4.90 |
3,04,587 |
5,920 |
46.23 |
3,146 |
2.65 |
-57 |
42,690 |
39 |
1,434 |
3,429 |
3665 |
1150 |
|
August |
19,556 |
4.83 |
4,09,539 |
5,983 |
45.93 |
2,352 |
2.25 |
-11,546 |
39,995 |
0 |
1,817 |
4,267 |
3978 |
1261 |
|
September |
20,584 |
4.50 |
2,65,848 |
6,862 |
45.85 |
2,345 |
0.91 |
-5,107 |
31,373 |
0 |
2,032 |
4,698 |
4315 |
1369 |
|
October |
23,998 |
4.64 |
3,89,968 |
7,672 |
45.39 |
1,593 |
0.02 |
-13,986 |
13,569 |
0 |
2,288 |
5,026 |
4742 |
1506 |
|
November |
15,156 |
4.38 |
1,77,063 |
6,795 |
45.52 |
3,449 |
(-)0.002 |
-69 |
21,182 |
0 |
2,251 |
4,644 |
4951 |
1580 |
|
December |
15,276 |
4.40 |
1,81,991 |
– |
45.59 |
2,888 |
(-)0.30 |
-132 |
32,020 |
0 |
2,492 |
5,017 |
5425 |
1740 |
| OMO : Open Market Operations * Outright turnover in Central Government dated securities. | ||||||||||||||
| LAF: Liquidity Adjustment Facility. | ||||||||||||||
| BSE : Stock Exchange, Mumbai. | ||||||||||||||
|
NSE: National Stock Exchange. |
||||||||||||||
RECENT ECONOMIC DEVELOPMENTS
gradually rationalised by changing the apportionment of 'normal' and 'back-stop' facilities to a ratio of one third is to two-thirds (33:67) from the fortnight beginning December 27, 2003. As a prudential measure aimed at limiting the uncollateralised exposure of banks to the call money market, the limit on maximum daily call/ notice money borrowings applicable to urban cooperative banks (UCBs) was extended to state co-operative banks (StCBs) and district central co-operative banks (DCCBs) on April 29, 2002.
Furthermore, with a view to preserving the integrity of the financial system and facilitating the development of the repo market, prudential limits on borrowing and lending in call/notice money market were stipulated for scheduled commercial banks (SCBs) in two stages (effective October 5, 2002 and December 14, 2002) (and PDs, effective February 7, 2004). The prudential norms were introduced with adequate safeguards to prevent problems arising out of asset-liability mismatches on banks’ portfolios.
With a view to improving transparency and strengthening market efficiency, a system of mandatory reporting of all call/ notice money market deals on the Negotiated Dealing System (NDS) from all NDS members commenced effective the fortnight beginning May 3, 2003.
2.82 Inflows on account of large deferred expenditure undertaken by the Government, purchase of foreign currency by the Reserve Bank and unwinding of the year-end tightness of liquidity in April 2003 ensured that the year started with a softening of call rates – a tendency which continued into May when the call rate remained below the repo rate throughout the month for the first time since the operationalisation of the LAF. Easy liquidity conditions were reflected in large repo bids, while there were very few reverse repo bids. In June, the Stage II of the transition to a pure inter-bank call money market was initiated synchronising with a cut in the CRR by 25 basis points to 4.5 per cent to prevent strains on liquidity. Liquidity conditions continued to remain comfortable in June despite fund outflows towards government security auctions and advance tax payments with the call rate continuing to rule at sub-repo levels. Easy liquidity conditions were reflected in large repo bids most of which were accepted in full. No reverse repo bids were accepted during the month. There was a temporary lull in the repo market as the advance tax outflows commenced but as liquidity conditions became comfortable, repo bids soared.
2.83 Easy liquidity conditions continued in the second quarter of the year as well. Government security auctions and the sale of State Development Loans resulted in only mild spikes in the call rate without breaching the repo rate in July. While the call market turnover fell reflecting the fact that call rates ruled below the Reserve Bank repo rates, there was a jump in the turnover in the repo market (outside the Reserve Bank) (Chart II.13). The repo rate was cut by 50 basis points to 4.5 per cent on August 25, 2003. The steady capital inflows continued to create conditions of surplus liquidity leading to call rates ruling generally below the repo rate during the third quarter of 2003-04.
2.84 Other segments of the money market experienced enhanced activity in 2003-04 so far (Table 2.38). Average daily turnover in the term money market during the first three quarters of 2003-04 was almost 1.7 times the amount in the corresponding period of 2002-03. The average outstanding volume increased on a year-on-year basis, particularly after November 2002, following implementation of prudential limits on banks’ call/ notice money operations in October 2002.
2.85 The outstanding amount of CDs issued by scheduled commercial banks increased during the year. The typical discount rate on CDs declined from 7.20 per cent in early April 2003 to 4.0 per cent by early December 2003. The main issuers were private sector banks. The discount rates on CP generally eased from a range of 5.25-8.15 per cent in mid-April 2003 to 4.64-6.75 per cent by December 31, 2003 with the weighted average discount rate declining from 6.20 per cent to 5.05 per cent.

Share this page:


Install the RBI mobile application and get quick access to the latest news!
Scan the QR code to install our app


Page Last Updated on:


