 IST,
IST,


II Recent Economic Development (Part 3 of 3)
| Month | Average Daily | Transactions in | Commercial Paper | Certificates of | Commercial Bills | Forward Rate |
| Turnover in Term | Repo Market | (Outstanding | Deposit | Rediscounted by | Agreements/ Interest | |
| Money Market | (Outside Reserve | Amount) | (Outstanding | commercial banks | Rates Swaps | |
| Bank) | Amount) | (Notional Amount) | ||||
| 1 | 2 | 3 | 4 | 5 | 6 | 7 |
| 2002-03 | ||||||
| March | 546 | 74,236 | 5,749 | 908 | 105 | 2,44,161 |
| 2003-04 | ||||||
| April | 604 | 41,815 | 5,994 | 1,485 | 164 | 2,49,449 |
| May | 455 | 43,328 | 6,820 | 1,996 | 334 | 2,84,641 |
| June | 610 | 48,605 | 7,108 | 2,183 | 393 | 2,93,127 |
| July | 573 | 74,936 | 7,557 | 2,466 | 364 | 3,05,409 |
| August | 644 | 73,844 | 7,646 | 2,961 | 693 | 3,14,708 |
| September | 772 | 69,512 | 7,258 | 3,098 | 644 | 3,33,736 |
| October | 543 | 89,452 | 6,845 | 3,321 | 354 | 3,92,303 |
| November | 428 | 96,824 | 7,956 | 3,666 | 429 | 3,71,373 |
| December | 403 | 1,00,275 | 8,762 | 3,643 | ||
| * As on December 12, 2003. | ||||||
2.86 There was a sharp expansion in the emerging segments of the financial markets. The repo market (outside the Reserve Bank) has been expanding with the gradual conversion of the call money market into a pure inter-bank market. The futures markets, in the form of forward rate agreements (FRAs) and interest rate swaps (IRSs), continued to witness a jump in the notional amount.
2.87 The collateralised borrowing and lending obligation (CBLO) operationalised through the Clearing Corporation of India Limited (CCIL) in January 2003, emerged as a new money market instrument. So as to aid its development as a money market instrument, the CBLO has been exempted from CRR subject to banks maintaining a statutory minimum CRR of 3 per cent. As at end-December 2003, out of total 59 members, 46 members were activated under the CCIL’s system for CBLO. The CBLO market recorded major gains in the second quarter of the current financial year. The daily average turnover in CBLO increased from Rs.47 crore in April 2003 to Rs.363 crore in December 2003. With regard to the changing profile of participants under the CBLO, it has been found that on the lending side more mutual funds have started participating in the market apart from an insurance company. On the borrowing side, the participants are largely co-operative banks.
Government Securities Market
Central Government Borrowings - 2003-04
2.88 The gross market borrowings of the Central Government during 2003-04 was budgeted at
Rs.1,66,230 crore, up by 10.0 per cent over the preceding year’s actual borrowings. A highlight of the current year so far has been the continued endeavour for restructuring of domestic debt through debt-swap by the State Governments and buy-back of high coupon loans by the Central Government frombanks. Adjusting for the inflows of States’ repayments of high-cost loans to the Centre under the debt swap scheme, the gross and net market borrowings of the Central Government are expected to be lower by 21 per cent and 33 per cent, respectively, than the budgeted amounts. The Central Government conducted its first buyback in July 19, 2003 when 19 high cost, illiquid securities amounting to Rs.14,434 crore (face value) were bought back and in their place four liquid securities of equal face value were issued. During the current fiscal year so far (up to December 31, 2003), the gross and net market borrowings of the Central Government amounted to Rs.1,15,036 crore and Rs.77,319 crore, respectively (excluding buyback of Rs.14,434 crore). This constituted 69.2 per cent of the budgeted gross market borrowings. Of the gross amount raised so far, about 83 per cent was raised through dated securities and the balance through 364-day Treasury Bills.
2.89 The issuance of floating rate bonds with some modifications was continued in 2003-04 as well, with a view to providing the investor an effective instrument for hedging interest rate risk in the context of the elongation of the maturity profile of Government debt.There were three issues of floating rate bonds up to December 15, 2003, with maturities ranging from 8 years to 11 years which raised a total of Rs.16,000 crore, with the variable bank rate linked to 364-day Treasury Bills. The Reserve
RECENT ECONOMIC DEVELOPMENTS
Bank’s recent Working Group on Rupee Interest Rate Derivatives (Chairman: G. Padmanabhan) recommended several measures to develop the interest rate derivatives market. Besides, the Group has suggested changes in risk reporting to reflect the interest rate risk of bank’s trading activities in interest rate products, both cash market and derivatives market.
2.90 Ample liquidity during 2003-04 so far enabled a sharp lowering of the weighted average yields of the dated securities issued despite the increase in the weighted average maturity, a lower order of primary placements on the Reserve Bank and no devolvements on primary dealers and the Reserve Bank (Table 2.39). During the current year so far (up to January 7, 2004), primary yields of 91-day Treasury Bills and 364-day Treasury Bills declined by 165 basis points and 152 basis points, to 4.24 per cent and 4.37 per cent, respectively.
2.91 The auction calendar for the second half of the year set a borrowing target of Rs.25,000 crore for the period October 2003 to March 2004 after adjusting amounts received from the State Governments towards prepayment of small savings loans and keeping in view trends in other receipts.
State Government Borrowings
2.92 The market borrowings of State Governments have gone up substantially in the wake of the debt-swap scheme which allowed the States to retire their high-cost debt to the Government of India. The gross and net market borrowings allocated for States for fiscal 2003-04 (provisional) amount to Rs.40,802 crore and Rs.36,657 crore, respectively. This is
inclusive of the additional allocation of Rs.23,000 crore under the debt-swap scheme. During the current year so far (up to December 31, 2003), the State Governments have raised Rs.38,752 crore (Rs.36,357 crore through tap sales and Rs.2,395 crore through auction) under the market borrowing programme, of which Rs.23,000 crore was raised under the debt-swap scheme. In order to elongate the maturity profile of State loans, a 12-year bond was issued on August 25, 2003 through the tap sale of 6.20 per cent State Development Loan(SDL) 2015. The declining trend in interest rates on market borrowings of the State Governments continued during 2003-04. During 2003-04 (up to December 31, 2003), the interest rate on market borrowings ranged from 6.40 per cent to 5.78 per cent.
Secondary Market for Government Securities
2.93 During the current year so far (up to December 2003), the average monthly volume of secondary market transactions through the Subsidiary General Ledger (SGL) in Government securities increased sharply to Rs.2,23,769 crore from Rs.1,61,806 crore during 2002-03. Exchange-traded Interest Rate Derivatives (IRDs) were enabled on the National Stock Exchange (NSE) from June 3, 2003 with the introduction of interest rate futures on notional Government bonds/Treasury Bills were introduced in the first phase. With a view to enabling PDs to manage their exposure to interest rate risks as well as to provide liquidity in the IRD segment, they were allowed to deal in IRDs for both hedging and trading. In the first phase, banks could transact in interest rate futures on notional bonds and Treasury Bills for the
Table 2.39: Central Government’s Market Borrowing
| Item | 2002-03 | 2002-03 (April-December) | 2003-04 (April-December) | ||||
| Gross | Net | Gross | Net | Gross | Net | ||
| 1 | 2 | 3 | 4 | 5 | 6 | 7 | |
| Budget Estimates* | 1,42,867 | 95,859 | 1,42,867 | 95,859 | 1,66,230 | 1,07,194 | |
| of which: Dated Securities | 1,16,867 | 89,447 | 1,16,867 | 1,16,867 | 140,230 | 1,07,320 | |
| 364-day Treasury Bills | 26,000 | 6,412 | 26,000 | 26,000 | 26,000 | -126 | |
| Expected@* | – | – | – | – | 1,31,126 | 72,090 | |
| Completed so far | 1,51,126 | 1,04,118 | 1,15,036 | 77,319 | |||
| of which: Dated Securities | 1,25,000 | 97,580 | 95,000 | 77,316 | |||
| 364-day Treasury Bills | 26,126 | 6,538 | 20,036 | 2.32 | |||
| Private Placements | 31,000 | 18,000 | 5,000 | ||||
| Devolvements on | |||||||
| RBI | 5,175 | 5,175 | 0 | ||||
| PDs | 2,722 | 2,722 | 0 | ||||
| Weighted Average Yield on dated securities (per cent) | 7.34 | 7.48 | 5.86 | ||||
| Weighted Average Maturity of dated securities (years) | 13.83 | 14.43 | 16.13 | ||||
| * For the full financial year. | @ Actuals for 2002-03. | ||||||
REPORT ON CURRENCY AND FINANCE
limited purpose of hedging the risk in their underlying investment portfolio.
2.94 Looking at the trends in secondary markets, the year 2003-04 commenced with the usual flush of early April liquidity fuelling a rally in prices of government securities which was subsequently moderated with the concerns of rising inflation. The price rally was sustained in June 2003 amidst a positive response in primary auctions as also a rate cut of 50 basis points by the European Central Bank (ECB). The rally, however, reversed following a clarification from the Reserve Bank that a repo rate cut was not on the anvil. Thereafter, prices remained range bound in view of favourable liquidity conditions despite advance tax flows. Since mid-July 2003, expectations of a further fall in inflation improved the sentiments.
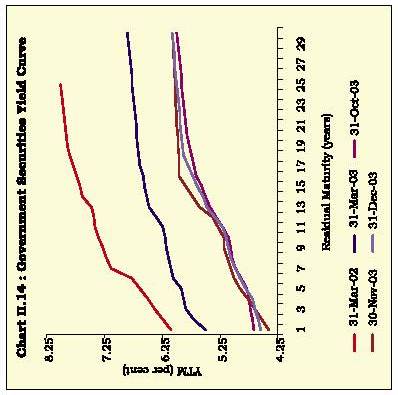
2.95 Due to the reduction of the repo rate by 50 basis points from 5.00 per cent to 4.50 per cent from August 25, 2003, there was a sharp decline in the yields and the 10-year yield touched a historic low of 5.23 per cent on August 26, 2003. During September 2003, the reduction in the interest rate cap on NRE deposits to 100 basis points above from the existing cap of 250 basis points above Libor affected market sentiments on expectations of slow forex inflows and a squeeze in Rupee liquidity. The announcement of a modest borrowing target in the calendar of issuance of Government securities for the second half of 2003-04 led to a rally in prices. Prices continued to go up on expectations of monetary easing in the run up to the Mid-Term Review. The 10-year yield reached a further low of 4.95 per cent on October 16, 2003. The yields, however, firmed up on the announcement of the 28-day LAF auction and OMO auction on October 18, 2003. During August 25-November 3, 2003, the 10-20 year spread widened from 55 basis points to 76 basis points. Although expectations of rate cuts in the Mid-Term Review did not materialise, the markets stabilised in view of the Reserve Bank’s benign inflation outlook and the reiteration of the soft interest rate stance of monetary policy. The yields moved in a range thereafter. The benchmark 10-year yield declined to 5.14 per cent on December 31, 2003 from 6.21 per cent as on March 31, 2003, a decline of 107 basis points. Reflecting the persistence of easy liquidity conditions, the yield curve has been trending steadily downwards in recent years (Chart II.14).
Foreign Exchange Market
2.96 Surplus conditions prevailed in the foreign exchange market on account of sustained foreign exchange inflows from export proceeds, inward
remittances and investment by FIIs during fiscal 2003-04. Increased foreign exchange inflows coupled with absence of adequate dollar demand from corporates and importers helped the Indian Rupee to steadily appreciate by 4.2 per cent against the US dollar from Rs.47.51 per US dollar as at end-March 2003 to Rs.45.61 per US dollar as at end-December 2003. The Rupee moved in the range of Rs.45.26-47.46 per US dollar during April-December 2003. The exchange rate of the Rupee was at Rs.45.45 per US dollar as on January 16, 2003. Despite a appreciation of the Rupee against the US dollar, the 5-country (trade-weighted) REER and NEER depreciated by 2.0 per cent and 3.9 per cent, respectively, during the same period mainly on account of depreciation of US dollar against the major currencies.
2.97 Reflecting excess liquidity conditions in the spot exchange market, as banks, exporters and corporates resorted to heavy forward dollar sales, the average one-month, three-month and six-month forward premia declined sharply to (-)0.46 per cent, (-)0.30 per cent and 0.04 per cent, respectively, in December 2003. Activity in both the merchant and inter-bank segments of the foreign exchange market increased strongly. While the merchant turnover increased from US $ 25 billion in April to US $ 41.5 billion in November 2003, the inter-bank turnover increased from US $ 89.4 billion to US $ 129.1 billion during the same period. The inter-bank to merchant turnover ratio, however, remained broadly stable at around 3 during the period.
RECENT ECONOMIC DEVELOPMENTS
Table 2.40: Mobilisation of Resources from the Primary Market
| Item | April-November | ||||||||
| 2003-04 | 2002-03 | 2002-03 | |||||||
| No. of Issues | Amount | No. of | Issues | Amount | No. of Issues | Amount | |||
| 1 | 2 | 3 | 4 | 5 | 6 | 7 | |||
| A. | Prospectus and Rights Issues | 9 | 1,559 | 9 | 2,736 | 17 | 4,867 | ||
| I. | Public Sector | 4 | 820 | 6 | 2,123 | 8 | 2,989 | ||
| II. | Private Sector | 5 | 739 | 3 | 613 | 9 | 1,878 | ||
| B. | Private Placement # | 504 | 32,007 | 577 | 25,643 | 1,147 | 61,746 | ||
| I. | Public Sector | 119 | 22,272 | 111 | 12,145 | 243 | 37,148 | ||
| II. | Private Sector | 385 | 9,735 | 466 | 13,498 | 904 | 24,598 | ||
| C. | Euro Issues | 10 | 2,398 | 5 | 1,247 | 11 | 3,426 | ||
| # | For private placement, data pertain to April-September. | ||||||||
| Note | : Includes both debt and equity. | ||||||||
| Source : Estimates based on information gathered from arrangers, financial institutions and newspaper reports. | |||||||||
Capital Market
Primary Market
2.98 During the current financial year (up to November 2003), the primary market remained sluggish despite a pick-up in the industrial activity, a strong economic outlook and a vibrant stock market. There are, however, some early signs of a pick-up as some corporates have announced plans of floating public issues. Moreover, sanctions and disbursements by All-India Financial Institutions (AIFIs) have increased after a gap of more than two years. In the public issues market, out of nine issues floated during April-November 2003, there were six equity issues amounting to 49 per cent of the total resources mobilised through public issues. Resource mobilisation from the private placement market increased during April-September 2003, the period for which data are available (Table 2.40). Public sector companies continued to raise substantial resources from the private placement market. Resource mobilisation during April-November 2003 from the Euro issues market in the form of American Depository Receipts (ADRs), Global Depository Receipts (GDRs) and Foreign Currency Convertible Bonds (FCCBs) also registered a rise.
2.99 Net resource mobilisation by mutual funds (excluding UTI-I) increased significantly during April-November 2003 (Table 2.41). The substantial improvement was on account of a turnaround in UTI and considerably higher inflows into private sector mutual funds. Due to the buoyancy witnessed in the equity and debt market, mutual funds have attracted huge inflows.
Secondary Market
2.100 The stock markets, which had remained subdued since February 2000, recorded a sustained rally in the current financial year, especially since end-May 2003. The BSE Sensex crossed the 4000 mark in mid-August 2003, the 5000 mark in November 2003 and the historical high of 6100 in early January 2004. The BSE Sensex climbed by over 100 per cent over mid-May 2003. Various factors like good monsoons, encouraging quarterly results by major corporates, strong institutional support, especially by FIIs, positive trends in international markets, sector-specific factors and strong macroeconomic fundamentals along with the appreciation in the Rupee contributed to the buoyant market sentiments which supported the rally. The BSE Sensex had crossed the 6000 mark only once before -during February 2000 in intra-day trading. The rally in the year 2000 was, however, driven mainly by technology scrips. In contrast, the recent rally is far more broad-based covering almost all sectors.
Table 2.41: Net Resource Mobilisation by Mutual Funds
| (Rupees crore) | ||||
| Category | April-November | 2002-2003 | ||
| 2003-04 | 2002-03 | |||
| 1 | 2 | 3 | 4 | |
| I. | Unit Trust of India | 270 | -7,362 | -9,434 |
| II. | Private Sector | 38,383 | 21,145 | 12,069 |
| III. | Public Sector | 2,189 | 2,586 | 1,561 |
| Total (I+II+III) | 40,842 | 16,369 | 4,196 | |
| Source : Securities and Exchange Board of India. | ||||
| Note : Data for UTI does not include UTI-I since February 2003. | ||||
REPORT ON CURRENCY AND FINANCE
Table 2.42: Trends in Stock Markets
| Indicator | BSE | NSE | ||
| April-December 2003 | April-December 2002 | April-December 2003 | April-December 2002 | |
| 1 | 2 | 3 | 4 | 5 |
| Average BSE Sensex/ S&P CNX Nifty | 4071.8 | 3189.6 | 1293.1 | 1033.6 |
| Volatility (C.V.) | 20.1 | 5.3 | 20.5 | 5.7 |
| Turnover (Rupees Crore) | 3,34,749 | 2,39,449 | 7,51,671 | 4,61,777 |
| Delivery as a per cent of Turnover | 26.4 | 19.2 | 20.8 | 14.2 |
| Market Capitalisation | ||||
| (end-period) (Rupees crore) | 12,73,361 | 6,28,197 | 11,67,029 | 6,72,862 |
| P/E ratio (end-period) | 18.9 | 14.6 | 20.7 | 14.8 |
| Source: The Stock Exchange, Mumbai (BSE) and The National Stock Exchange (NSE). | ||||
2.101 The present rise in indices is accompanied by a rise in turnover. This is reflected in the fact that while the BSE Sensex and the S&P CNX Nifty registered gains of 27.7 per cent and 25.1 per cent, respectively, during April-December 2003 over the corresponding period last year, the turnover witnessed even larger growth (Table 2.42). Though the volatility, as measured by coefficient of variation has risen, it is not a cause for concern as the speculative interest seems to have declined during the current rally as is evident from a rise in deliveries as a percentage of turnover. Although market capitalisation and the price-earning (P/E) ratio rose as a result of the increase in prices, the present P/E ratio on Indian markets still remains attractive as compared with certain other emerging markets.
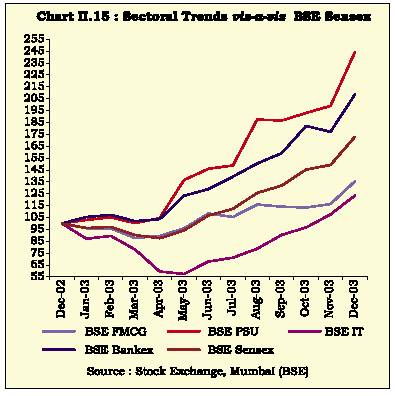
2.102 The present rally is not restricted to the blue-chip indices but is broad-based, with mid-cap and small-cap scrips also registering substantial gains. During April-December 2003, the broad-based BSE 500 index registered a gain of 120.9 per cent and the S&P CNX Mid-Cap Index registered a gain of 168.4 per cent while the blue-chip BSE Sensex posted a gain of only 91.5 per cent. Almost all the sectors including fast moving consumer goods (FMCG), technology, capital goods, banking and public sector undertaking (PSU) participated in the rally (Chart II.15).
2.103 Strong FII inflows into the equity markets in the current financial year have been viewed as one of the major driving forces of the present rally. FII investment in debt instruments increased too. Mutual funds turned buyers in equities but invested a large amount in debt instruments (Table 2.43).
2.104 Along with the rally in the cash segment of the markets, the derivatives segment has also been recording large turnover. In fact, the turnover in the
derivatives market exceeded that of the cash markets (Table 2.44). The scrip-wise futures have been attracting a large turnover. However, the volumes in interest rate futures introduced on the NSE in June 2003 are yet to pick up.
Table 2.43: Institutional Investments
| Year | FIIs | Mutual Funds | |||
| Equity | Debt | Equity | Debt | ||
| 1 | 2 | 3 | 4 | 5 | |
| 2000-01 | 10,124 | -46 | -2,767 | 5,023 | |
| 2001-02 | 8,067 | 685 | -3,796 | 10,959 | |
| 2002-03 | 2,528 | 162 | -2,067 | 12,604 | |
| 2003-04 | 28,781 | 3,997 | 736 | 19,388 | |
| (April-December) | |||||
| Source: Securities and Exchange Board of India. | |||||
RECENT ECONOMIC DEVELOPMENTS
Table 2.44: Turnover in Derivatives Market vis-à-vis Cash Market in NSE
| Year | Derivatives | Cash |
| 1 | 2 | 3 |
| 2000-01 | 2,365 | 13,39,510 |
| 2001-02 | 1,01,925 | 5,13,167 |
| 2002-03 | 4,39,855 | 6,17,989 |
| 2003-04 (April-December) | 12,73,254 | 7,51,671 |
| Source: The National Stock Exchange Ltd. | ||
Financial Sector
Scheduled Commercial Banks
2.105 During 2002-03, scheduled commercial banks witnessed an increase in profitability with their net profits touching 1.0 per cent of total assets as at end-March 2003. This was driven by: (i) substantial trading income, reflecting the continuing softening of interest rates; (ii) an increase in the credit portfolio, with the revival of industrial demand; and (iii) containment of operating expenses, par tly offset by higher provisioning. Spreads also widened during the year, reflecting the fact that the decline in deposit rates outstripped the decline in lending rates.
2.106 During the first half of 2003-04, based on regulatory returns, net profits, at 0.64 per cent of total assets, were higher than 0.49 per cent recorded in the comparable half of the previous year, driven by a containment of expenses partly offset by higher provisioning.Some banks have already made ad hoc provisions in view of the impending 90-day delinquency norm, effective end-March 2004.The enactment of the Securitisation and Reconstruction of Financial Assets and Enforcement of Security Interest (SARFAESI) Act, 2002 has provided the scope for sustained recovery of dues: as at the end of September 2003, banks had issued notices in 42,047 cases worth Rs.14,141 crore and recovered Rs.769 crore from 13,583 cases.
2.107 The increase in bank profitability was accompanied by an improvement in indicators of balance sheet health (Table 2.45). Asset quality continued to improve.The ratio of gross NPAs to gross advances declined during 2002-03. Besides, capital adequacy continued to be satisfactory with as many as 91 of the 93 SCBs achieving the stipulated 9.0 per cent capital to risk-weighted assets ratio (CRAR). The Investment Fluctuation Reserve, a cushion against any adverse movements in interest rates in the future, worked out to 1.7 per cent of eligible investments as at end-June 2003.
Table 2.45: Important Parameters of Select Bank-Groups
Bank Group | 1996-97 | 2001-02 | 2002-03 |
1 | 2 | 3 | 4 |
Operating Expenses/Total Assets | |||
Scheduled Commercial Banks | 2.9 | 2.2 | 2.2 |
Public Sector Banks | 2.9 | 2.3 | 2.3 |
All Old Private Sector Banks | 2.5 | 2.1 | 2.0 |
All New Private Sector Banks | 1.9 | 1.1 | 2.0 |
Foreign Banks | 3.0 | 3.0 | 2.8 |
Spread/Total Assets | |||
Scheduled Commercial Banks | 3.2 | 2.6 | 2.8 |
Public Sector Banks | 3.2 | 2.7 | 2.9 |
All Old Private Sector Banks | 2.9 | 2.4 | 2.5 |
All New Private Sector Banks | 2.9 | 1.2 | 1.7 |
Foreign Banks | 4.1 | 3.2 | 3.4 |
Net Profit/Total Assets | |||
Scheduled Commercial Banks | 0.7 | 0.8 | 1.0 |
Public Sector Banks | 0.6 | 0.7 | 1.0 |
All Old Private Sector Banks | 0.9 | 1.1 | 1.2 |
All New Private Sector Banks | 1.7 | 0.4 | 0.9 |
Foreign Banks | 1.2 | 1.3 | 1.6 |
Gross NPAs to Gross Advances | |||
Scheduled Commercial Banks | 15.7 | 10.4 | 8.8 |
Public Sector Banks | 17.8 | 11.1 | 9.4 |
All Old Private Sector Banks | 10.7 | 11.0 | 8.9 |
All New Private Sector Banks | 2.6 | 8.9 | 7.6 |
Foreign Banks | 4.3 | 5.4 | 5.2 |
Net NPAs to Net Advances | |||
Scheduled Commercial Banks | 8.1 | 5.5 | 4.4 |
Public Sector Banks | 9.2 | 5.8 | 4.5 |
All Old Private Sector Banks | 6.6 | 7.1 | 5.5 |
All New Private Sector Banks | 2.0 | 4.9 | 4.6 |
Foreign Banks | 1.9 | 1.9 | 1.8 |
CRAR | |||
Scheduled Commercial Banks | 10.4 | 11.9 | 12.6 |
Public Sector Banks | 10.0 | 11.8 | 12.7 |
All Old Private Sector Banks | 11.7 | 12.5 | 12.8 |
All New Private Sector Banks | 15.3 | 11.6 | 11.6 |
Co-operative Banks
2.108 The profitability of co-operative banks continued to be less than satisfactory, partly reflecting a narrowing of spreads. Reflective of the difficulties faced by the sector, urban co-operative bank deposits and credit off-take decelerated during 2002-03 (Table 2.46). Scheduled urban co-operative banks continued to record a net loss for the third year in succession, reflecting a narrowing of spreads, on the one hand, and a reduction in the size of the credit portfolio, on the other. The asset quality of urban co-operative banks remained, more or less, the same. The performance of rural co-operatives continued to be under some strain with the asset quality of the lower tier being relatively worse than that of the upper tier. State co-operative banks, however, continued to post profits in 2002-03.
REPORT ON CURRENCY AND FINANCE
Table 2.46: Urban Co-operative Banks –Select Financial Indicators
Indicator | 2001-02 | 2002-03 |
1 | 2 | 3 |
Growth in Major Aggregates (Per cent) | ||
Deposits | 15.1 | 9.1 |
Credit | 14.1 | 4.5 |
Financial Indicators | ||
(as percentage of total assets) @ | ||
Operating Profits | 1.5 | 1.3 |
Net Profits | -0.9 | -1.1 |
Spread | 2.2 | 2.1 |
Non-Performing Assets (as percentage of advances) | ||
Gross NPA | 21.9 | 21.0 |
@ Relates to scheduled urban co-operative banks. | ||
Financial Institutions
2.109 The performance of All-India financial institutions (FIs), as a group, witnessed further deterioration over the previous year on account of declines in the spread as well as non-interest income and rise in other expenses. All FIs, excluding IIBI and IFCI, however, registered positive operating and net profit. The CRAR of all institutions, excepting IFCI and IIBI. remained well above the benchmark minimum of 9 per cent. There is, neverthless, a pick up in project finance from FIs this year.
2.110 The FIs’ support to the commercial sector has been gradually shrinking reflecting the emergence of alternative sources of project finance for the Indian corporates as well as paucity of new business in view of the economic slowdown. This is reflected not only in the gross financial assistance in the form of sanctions and disbursements but also in terms of net flow of resources, which has been consistently negative since 2001-02 (Table 2.47).
Non-Banking Financial Companies
2.111 Non-banking financial companies continued to stagnate, as a sector, with their public deposits working out to about 1.0 per cent of broad liquidity
(L 3). In case of large NBFCs (excluding residual non-
bank financial companies (RNBCs)), there was a decline in the share of public deposits in total assets, partly substituted by a larger recourse to bank loans during 2002-03 (Table 2.48). The major portion of the assets of NBFCs (excluding RNBCs) continued to be in the form of their specialised areas of hire purchase and lending while the equipment leasing business continued to contract partly reflecting, inter alia, changes in taxation.
Table 2.47: Financial Institutions: Select Performance Indicators
| Indicator | 2001-02 | 2002-03 |
| 1 | 2 | 3 |
| Balance Sheet Indicators | ||
| (as percentage of assets) | ||
| Operating Profits | 1.6 | 1.4 |
| Net Profits | 0.7 | 0.9 |
| Spread | 0.6 | 0.7 |
| Non-Performing Assets | ||
| (as percentage of net advances) | 8.8 | 10.6 |
| Resource Flows (Rupees crore) | ||
| Sanctions | 27,619 | 19,335 |
| Disbursements | 20,725 | 14,501 |
| Credit | -4,706 | -5,321 |
| Note: Data on balance sheet indicators cover nine FIs,viz., IDBI, IFCI, IIBI, IDFC, Exim Bank, TFCI, SIDBI, NABARD and NHB while that on resource flows cover IDBI, IFCI, IDFC, IIBI and SIDBI. | ||
2.112 The NBFCs, as a sector, recorded losses for the second year in succession during 2001-02, as the decline in expenditure could not keep pace with the drop in both fund-based and fee-based income. The decline in fund income was particularly steep in recent years. Total expenditure fell less sharply as operating expenditure and tax provisions have tended to be sticky. Operating costs of NBFCs, however, continue to be higher than those of banks and financial institutions. The gross and net non-performing assets of reporting NBFCs has experienced a steady decline in recent years.
V. EXTERNAL SECTOR
Global Economic Outlook
2.113 Global output expanded strongly in the third quarter of 2003, following recovery in the United States and strong growth prospects in Asia. Global GDP growth is projected to grow by 4.1 per cent in 2004, up from 3.2 per cent in 2003 (IMF, September, 2003). Recent months have seen the emerging signs of a recovery in economic activity, particularly in the US, Japan and emerging Asia. In the US, the pace of growth has picked up, assisted by expansionary macroeconomic policies and supportive financial conditions. Equity and bond markets have responded with optimism to the prospects of recovery with investor interest returning to technology stocks more rapidly than to other sectors. In Japan, economic activity exhibited stronger signs in the third quarter of this fiscal which indicated that a cyclical upswing is underway, led by industrial activity and exports. In the UK and Australia, signs of recovery are clearly evident with rising household spending reflected in retail price
RECENT ECONOMIC DEVELOPMENTS
Table 2.48: Asset and Liabilities of Non-Banking Financial Companies (Other than RNBCs) Holding Public Deposits of Rs.20 crore and Above
| Item | March 31, 2002 | March 31, 2003 | ||
| Amount | Share to total | Amount | Share to total | |
| 1 | 2 | 3 | 4 | 5 |
| Liabilities | ||||
| Capital & Reserves | 4,765 | 16.0 | 3,018 | 11.4 |
| Public Deposits | 4,503 | 15.1 | 3,686 | 14.0 |
| Convertible debentures | 3,948 | 13.2 | 3,755 | 14.2 |
| Other Borrowings | 9,575 | 32.0 | 8,675 | 32.9 |
| of which : Banks | 7,108 | 23.8 | 6,785 | 25.7 |
| Other Liabilities | 7,103 | 23.8 | 7,222 | 27.4 |
| Total Liabilities | 29,895 | 100.0 | 26,355 | 100.0 |
| Assets | ||||
| Investment | 3,302 | 11.0 | 2,696 | 10.2 |
| Loans and Advances | 8,592 | 28.7 | 8,576 | 32.5 |
| Other Financial Assets | 12,081 | 40.4 | 10,255 | 38.9 |
| Of which: Hire Purchase | 9,556 | 32.0 | 8,571 | 32.5 |
| Equipment Leasing | 2,077 | 6.9 | 1,546 | 5.9 |
| Other Assets | 5,920 | 19.8 | 4,828 | 18.3 |
| Total Assets / Liabilities | 29,895 | 100.0 | 26,355 | 100.0 |
inflation, prompting the monetary authorities to raise key policy interest rates. China continues to grow at a remarkably strong pace while activity in other parts of Asia is bouncing back from the effects of SARS.
2.114 There is, never theless, considerable uncertainty regarding the durability of the pick-up. In the US, labour markets remain sluggish and significant excess capacity persists. Moreover, the substantial support provided to consumption by tax cuts is unlikely to be sustained. Despite the prospects of stronger growth, Japan continues to experience deflation. The ongoing concerns relating to structural weaknesses in the financial system remain. In contrast to the rest of the world, the euro area remains conspicuously weak although there are tentative signs of a modest recovery in recent months. Household demand remains sluggish and the unemployment rate for the area as a whole has risen.
2.115 In the euro area, whereas monetary policy can be adjudged to have been successful in an inflation targeting framework, the economic slowdown has been deep and prolonged, with GDP declining in the second quarter of 2003. The large economies – Germany, France, the Netherlands and Italy – are in recession with high levels of unemployment.Despite some recent improvement in expectations, household and business confidence remains depressed. The poor performance of Germany, in particular, threatens to hold back the region’s recovery. Corporate balance sheets are still adjusting to the bursting of the asset price bubble of the late 1990s holding down investment spending.
Exports have been adversely affected by weak external demand as well as the substantial appreciation of the euro vis a vis the US dollar over the past two years. Monetary policy has been accommodative but distinct inflation and unemployment rates in different countries blur the effectiveness of the common monetary policy. Although Germany and France are expected to post fiscal deficits above 4 per cent of GDP in 2003, the scope for countercyclical fiscal policy is limited by the Stability and Growth Pact.
2.116 In Japan, macroeconomic performance during 2003 has exceeded expectations alongside an improved external environment and an upturn in equity markets. The outlook remains overcast with deflationary pressures and persistent weakness in the financial sector. The possibility of declines in equity or bond prices, a sustained appreciation of the Japanese Yen and rising public debt remain dangers to a durable recovery. Quantitative easing of monetary policy has kept short-term interest rates at zero, but has not been aggressive enough to end deflation.
2.117 Overall, global macroeconomic imbalances and the associated misalignment of the G-3 currencies remain the most serious threat to a broad-based and robust recovery. This has implications for the pattern of capital flows. A current issue of concern is the practice of greater flexibility in the exchange rate regimes of these countries, and the resulting effects on the real economy. Studies have shown that greater volatility in developing countries’ real exchange rates has been associated with greater
REPORT ON CURRENCY AND FINANCE
Table 2.49: World Merchandise Trade
Item | 1998 | 1999 | 2000 | 2001 | 2002 | 2003 P | 2004 P | |
1 | 2 | 3 | 4 | 5 | 6 | 7 | 8 | |
World Trade in Goods | ||||||||
Volume | 4.7 | 5.8 | 13.3 | -0.6 | 3.3 | 2.9 | 5.4 | |
Value (In US Dollars) | -2.2 | 3.7 | 12.6 | -4.2 | 4.2 | 13.7 | 6.2 | |
World Trade Prices in US Dollars | ||||||||
Manufactures | -1.7 | -1.8 | -4.7 | -2.4 | 2.6 | 12.8 | 1.7 | |
Oil | -32.1 | 37.5 | 57.0 | -14.0 | 2.8 | 14.2 | -10.5 | |
Non-Fuel Primary Commodities | -14.3 | -6.7 | 4.5 | -4.0 | 0.6 | 5.0 | 2.4 | |
Price Deflator | ||||||||
In US dollars | -6.3 | -1.5 | -0.1 | -3.5 | 0.6 | 11.0 | 0.9 | |
In SDRs | -4.9 | -2.3 | 3.6 | -0.1 | -1.1 | 3.4 | 1.0 | |
P | Projection. | |||||||
Source: World Economic Outlook (September 2003), IMF. | ||||||||
misalignment in G-3 countries with disruptive effects on both trade and finance channels (see Chapter VII). This emerges as a major source of uncertainty for the conduct of monetary policy.
Global Trade
2.118 According to the International Trade Statistics (ITS) 2003 released by the WTO, world merchandise exports recorded a growth of 15 per cent in US dollar terms during the first half of the calendar year 2003.1 This marks a strong acceleration over the growth of 4 per cent recorded in 2002. The growth in world merchandise exports in volume (or real) terms during 2003 is, however, projected to be about 3 per cent, the same as that achieved in the previous year. The main factor behind buoyant trade growth in US dollar terms is the depreciation of the US dollar against the major currencies in Europe and Asia in the first six months of
2003. Higher oil and non-fuel commodity prices have also contributed to the increase in the value of international trade (Table 2.49). This is in contrast with the period 1998 to 2000 when the appreciation of the US dollar over other major currencies more than compensated for the price changes. As a result, volume growth during those years exceeded the growth in merchandise trade in US dollar terms.
India’s Merchandise Trade
2.119 The latest data, released by the Directorate General of Commercial Intelligence and Statistics (DGCI&S), indicate that India’s exports during the first eight months of the current fiscal 2003-04 witnessed a lower order of increase as compared to the previous year (Table 2.50). Imports registered an increase mainly on account of higher non-oil imports. On the other hand, the growth rate of oil imports during this period
Table 2.50: India’s Foreign Trade
April-March | April-November | |||||||||
Item | US $ Billion | Growth Rate (per cent) | US $ Billion | Growth Rate (per cent) | ||||||
2001-02 | 2002-03 P | 2001-02 | 2002-03 P | 2002-03 | 2003-04 P | 2002-03 | 2003-04 P | |||
1 | 2 | 3 | 4 | 5 | 6 | 7 | 8 | 9 | ||
Exports | 43.8 | 52.7 | -1.6 | 20.3 | 33.5 | 36.5 | 18.0 | 8.8 | ||
Oil | 2.1 | 2.5 | 12.0 | 18.8 | 1.5 | .. | 5.7 | .. | ||
Non-oil | 41.7 | 50.2 | -2.3 | 20.4 | 32.1 | .. | 18.6 | .. | ||
Imports | 51.4 | 61.4 | 1.7 | 19.4 | 39.1 | 47.7 | 14.3 | 21.9 | ||
Oil | 14.0 | 17.6 | -10.5 | 26.0 | 11.4 | 12.8 | 17.6 | 12.3 | ||
Non-oil | 37.4 | 43.8 | 7.2 | 17.0 | 27.7 | 34.9 | 13.0 | 25.8 | ||
Trade Balance | -7.6 | -8.7 | – | – | -5.6 | -11.2 | – | – | ||
Oil | -11.9 | -15.1 | – | – | -9.9 | .. | – | – | ||
Non-oil | 4.3 | 6.4 | – | – | 4.3 | .. | – | – | ||
P | Provisional. | .. | Not Available | |||||||
Source: DGCI&S. | ||||||||||
1 The World Economic Outlook (September 2003) of the IMF has projected a growth of around 14 per cent in world merchandise exports for the calendar year 2003 in terms of US dollars.
RECENT ECONOMIC DEVELOPMENTS
Table 2.51: India’s Principal Exports
April-March | April-September | ||||||||
Commodity Group | US $ million | Growth Rate | (per cent) | US $ million | Growth Rate (per cent) | ||||
2001-02 | 2002-03 P | 2001-02 | 2002-03 P | 2002-03 | 2003-04 P | 2002-03 | 2003-04 P | ||
1 | 2 | 3 | 4 | 5 | 6 | 7 | 8 | 9 | |
Primary Products | 7,164 | 8,312 | 0.5 | 16.0 | 4,004 | 3,908 | 17.0 | -2.4 | |
Agricultural & Allied Products | 5,901 | 6,412 | -1.2 | 8.7 | 3,011 | 3,048 | 4.8 | 1.2 | |
Ores & Minerals | 1,262 | 1,900 | 9.5 | 50.5 | 994 | 860 | 80.4 | -13.5 | |
Manufactured Goods | 33,370 | 38,353 | -2.8 | 14.9 | 19,383 | 20,971 | 19.0 | 8.2 | |
Leather & Manufactures | 1,910 | 1,787 | -1.8 | -6.4 | 957 | 946 | -5.7 | -1.1 | |
Chemicals & Related Products | 6,052 | 7,031 | 2.8 | 16.2 | 3,509 | 4,091 | 19.1 | 16.6 | |
Engineering Goods | 6,958 | 8,393 | 2.0 | 20.6 | 4,082 | 5,233 | 21.0 | 28.2 | |
Textiles | 9,665 | 10,567 | -9.3 | 9.3 | 5,444 | 5,123 | 12.0 | -5.9 | |
Gems & Jewellery | 7,306 | 8,854 | -1.1 | 21.2 | 4,496 | 4,786 | 34.1 | 6.5 | |
Handicrafts | 549 | 721 | -17.0 | 31.3 | 380 | 229 | 35.4 | -39.8 | |
Carpets | 510 | 497 | -12.3 | -2.6 | 250 | 240 | -2.5 | -4.0 | |
Petroleum Products | 2,119 | 2,517 | 12.0 | 18.8 | 1,216 | 1,657 | 22.8 | 36.2 | |
Total Exports | 43,827 | 52,719 | -1.6 | 20.3 | 25,094 | 27,439 | 18.7 | 9.3 | |
P | Provisional. | ||||||||
Source: DGCI&S. | |||||||||
decelerated. The trade deficit during April-November 2003 doubled over the same period lastyear.
2.120 Commodity-wise data on India’s foreign trade, available for the first half of the fiscal year 2003-04, show that while the exports of ‘primary products’ declined, there was a substantial rise in the exports of ‘petroleum products’. ‘Manufactured goods’, which accounted for over three-fourth of India’s exports, witnessed a moderate increase during this period. Within the broad ‘manufacturing goods’ group, however, the exports of ‘leather and manufactures’, ‘textiles’, ‘handicrafts’ and ‘carpets’ recorded negative growth. On the other hand, exports of ‘chemical and related products’ and ‘engineering goods’ increased significantly during April-September 2003 (Table 2.51).
2.121 The decline in exports of ‘leather and manufactures’, ‘textiles’ and ‘handicrafts’ and ‘carpets’ is mainly due to a subdued demand for such products in advanced countries, especially in the USA. Although most of the ‘engineering goods’ had a moderate rise in exports during 2003-04 so far, the important item that led this group’s growth has been ‘iron and steel’, ‘manufactures of metals’ and ‘machinery and instruments’. This was mainly due to rising demand from countries in East Asia and China supplemented by higher domestic production.
2.122 The USA continued to remain the most important destination of India’s exports, followed by the UAE and the UK (Table 2.52). However, the market that is rapidly emerging as one of the prime
Table 2.52: Major Destination of India’s Exports
April-March | April-September | |||||||
Country | US $ million | Growth Rate | (per cent) | US $ million | Growth Rate (per cent) | |||
2001-02 | 2002-03 P | 2001-02 | 2002-03 P | 2002-03 | 2003-04 P | 2002-03 | 2003-04 P | |
1 | 2 | 3 | 4 | 5 | 6 | 7 | 8 | 9 |
U S A | 8,513 | 10,856 | -8.5 | 27.5 | 5,378 | 5,345 | 27.8 | -0.6 |
U A E | 2,492 | 3,314 | -4.1 | 33.0 | 1,605 | 1,914 | 29.6 | 19.2 |
U K | 2,161 | 2,473 | -6.0 | 14.4 | 1,240 | 1,310 | 14.8 | 5.6 |
Hong Kong | 2,366 | 2,444 | -10.4 | 3.3 | 1,210 | 1,443 | 3.3 | 19.3 |
Germany | 1,788 | 2,061 | -6.2 | 15.2 | 994 | 1,125 | 16.0 | 13.2 |
China | 952 | 1,961 | 14.5 | 106.0 | 701 | 910 | 59.1 | 29.8 |
Japan | 1,510 | 1,858 | -15.8 | 23.0 | 978 | 793 | 26.1 | -18.9 |
Belgium | 1,391 | 1,648 | -5.4 | 18.5 | 821 | 840 | 27.3 | 2.2 |
Singapore | 972 | 1,423 | 10.9 | 46.3 | 762 | 706 | 65.1 | -7.4 |
Italy | 1,207 | 1,340 | -7.8 | 11.0 | 637 | 751 | 4.8 | 17.9 |
P Provisional. | ||||||||
Source: DGCI&S. | ||||||||
REPORT ON CURRENCY AND FINANCE
Table 2.53: India’s Principal Imports
April-March | April-September | |||||||
Commodity | US $ million | Growth Rate | (per cent) | US $ million | Growth Rate (per cent) | |||
2001-02 | 2002-03 P | 2001-02 | 2002-03 P | 2002-03 | 2003-04 P | 2002-03 | 2003-04 P | |
1 | 2 | 3 | 4 | 5 | 6 | 7 | 8 | 9 |
Petroleum, Petroleum Products & | ||||||||
Related Material | 14,000 | 17,639 | -10.5 | 26.0 | 8,663 | 9,214 | 12.6 | 6.4 |
Edible oil | 1,356 | 1,807 | 3.6 | 33.3 | 824 | 1,394 | 9.3 | 69.2 |
Non-Ferrous Metals | 647 | 645 | 21.2 | -0.4 | 320 | 380 | -1.7 | 18.8 |
Metalliferous Ores and Metal Scraps | 1,144 | 1,004 | 47.7 | -12.3 | 549 | 593 | -9.1 | 8.0 |
Iron & Steel | 834 | 940 | 7.2 | 12.8 | 445 | 676 | 4.0 | 51.9 |
Capital Goods | 9,882 | 12,746 | 10.5 | 29.0 | 5,495 | 7,271 | 26.6 | 32.3 |
Pearls, Precious & | ||||||||
Semi-Precious Stones | 4,623 | 6,054 | -3.8 | 31.0 | 3,102 | 3,026 | 41.4 | -2.4 |
Textiles, Yarn, Fabrics, etc. | 748 | 956 | 25.3 | 27.9 | 455 | 582 | 16.3 | 27.8 |
Chemicals, Organic & Inorganic | 2,800 | 2,966 | 14.6 | 5.9 | 1,438 | 1,791 | 3.5 | 24.6 |
Gold & Silver | 4,582 | 4,234 | -1.2 | -7.6 | 1,911 | 3,091 | -27.1 | 61.8 |
P Provisional. | ||||||||
Source: DGCI&S. | ||||||||
destinations in recent years is China. Shar p increases in exports were also observed in respect of Iran, Italy, Germany and Netherlands. During April-September 2003, there were considerable declines in exports to Japan, Russia and East Asian countries, such as, South Korea, Malaysia, Singapore and Thailand.
2.123 Commodity-wise analysis of imports during the first half of 2003-04 showed that the growth was largely on account of the sharp increases in the imports of ‘gold and silver’, ‘edible oil’, ‘iron and steel’ and ‘capital goods’. The increase in the import value of ‘gold and silver’ was primarily due to the hardening of international prices during this period while the
sharp rise in ‘edible oil’ imports could be attributed to lower domestic production, consequent upon drought conditions last year. Within the ‘non-oil non-gold/silver’ imports, ‘iron and steel’ and ‘capital goods’ imports recorded an impressive rise in April-September 2003, mainly reflecting the industrial recovery (Table 2.53).
2.124 As regards sources of India’s impor ts, although the USA and Belgium continued to remain the two most important countries, China has become the third important source during the current year. Country-wise data showed sharp increases in imports from Switzerland, South Africa, and East Asian countries such as Hong Kong, South Korea and Malaysia during April-September 2003 (Table 2.54).
Table 2.54: Sources of India’s Imports | ||||||||
April-March | April-September | |||||||
Country | US $ million | Growth Rate | (per cent) | US $ million | Growth Rate (per cent) | |||
2001-02 | 2002-03 P | 2001-02 | 2002-03 P | 2002-03 | 2003-04 P | 2002-03 | 2003-04 P | |
1 | 2 | 3 | 4 | 5 | 6 | 7 | 8 | 9 |
U S A | 3,150 | 4,418 | 4.5 | 40.3 | 1,870 | 2,240 | 20.8 | 19.8 |
Belgium | 2,763 | 3,712 | -3.7 | 34.3 | 1,808 | 1,737 | 42.9 | -3.9 |
China | 2,036 | 2,783 | 35.6 | 36.6 | 1,221 | 1,746 | 30.1 | 43.0 |
U K | 2,563 | 2,778 | -19.1 | 8.4 | 1,411 | 1,478 | 5.6 | 4.7 |
Germany | 2,028 | 2,377 | 15.3 | 17.2 | 1,118 | 1,232 | 16.9 | 10.1 |
Switzerland | 2,871 | 2,329 | -9.2 | -18.9 | 1,050 | 1,784 | -36.8 | 69.9 |
South Africa | 1,441 | 2,090 | 41.0 | 45.0 | 907 | 1,087 | 17.3 | 19.8 |
Japan | 2,146 | 1,829 | 16.5 | -14.8 | 840 | 1,122 | -6.9 | 33.6 |
South Korea | 1,141 | 1,524 | 27.7 | 33.5 | 561 | 1,161 | 3.1 | 107.0 |
Malaysia | 1,134 | 1,465 | -3.7 | 29.2 | 670 | 932 | 18.2 | 39.1 |
P Provisional. | ||||||||
Source: DGCI&S. | ||||||||
RECENT ECONOMIC DEVELOPMENTS
| Table 2.55: India’s Current Account | ||||||||
| US $ million | ||||||||
| Item | 2000-01 | 2001-02 | 2002-03 | April-September | ||||
| 2003 | 2002 | |||||||
| 1 | 2 | 3 | 4 | 5 | 6 | |||
| I. | Merchandise Balance | -14,370 | -12,703 | -12,910 | -12,079 | -5,413 | ||
| II. | Invisibles Balance (a+b+c) | 10,780 | 13,485 | 17,047 | 12,286 | 7,420 | ||
| a) | Services | 2,478 | 4,577 | 6,765 | 5,322 | 2,435 | ||
| i) | Travel | 294 | 628 | -438 | 552 | -309 | ||
| ii) | Transportation | -1257 | -413 | -23 | 214 | 8 | ||
| iii) | Insurance | 135 | 13 | 54 | -48 | 72 | ||
| iv) | G.n.i.e. | 316 | 197 | 79 | 31 | 44 | ||
| v) | Miscellaneous | 2,990 | 4,152 | 7,093 | 4,573 | 2,620 | ||
| Of which: Software Services | 5,750 | 6,884 | 8,863 | 5,610 | 4,017 | |||
| b) | Transfers | 13,134 | 12,509 | 15,217 | 9,047 | 7,270 | ||
| i) | Official | 336 | 384 | 410 | 109 | 96 | ||
| ii) | Private | 12,798 | 12,125 | 14,807 | 8,938 | 7,174 | ||
| c) | Income | -4,832 | -3,601 | -4,935 | -2,083 | -2,285 | ||
| i) | Investment Income | -4,929 | -3,675 | -5,010 | -2,103 | -2,320 | ||
| ii) | Compensation of Employees | 97 | 74 | 75 | 20 | 35 | ||
| Total Current Account (I+II) | -3,590 | 782 | 4,137 | 207 | 2,007 | |||
| G.n.i.e. : Government, not included elsewhere. | ||||||||
Invisibles and Current Account
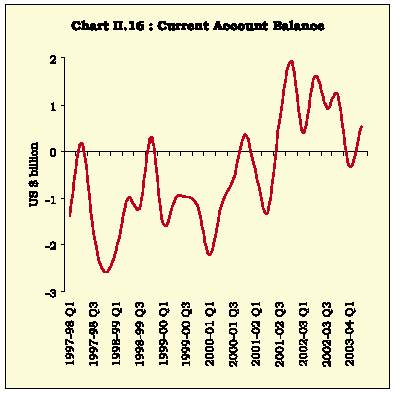
2.125 Invisibles earnings continued to provide strong support to India’s balance of payments during the first half of 2003-04. Net invisibles surplus increased during April-September 2003 as compared with the corresponding period of the previous year. This was mainly on account of higher inflows under transportation, software services and private transfer receipts. Despite ahigher trade deficit on payment basis, the current account again registered a small surplus after being in deficit during the first quarter of 2003-04 (Chart II.16 and Table 2.55).
Capital Account
2.126 Net capital flows increased sharply during April-September 2003. The major contributors to capital flows were portfolio investment, short-term trade credit and NRI deposits (Table 2.56).
2.127 Foreign direct investment (FDI), which includes equity capital of unincorporated entities, reinvested earnings and, inter-corporate debt transactions between the related entities, under the expanded coverage2, stood a little lower than in the previous year. The breakup of portfolio investments reveals that FIIs flows have been substantial during the financial year so far (Table 2.57). In mid-January 2004, the Central Government revised FDI limits in several sectors, including banking, petroleum and natural gas, to create an enabling environment for FDI inflows along with infusion of new
technologies and management practices. In case of private sector banks, for example, the FDI limit (including both direct and porfolio investment) has been hiked to 74 per cent. Guidelines for external commercial borrowings (and foreign currency convertible bonds) have been revised in respect of eligibility, end-use restrictions and spreads. Corporates have been allowed to borrow up to US $ 500 million under the automatic route, provided the ECBs are for a minimum average maturity of five years (See Chapter VI).
- Foreign direct investment has been revised from 2001-02 to include equity capital of unincorporated entities, reinvested earnings and inter-corporate debt transaction. These have been incorporated following the IMF’s accepted definitions and other country practices.
REPORT ON CURRENCY AND FINANCE
Table 2.56: Capital Flows
| US $ million | |||
| Item | (April-September) | Variation | |
| 2002-03 | 2003-04 | ||
| 1 | 2 | 3 | 4=(3-2) |
| Capital Flows | 4,298 | 12,916 | 8,618 |
| Foreign Direct Investment | 1,988 | 1,675 | -313 |
| Portfolio Investment | -394 | 3,512 | 3,906 |
| Non-resident (NRI) Deposits | 1,494 | 2,028 | 534 |
| Banking Capital (excluding NRI Deposits) | 960 | 1,031 | 71 |
| External Commercial Borrowing | -1,718 | -324 | 1,394 |
| Short-term Credit | 343 | 2,213 | 1,870 |
| External Assistance | -18 | -201 | -183 |
| Rupee Debt Service | -358 | -303 | 55 |
| Others (including leads and lags in export) | 2,001 | 3,285 | 1,284 |
2.128 Net inflows under non-resident deposit schemes increased during April-September 2003 (Table 2.58). With the rationalisation in the interest rates on NRE deposits, in line with the decline in global interest rates, the flow in NRE deposits declined in the last few months.
Foreign Exchange Reserves
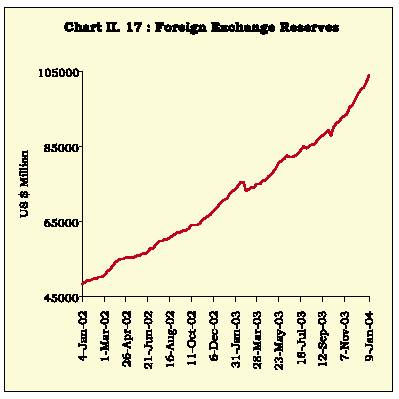
2.129 India’s foreign exchange reserves comprising foreign currency assets, gold and Special Drawing Rights (SDRs) touched US $ 103.1 billion on January 16, 2004 driven by sustained capital flows (Chart II.17).
Foreign exchange reserves recorded a rise of US $ 27.7 billion during the current financial year (up to January 16, 2004), even after prepayment of external debt of US $ 2.6 billion and redemption of Resurgent India Bonds (RIBs) amounting to US $ 2.4 billion out of the reserves. This accretion during the current year so far has been the highest in any financial year. It was almost entirely in the form of foreign currency assets, which reached US $ 98.9 billion on January 16, 2004. The Reserve Bank’s forward assets declined to US $ 740 million as at end-December 2003 as compared with US $ 2,420 million as on March 31, 2003 mainly due to selling of forward assets for RIB repayment.
Table 2.57: Foreign Investment Flows by Category
| (US $ million) | ||||||
| Item | 2001-02 (R) | 2002-03 (P) | April-October | |||
| 2002-03(P) | 2003-04 (P) | |||||
| 1 | 2 | 3 | 4 | 5 | ||
| A. | Direct Investment (I+II+III) | 6,131 | 4,660 | 2,783 | 2,221 | |
| I. | Equity (a+b+c+d+e) | 4,095 | 2,700 | 1,837 | 1,163 | |
| a. Government (SIA/FIPB) | 2,221 | 919 | 633 | 507 | ||
| b. RBI | 767 | 739 | 509 | 292 | ||
| c. NRI | 35 | – | – | – | ||
| d. Acquisition of shares * | 881 | 916 | 633 | 314 | ||
| e. Equity capital of unincorporated bodies | 191 | 126 | 62 | 50 | ||
| II. | Re-invested earnings $ | 1,646 | 1,498 | 749 | 738 | |
| III. | Other capital $$ | 390 | 462 | 197 | 320 | |
| B. | Portfolio Investment (a+b+c) | 2,021 | 979 | -251 | 5,156 | |
| a. | GDRs/ADRs # | 477 | 600 | 137 | 347 | |
| b. | FIIs ** | 1,505 | 377 | -388 | 4,809 | |
| c. | Offshore funds and others | 39 | 2 | – | – | |
| Total (A+B) | 8,152 | 5,639 | 2,532 | 7,377 | ||
| * | Relates to acquisition of shares of Indian companies by non-residents under Section 5 of FEMA, 1999. Data on such acquisitions have been | |||||
| included as part of FDI since January 1996. | ||||||
| # | Represents the amount raised by Indian corporates through Global Depository Receipts (GDRs) and American Depository Receipts (ADRs). | |||||
| ** | Represents fresh inflow of funds by Foreign Institutional Investors (FIIs) | |||||
| $ | Data for 2002-03 are estimated as average of previous two years. | |||||
| $$ | Data pertain to inter-company debt transactions of FDI entities. | |||||
RECENT ECONOMIC DEVELOPMENTS
| Table 2.58: Inflows under NRI Deposit Scheme | |||||
| US $ million | |||||
| Scheme | 2001-02 | 2002-03 | April-October | ||
| 2002-03P | 2003-04P | ||||
| 1 | 2 | 3 | 4 | 5 | |
| 1. FCNR(B) | 594 | 526 | 581 | -333 | |
| 2. NR(E)RA @ | 1,626 | 6,195 | 3,794 | 3,964 | |
| 3. NR(NR)RD | 508 | -3,745 | -2,430 | -1,167 | |
| Total | 2,728 | 2,976 | 1,945 | 3,130 | |
| P | Provisional. | ||||
| @ Discontinued with effect from April 1, 2002. | |||||
2.130 The composition of the accretion to foreign exchange reserves during the first half of 2003-04 has undergone significant changes as compared with that of the comparable half of the previous year:
The current account surplus declined to US $ 0.2 billion during April-September 2003 from US $ 2.0 billion during April-September 2002.
There has been a significant rise in the net inflows through the capital account heads at US $ 13.3 billion during April-September 2003 as against US $ 4.6 billion in April-September 2002.
There has been a significant increase in capital flows from investment by foreign institutional investors (FIIs), short-term credit and nonresident deposits. The higher increase in FII inflows have emerged as a critical factor behind the rally in the stock markets.
Valuation changes, reflecting the appreciation of the Euro, GBP and Japanese Yen against the US dollar, accounted for US $ 1.8 billion of accretion to total reserves in April-September 2003 as against with a valuation addition of US $ 2.0 billion in April-September 2002.
External Debt
2.131 India’s external debt as at end-September 2003 increased over the level of end-March 2003, mainly on account of increase in NRI deposits, external commercial borrowings, short-term debt including short-term trade-related debt (Table 2.59).
2.132 The increase in NRI deposits during April-October 2003 was on account of an increase in both Non-Resident (External) Rupee Account [NR(E)RA] deposits and Foreign Currency Non-Resident (Banks) [FCNR(B)] deposits, partly reflecting the reinvestment of RIB maturity proceeds. The increase in NR(E)RA deposits included reinvestment of maturity proceeds of the NR(NR)RD scheme (which was discontinued with effect from April 1, 2002). The increase in
| Table 2.59: India’s External Debt | |||||||
| Item | March 2003 | September 2003 | |||||
| Amount | Share in total | Amount | Share in | ||||
| (US $ Million) | Debt | (US $ Million) | Total Debt | ||||
| 1 | 2 | 3 | 4 | 5 | |||
| 1. | Multilateral | 29,994 | 28.6 | 30,575 | 27.2 | ||
| 2. | Bilateral | 16,824 | 16.1 | 17,542 | 15.6 | ||
| 3. | IMF | 0 | – | 0 | – | ||
| 4. | Commercial Borrowings (including trade credits) # | 27,330 | 26.1 | 28,469 | 25.3 | ||
| 5. | NRI Deposits (Long-Term) | 23,160 | 22.1 | 27,186 | 24.2 | ||
| 6. | Rupee Debt | 2,822 | 2.7 | 2,603 | 2.3 | ||
| 7. | Long-Term Debt (1to 6) | 1,00,130 | 95.6 | 1,06,375 | 94.5 | ||
| 8. | Short-Term Debt * | 4,569 | 4.4 | 6,162 | 5.5 | ||
| 9. | Total Debt (7+8) | 1,04,699 | 100 | 1,12,537 | 100 | ||
| # | Includes net investment by 100% FII debt funds. | ||||||
| * | Excludes suppliers credit of up to 180 days. | ||||||
REPORT ON CURRENCY AND FINANCE
borrowing by corporates in the face of low international interest rates led to a rise in external commercial borrowings. The increase in short-term debt has been mainly on account of higher short-term trade credits which, in turn, reflected a sharp increase in import. Despite growth in short-term debt during April-September 2003, the proportion of such debt in the overall debt stock remains modest.
2.133 It is interesting to note that during end-March 1991 to end-September 2003, India’s foreign exchange reserves increased by about US $ 85.3 billion, while the addition to India’s external debt was only US $ 28.7 billion. This implies that bulk of the accumulation of reserves has taken place through non-debt creating flows and without any additional costs in the form of increased indebtedness and debt servicing obligations.
VI. CONCLUDING OBSERVATIONS
2.134 The Indian economy is now exhibiting healthy growth. The real GDP growth of 8.4 per cent in the second quarter of 2003-04 places India amongst the fastest growing economies in the world during the current year. Impor tantly, the second quar ter estimates show that buoyancy has spread across most sectors of the economy and is not confined only to agriculture, which still accounts for most of the rebound from the drought of last year.The progress of the North-East monsoon is satisfactory, over the above-normal South-West monsoon. As a result, total foodgrains production during 2003-04 is expected to reach a record high, substantially pushing up agricultural GDP. The momentum of industrial recovery is expected to continue, with the already strong export demand, reinforced by the improved prospects for domestic investments. This is also reflected in most surveys of business confidence in the recent months. The manufacturing sector has recorded a significant growth of 7.3 per cent in the second quarter of 2003-04, continuing the sustained acceleration from the low of 2.9 per cent growth registered in the first quarter of 2001.The improved prospects for real activity globally should add strength to the upward momentum in growth. The overall GDP growth for the year 2003-04 as a whole, which was estimated at around 6.0 per cent at the beginning of the year and 6.5-7.0 per cent with an upward bias in November is, on latest assessment, likely to be higher and around 7.0 per cent with a continued upward bias, unless there are unforeseen circumstances.
2.135 The investment climate has improved in the recent months. However, there is not yet adequate
evidence of a clear increase in investment demand. There are reports that corporates are now relying more and more on internal resources, and hence incremental pressure on credit demand may appear with a time lag. Resource mobilisation by corporates in the primary market has actually been lower during the year, but there is now expectation of increased activity in the IPO market in 2004.
2.136 The fiscal situation still remains a cause for concern. The tax-GDP in the economy continues to be low. As the revenue deficit is high, the burden of fiscal correction naturally falls on public investment. The public sector dis-saving, which began in 1998-99, has been rising over the years. The fiscal constraint has not been binding as the private sector saving-investment surplus has continued to grow. This surplus has been funding public sector dis-savings. Hence, the high fiscal deficit has not put pressure on interest rates or for that matter, on monetary policy and the current account balance. Moreover, in 2001-02 and 2002-03, the private sector surplus, apart from financing the public sector deficit, also spilled over into the external account.
2.137 Large inflows from foreign institutional investors have flown into the stock markets, reflecting the prevailing strong business confidence. Capital markets around the world have revived in 2003. The rising secondary market and the strong macroeconomic fundamentals suggest that the time is now ripe for a take-off by the primary market. There are some early indications that many corporates are planning to come to the primary market in 2004 to mobilise a significant amount of resources.
2.138 The persistence of capital flows is likely to continue to generate surplus liquidity in the economy. In the backdrop of the current policy stance on exchange rate management and reserves accretion, it would be appropriate for the Reserve Bank to continue to maintain orderly conditions in the foreign exchange markets, as well as maintain stable conditions in the financial markets through monetary measures. Until now, the Reserve Bank has managed to conduct monetar y management consistent with its monetar y stance through appropriate absorption of liquidity by sterilisation. Given the expectations of the magnitude of the flows and the reduction in the quantum of securities available with it, the Reserve Bank had set up an internal Working Group on the instruments of Sterilisation. The recommendations of the Working Group are currently under consideration of the Reserve Bank and the Government.
RECENT ECONOMIC DEVELOPMENTS
2.139 The Indian foreign exchange market generally continued to witness orderly conditions during the recent months. The phenomenon in the last few months should appropriately be described as a significant depreciation of the US dollar. In general, the adjustment in the US dollar, which was considered to be essential, seems to have taken place in large measure in a non-disruptive manner so far. There are, however, emerging pressures on the distribution of the burden of adjustment mainly between the US, Euro area, and Asia, especially Japan and China. Under these circumstances, there appears to be considerable merit in continuing with the policy of exchange rate management of the Rupee addressing essentially the volatility issues without a fixed target. As a result of this policy of exchange rate management, in the context of maintaining orderly conditions in the foreign exchange markets, the foreign exchange reserves increased substantially. Considering the state of markets and the capabilities of the market participants in India, non-volatility in financial markets has to be treated as a public good.
2.140 The prospects for the world economy have improved since April 2003. There are signs of pick up in growth in US and Japan while Asian markets are having a strong recovery. China is also expected to perform well. Latin America and Africa are expected to show some acceleration in growth. Global growth will continue to be led by the USA, but significant downside risks could emanate from the emergence of the record current account and fiscal deficits in the USA. While the depreciation of the US dollar has so
far been relatively orderly, further and substantial depreciation remains a risk to global recovery under the shadow of the twin deficits. The monetary policy has moved to mild tightening in some countries; in others there is a neutral bias with expectations of tightening, particularly in the US, with no firm indication on the timing. These uncertainties would necessarily have an impact on global liquidity as well as the flow of resources to emerging countries including India.As far as India is concerned, the relative weight of the fundamentals and confidence in the economy appears to be more than the global liquidity factors that govern the capital flows.
2.141 In sum, the Indian economy is now geared for higher growth as the macroeconomic environment has continued to improve during the year. The inflation outlook, by and large, remains benign, though careful monitoring and management would have to continue with a view to cushioning supply shocks and better management of supply bottlenecks for individual commodities so that price volatilities are evened out. The money, government securities and foreign exchange markets remain stable. The foreign exchange reserves are at a more comfortable level than ever before and there is adequate liquidity in the system. The overall developments in the economy are favourable and provide the main springs for a strong revival of investment by industry. If the fiscal drag could be eased, the macroeconomic prospects would improve further, reinforced by improved public infrastructure and sound investment. This would need continuing tax and non-tax fiscal reforms, including user charges.

Share this page:


Install the RBI mobile application and get quick access to the latest news!
Scan the QR code to install our app


Page Last Updated on:


