 IST,
IST,


II. Aggregate Demand
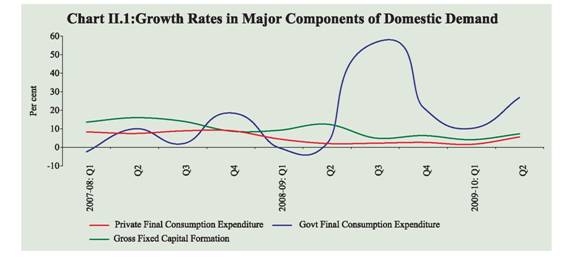
Growth in private consumption demand recovered significantly in the second quarter of 2009-10, which represents the highest growth in six quarters. Investment demand, in terms of gross fixed capital formation, also improved further. Since the onset of the global recession, growth in government expenditure has remained ahead of private demand and in the second quarter of 2009-10, there was a significant increase reflecting the payment of arrears relating to the Sixth Pay Commission award. Corporate sales growth in the second quarter of 2009-10 showed significant improvement over the preceding quarter although year-on-year growth remained flat; revival in sales growth for companies in the manufacturing sector was stronger than those in the services sector. Domestic Demand II.1 Deceleration in the growth of private consumption demand to 1.6 per cent in Q1 of 2009-10 and the subdued private investment demand were the key constraints to faster recovery in GDP growth from the slowdown in the second half of 2008-09. In Q2 of 2009-10, however, growth in private consumption demand revived to 5.6 per cent and investment demand, measured in terms of growth in gross fixed capital formation (GFCF), also recovered to 7.3 per cent. While the growth in private consumption demand is the highest in the last six quarters, the growth in gross fixed capital formation is the highest in last four quarters. The government final consumption expenditure (GFCE) increased by nearly 27 per cent in Q2 of 2009-10 over the corresponding period of 2008-09, mainly on account of the disbursement of arrears under the Sixth Pay Commission award (Chart II.1). Net of the arrears payments, the growth would have been lower at 11.7 per cent. Accordingly, demand side GDP would have been 5.5 per cent as against 6.7 per cent during Q2 of 2009-10. II.2 The difference in growth rates of GDP at factor cost (supply side) and GDP at market prices (demand side) is essentially due to divergence in the growth rate of net indirect taxes (i.e., indirect tax less subsidies). During Q2 of 2009-10, the net indirect taxes declined by 4.8 per cent as against an increase of 8.0 per cent in the corresponding period of 2008-09. As a result, GDP at market prices grew at 6.7 per cent as compared with 7.9 per cent growth in GDP at factor cost. II.3 There has been a sharp decline in inventory levels in Q2 of 2009-10 over both the preceding quarter as well as the corresponding quarter of the previous year. This indicates that part of the growth in the near term could be driven by the need for scaling up inventories to normal levels. Data on corporate performance also point to the beginning of the turnaround in the inventory cycle (stock to sales ratio) since Q2 of 2009-10. Despite the low share of government consumption demand in aggregate demand (i.e., less than 10 per cent), the fiscal response to the crisis-induced slowdown in economic activities has been manifested in the form of significant growth in government expenditure in the recent quarters (Table 2.1). Combined Budgeted Government Finances: 2009-10 II.4 The key deficit indicators of the combined finances of the Central and State Governments are budgeted to be higher in 2009-10 than in 2008-09 (RE), reflecting the fiscal stimulus in the wake of the global financial crisis (Table 2.2). The total expenditure as per cent of GDP is budgeted to be higher than the previous year while revenue receipts are, budgeted to be lower, reflecting the economic slowdown and tax cuts to stimulate growth.
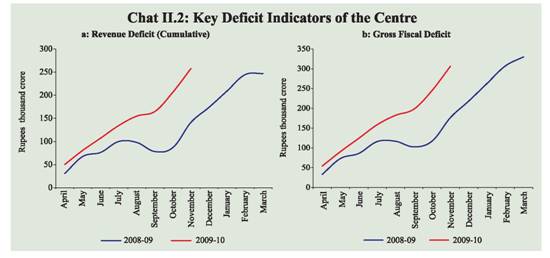
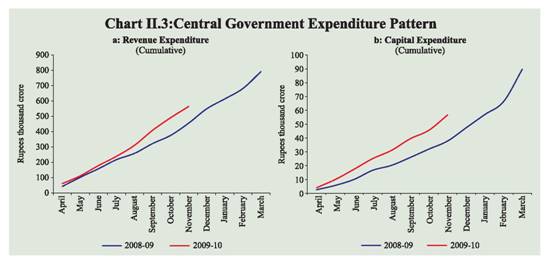
Centre’s Fiscal Situation II.5 According to the latest informCentre’s Fiscal Situationation available for the fiscal year 2009-10 (April-November), the revenue deficit and gross fiscal deficit (GFD) were placed significantly higher in absolute terms than in the corresponding period of the previous year, but were lower as per cent of budget estimates (Table 2.3 and Chart II.2). II.6 On the revenue front, less than half of the budgeted amount was mobilised during the first eight months of the fiscal year 2009-10 mainly on account of a decline in indirect tax revenue. While customs duty collections were affected by the continued fall in imports as well as zero duty on certain sensitive commodities, revenue from excise duties declined mainly on account of tax cuts. The improved performance of the manufacturing sector in recent months could be expected to have a salutary impact on excise duty collections during the remaining months of the year. Despite registering a higher growth in April-November 2009 than in April-November 2008, non-tax revenue, as a per cent of budget estimates, was lower during April-November 2009 than in the corresponding period of the previous year, as the auction of the third-generation (3-G) spectrum, the proceeds of which are budgeted to yield Rs.35,000 crore, has not yet taken place. Non-debt capital receipts during April-November 2009 exceeded the budget estimates on account of higher disinvestment proceeds (Rs.4,305 crore) than was budgeted (Rs.1,120 crore). II.7 On the expenditure side, despite sharp increases in defence revenue expenditure, pension and social service expenditure, total revenue expenditure decelerated during April-November 2009 as compared with the corresponding period of the previous year, mainly on account of decrease in major subsidies. While food subsidies increased by 39 per cent during April-November 2009, this was more than offset by the decline in fertiliser subsidies, in line with the fall in domestic and international prices. Capital expenditure registered a sharp increase during April-November 2009 as compared with the corresponding period of the previous year (Chart II.3). While defence capital outlay increased by 55 per cent during April-November 2009, non-defence capital outlay increased by 60 per cent, mainly on account of a steep increase in expenditure on railways. II.8 In the supplementary demand for grants in December 2009, the Central Government has taken approval for gross additional expenditure of Rs.30,943 crore, of which the net cash outgo will be Rs.25,725 crore. According to the Government, the additional expenditure is not expected to make significant variation in the total budgeted expenditure for 2009-10, as equivalent amount of savings would be realised from other grants. II.9 According to the Ministry of Finance, net direct tax collections increased by 8.5 per cent during April-December 2009 over the corresponding period of the previous year; the increase during the month of December 2009 was substantial at 24.5 per cent, driven by a 44.0 per cent increase in corporation tax collections. Collections under personal income tax, however, declined by 0.4 per cent during April- December 2009 (-19.8 per cent in the month of December 2009), largely on account of higher tax refunds. State Finances: 2009-101 II.10 The fiscal correction and consolidation process, witnessed at the State Government level before the onset of the global financial crisis, came under pressure in the light of significant moderation in economic activity during 2008-09 which required fiscal expansion to spur economic revival. The consolidated revenue account of the State Governments was therefore, budgeted to turn into deficit of 0.6 per cent of GDP during 2009-10 after remaining in surplus during the previous three years. As a result, GFD was budgeted to be higher at 3.4 per cent of GDP during 2009-10 as compared with 2.7 per cent in 2008-09 (RE). The consolidated primary deficit was budgeted to increase to 1.4 per cent of GDP in 2009-10 from 0.7 per cent in 2008-09 (RE). During 2009-10, State Governments have been allowed to raise additional market borrowings of 0.5 per cent of gross state domestic product (GSDP) for undertaking capital expenditure. However, the increase in the consolidated revenue expenditure is budgeted to be higher than that in capital expenditure during 2009-10, both in absolute terms as well as in terms of GDP. II.11 The deterioration in the revenue account of State Governments during 2008-09 (RE) and 2009-10 (BE) reflects the combined impact of sluggishness in own tax collections and devolution from the Centre coupled with higher expenditure commitments to implement the recommendations of the Sixth Pay Commission by majority of the State Governments. The widening of GFD would be mainly due to deterioration in the revenue account, coupled with an increase in net lending (loans extended by State Governments minus recoveries). Corporate Performance II.12 The first half of 2009-10 was a slow start for non-financial non-government companies which witnessed a fall in revenue over the previous year, primarily due toweak economic conditions and lower commodity prices. Net profit, however, increased both in the first and the second quarters of 2009-10, primarily due to a larger fall in expenditure relative to sales; significant deceleration in interest payments; lower foreign exchange related losses; and modest growth in other income (Table 2.4). II.13 Sequentially, improved volumes lifted up the aggregated sales of companies during Q2 of 2009-10 by more than 10 per cent over Q1. Furthermore, stock-in-trade to sales ratio, which was negative in the second half of 2008-09, turned positive in Q1 and Q2 of 2009-10, reflecting adjustments in inventory levels to changes in business demand. II.14 During Q2 of 2009-10, while the share of expenses on raw material consumption, including power and fuel, declined over the corresponding period of the previous year, it was higher than in Q1, as commodity prices started firming up. Likewise, interest payments, which had declined from the high base of the corresponding period of the previous year, rose over Q1, reflecting the increase in borrowings on account of rising economic activity as corroborated by increasing industrial production. Also, the contribution of other income in net profits for Q2 fell in comparison to the preceding quarter and corresponding quarter of the previous year, as income from non-core activities, which had increased moderately on a year-on-year (y-o-y) basis, declined over Q1, mainly on account of a fall in gains from foreign exchange transactions. As a result, the gross and net profit margins of select companies declined sequentially over the previous quarter, but improved substantially y-o-y. Sector-wise, the sequential pick-up in sales was more prominent for companies in the manufacturing sector vis-à-vis those in the services sector.
II.15 The persistence of deceleration in sales during the first half of 2009-10, despite the sequential recovery in the second quarter, pointed to weakness in aggregate demand. The turnaround in the inventory cycle since the second quarter, however, seems to support the industrial recovery. Partial data (small sample) for the third quarter of 2009-10 suggest that sales growth (y-o-y) has turned significantly positive. This lead indicator could be seen as further recovery in private demand, that could be expected to sustain the IIP recovery seen up to November 2009. External Demand II.16 Although both exports and imports declined in real terms during Q2 of 2009-10 over the previous quarter as well as the corresponding quarter of the previous year, there was sharper decline in imports (in real terms) than in exports. While net exports (goods and services) remained negative in the second quarters of both 2008-09 as well as 2009-10, there was an absolute increase of Rs.51,623 crore in net exports during Q2 of 2009-10 over Q2 of 2008-09. As a result, half of the growth in GDP (demand side) during Q2 of 2009-10 emanated from net exports (see Table 2.1). Information on net exports beyond the Q2 of 2009-10 could be partially obtained from the behavior of merchandise trade. Merchandise trade deficit during April-November 2009 stood at US $ 66.2 billion, which was lower by 33.9 per cent than US $ 100.2 billion in April-November 2008, due to the relatively larger decline in imports than exports during the period. A detailed discussion on the external demand conditions is set out in Chapter III. II.17 To sum up, aggregate demand as measured by GDP at market prices indicate that there has been a revival in both private consumption demand and investment demand in Q2 of 2009-10 after the deceleration witnessed since the second half of 2008-09. Government final consumption expenditure, which had moderated in Q1 of 2009-10, increased significantly in Q2. During April-November 2009, the key deficit indicators of the Central Government, viz., revenue deficit and fiscal deficit, as a proportion of budget estimates, were significantly lowerthan the corresponding period of the previous year. Corporate sector data indicate that although, on a y-o-y basis, sales growth has broadly remained flat during Q2 of 2009-10, there has been a significant improvement over the preceding quarter. Partial information for Q3 of 2009-10 suggest stronger growth in sales and turnaround in the inventory cycle, both supporting the acceleration in IIP growth. Net exports contributed significantly to GDP growth (demand side) during Q2 of 2009-10, despite being negative in absolute terms. 1 Based on the budget documents of 27 State Governments, of which two are vote-on-account. |
|||||||||||||||||||||||||||||||||||||||||||||||||||||||||||||||||||||||||||||||||||||||||||||||||||||||||||||||||||||||||||||||||||||||||||||||||||||||||||||||||||||||||||||||||||||||||||||||||||||||||||||||||||||||||||||||||||||||||||||||||||||||||||||||||||||||||||||||||||||||||||||||||||||||||||||||||||||||||||||||||||||||||||||||||||||||||||||||||||||||||||||||||||||||||||||||||||||||||||||||||||||||||||||||||||||||||||||||||||||||||||||||||||||||||||||||||||||||||||||||||||||||||||||||||||||||||||||||||||||||||||||||

Share this page:


Install the RBI mobile application and get quick access to the latest news!
Scan the QR code to install our app


Page Last Updated on:


