 IST,
IST,


II. Aggregate Demand
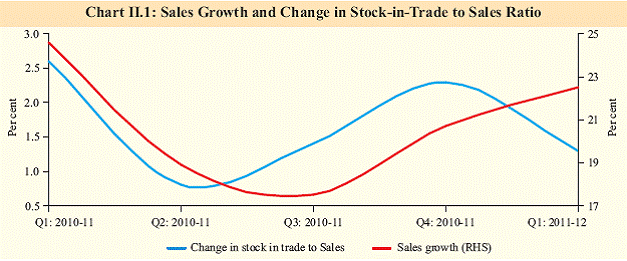
Of late, there are signs of aggregate demand softening reflecting a combination of factors including monetary tightening, hindrances to execution of projects and deteriorating business confidence. Corporate investment intentions in new projects declined sharply since Q3 of 2010-11 and remain subdued. Private consumption has started to dampen with rising interest rates, but is still reasonably strong. However, risks to demand management persist from overshooting of government expenditures. With investment falling more than anticipated, and consumption responding less than intended, there is a need to rebalance private as well as government spending from consumption towards investment to sustain potential output growth. Falling investment a concern as it lowers potential output II.1 There is growing evidence of investment decelerating. Information from the corporate sector, the banking system’s capex funding, housing transactions as well as falling construction activity suggest that investment has been adversely impacted. Project finance data received from 33 major banks/financial institutions also indicates a decline in investment intention in Q1 of 2011-12. During the quarter, 135 projects were sanctioned assistance amounting to about `80,300 crore as against 195 projects sanctioned assistance worth `1,42,800 crore during the corresponding quarter of the previous year. With corporate fixed investment having already declined in the second half of 2010-11, a further drop this year could reduce the pipeline investment in 2012- 13 and impact potential growth ahead. II.2 Some softening in investment demand was anticipated with significant monetary policy tightening since February 2010. However, the fall was aggravated by a combination of factors. Non-monetary factors, such as hindrances to execution and uncertainty about the global economy appear to have significantly impacted investment climate. There are risks of global factors causing further erosion in investment levels. Investment in the power sector has been impacted by concerns relating to coal supply and financials of State Electricity Boards. However, improvements in execution could see road investments pick up ahead as the National Highways Authority of India tendering is proceeding at an impressive rate in the current year. External demand likely to weaken II.3 Aggregate demand may remain weak in the second half of 2011-12 as external demand is likely to weaken as a result of slowing global economy. Despite an increase in the growth rate of net exports (as against a contraction in the previous two quarters), the contribution of net exports to aggregate demand reduced even further in the first quarter of 2011-12. The deterioration in the global economy in the recent period and the growing uncertainty in the euro area could adversely impact export demand going forward. GDP growth improves even as private consumption growth moderates II.4 Expenditure-side GDP estimates showed an improvement in growth during Q1 of 2011- 12. Real GDP growth at market prices improved to 8.5 per cent during Q1 of 2011-12 compared with 7.7 per cent observed in the previous quarter, solely on account of the investment component. Even so, the growth rates of GDP at market prices and all its components were lower in Q1 of 2011-12 than in the corresponding quarter of the previous year (Table II.1). II.5 Private final consumption expenditure (PFCE), the largest component of aggregate demand, moderated during the first quarter of 2011-12. The moderation in PFCE growth is mainly due to tapering of demand in interest rate sensitive sectors. This is evident in the slackening of growth in the consumer durables segment of the IIP and, in particular, the dip in the sales of passenger cars in recent months, reflecting the combined impact of persistent inflationary pressures and monetary policy actions. These factors seemed to neutralise the impact of improved agriculture performance on rural demand. Government final consumption expenditure also moderated in Q1 of 2011-12. Sales growth remains healthy though profits are under pressure II.6 There was sustained growth in sales of select non-financial non-government companies in Q1 of 2011-12 reflecting strong demand, the deceleration in consumption notwithstanding. Also, accumulation of stock-in-trade as percentage of sales was lower in Q1 of 2011- 12 as compared to that of the same period previous year and the preceding quarter (Table II.2 and Chart II.1). However, OBICUS showed that finished goods as well as raw material inventories increased during Q1 of 2011-12. Despite sustained growth in sales, there was lower growth in net profits compared with the previous three quarters, largely on account of higher input costs. Profit margins shrank and interest payments formed 2.8 per cent of sales and 21.7 per cent of gross profits in Q1 of 2011-12. II.7 In Q1 of 2011-12, large companies (sales greater than `1,000 crore) reported the highest growth in sales at 24.8 per cent, while their net profits rose by 8.5 per cent. In contrast, small companies (sales less than `100 crore) registered decline in sales but registered 14.5 per cent growth in net profits. Profit margins of all companies – large, medium and small – dipped compared to the corresponding quarter of 2010-11.
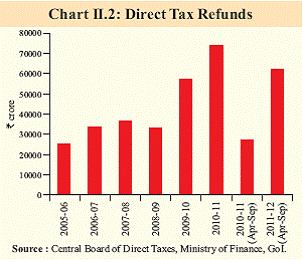
II.8 In terms of sectoral breakdown, sales of manufacturing companies were higher at 25 per cent compared to those of IT companies (19 per cent) and companies in the services sector (14 per cent). While profit margins of manufacturing and non-IT services companies dipped in Q1 of 2011-12 compared with the corresponding quarter of last year, it remained the same for IT companies. II.9 Early results of 161 companies for Q2 of 2011-12 suggest that sales growth remains healthy. With support from other income, the growth in net profits is maintained (Table II.3). Fiscal slippages may complicate the task of aggregate demand management II.10 The Central government’s key deficit indicators have widened during 2011-12 (April- August) in comparison with the levels during the corresponding period of the previous year. The deficit continues to be higher during 2011- 12 (April-August) even when adjusted for receipts from spectrum auctions during 2010- 11 (April-August) in excess of the budgeted amount. The wider fiscal imbalances during the year so far reflect a sharp deceleration in tax revenues. The Centre’s quarterly analysis of its own finances attributes the deceleration in tax revenue to frontloading of direct tax refunds, aimed at reducing the pendency of claims in the current year (Chart II.2). The higher recovery of loans and decline in capital expenditure, however, contained the deterioration in gross fiscal deficit (GFD) relative to that in revenue deficit (RD) (Table II.4).
II.11 Current indications are that the Central government’s deficit targets for 2011-12 will be breached. The fiscal position during the course of the year will be shaped by the eventual growth outcome and its impact on tax revenues as well as the government’s commitment towards controlling expenditure, especially nonplan revenue expenditure. Although total expenditure growth was lower during 2011-12 (April-August) than in the corresponding period of 2010-11, it remained above the budgeted growth. Furthermore, expenditure pressures from petroleum subsidies are yet to be fully accounted for in Central government finances during the year so far. The first instalment of supplementary demand for grants of the Central government presented in August 2011 did not provide for the additional allocation that may be required for petroleum subsidies.
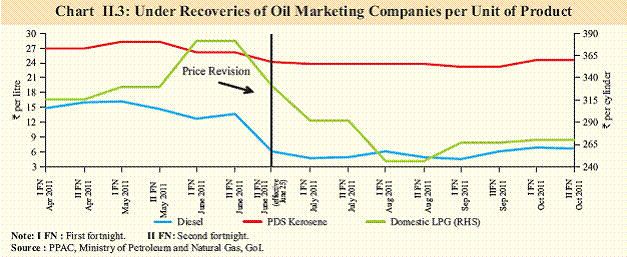
II.12 These expenditure pressures, particularly on the revenue account, could partially offset the impact of demand compression. The previous quarter release of this Report had cautioned about the likelihood of fiscal slippage in 2011-12. There is a possibility of Central government missing its disinvestment target, which would add to the pressures of achieving the budgeted fiscal deficit for 2011-12. The Central government has announced an additional borrowing of nearly `53,000 crore in the second half of 2011-12, taking into account the shortfall in other sources of financing of fiscal deficit, mainly National Small Savings Fund (NSSF) and lower than budgeted opening cash balance. Subsidies likely to overshoot budget estimates II.13 During 2011-12 (April-August), the growth in major subsidies, excluding compensation to Oil Marketing Companies (OMCs) for under-recoveries, was 1.5 per cent as against a decline budgeted for the year as a whole. Non-plan expenditure of the Ministry of Petroleum and Natural Gas which includes compensation to OMCs for under-recoveries registered y-o-y growth of 42 per cent during the period. According to the Petroleum Planning and Analysis Cell (PPAC), the under-recoveries reported by OMCs for the first half of 2011-12 amounted to `64,900 crore. The per unit underrecovery on sale of petroleum products has been firming up since mid-September 2011, in line with the weakening of the rupee notwithstanding some interim decline in global crude oil prices (Chart II.3). II.14 Based on the current assessment of underrecoveries of OMCs for 2011-12 as a whole, expenditure on petroleum subsidies could range between 0.74 per cent and 0.87 per cent of GDP depending on the extent of burden sharing by the Central government as compared with the budget estimate of 0.26 per cent of GDP for 2011-12. The subdued growth in revenue receipts may pose a risk of spillover of the current year’s petroleum subsidy burden to the next year. On the other hand, if the international crude oil prices decline in response to sluggish global demand, the under-recoveries may be contained, easing the petroleum subsidy burden. II.15 There are further upside risks to GFD on account of revenue shortfall for the Centre of around 0.29 per cent of GDP due to changes in the duty structure of petroleum products. Similarly, there are signs of pressures emerging in respect of expenditures on fertiliser subsidies, evident from the data on Central government finances during April-August 2011.
State finances expected to remain on track II.16 The States resumed fiscal consolidation in
2010-11 and have budgeted to carry it forward
during 2011-12. At a consolidated level, the
revenue account is budgeted to turn into surplus
in the current year after remaining in deficit
during the previous two years and the GFDGDP
ratio is expected to decline further (Table
II.5). The fiscal correction in 2011-12 is
expected primarily on the basis of budgeted
decline in revenue expenditures. It may be noted that 12 States announced reduction in rates of
value added tax (VAT) on petroleum products
during June-July 2011 to provide relief to the
consumers in the wake of upward revision in II.17 The small savings collections under NSSF witnessed a net outflow of `5,485 crore during April-August 2011 as against a net inflow of `25,291 crore during the corresponding period of the previous year. This has affected NSSF’s contribution to financing State governments’ GFD. As a result, State governments’ reliance on market borrowings during 2011-12 (April- September) was higher than a year ago. The surplus cash balances of State governments invested in the Central government’s Treasury Bills as on October 14, 2011 were, however, higher than a year ago.
Need to rebalance government spending to support investment II.18 The sharp slowdown in investment can affect growth going forward. Hindrances to execution of projects and problems relating to land acquisition seem to be affecting investor sentiments. Consumption demand has started to fall for interest rate sensitive sectors, but this is in line with the near-term policy objective of dampening inflation. Given the growth outlook, there is a risk of not meeting the tax collection target. With oil prices remaining at elevated levels, the subsidy burden of the Government is expected to be much higher than budgeted. Hence, the process of fiscal consolidation is likely to suffer a setback. Fiscal slippage would further complicate management of aggregate demand. A possible crowding out of private investment will pose stronger downside risks to growth. This can be addressed by rebalancing government spending from consumption to investment at this critical juncture and by putting in place complementary policies to support investment. * : Despite well-known limitations, expenditure side GDP data are being used as proxies for components of Aggregate Demand. |
||||||||||||||||||||||||||||||||||||||||||||||||||||||||||||||||||||||||||||||||||||||||||||||||||||||||||||||||||||||||||||||||||||||||||||||||||||||||||||||||||||||||||||||||||||||||||||||||||||||||||||||||||||||||||||||||||||||||||||||||||||||||||||||||||||||||||||||||||||||||||||||||||||||||||||||||||||||||||||||||||||||||||||||||||||||||||||||||||||||||||||||||||||||||||||||||||||||||||||||||||||||||||||||||||||||||||||||||||||||||||||||||||||||||||||||||||||||||||||||||||||||||||||||||||||||||||||||||||||||||||||||||||||||||

Share this page:


Install the RBI mobile application and get quick access to the latest news!
Scan the QR code to install our app


Page Last Updated on:


