 IST,
IST,
II. Aggregate Demand
Most components of aggregate demand slowed down in 2011-12. Investment, as noted in aggregate capital formation as well as corporate investment intentions, has been drying up and is expected to start improving slowly in 2012-13. Net export demand dipped reflecting global slowdown. However, firmer oil prices have dented government’s fiscal numbers due to high fuel subsidies and in the absence of price adjustment, added to the aggregate demand in 2011-12. While the Union Budget for 2012-13 has enunciated a commitment to cap subsidies, any slippage in the fiscal deficit numbers will have implications for demand management and could come in the way of reviving investment. Investment downswing in conjunction with net exports drags down demand II.1 Capital formation in the economy dipped during April-December 2011. This reflects in part, the lagged impact of the anti-inflationary monetary policy stance. Net exports also declined, particularly in Q3, reflecting an adverse base effect as well as a higher outgo on imports due to rupee depreciation (Table II.1). Given the Advance Estimates of the expenditure- side growth rates for 2011-12, the implicit growth rates of private consumption expenditure and gross fixed capital formation during Q4 of 2011-12, show a marked increase over the corresponding period of the previous year. While consumption would benefit from the dip in inflation and also election-related spending in a few states, investment should improve largely on account of the base effect. This further validates growth having bottomed out in Q3.
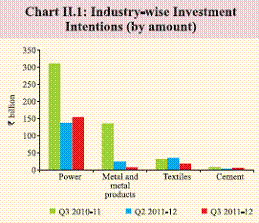
Decline in savings and investment rates a concern II.2 Both investment and saving rates declined in 2010-11 (Table II.2). The decrease in the overall savings rate in 2010-11 was due to both households and the private corporate sector, which more than offset the improvement in the public sector savings rate. The household sector savings rate declined in 2010-11, after touching a record high in 2009-10. Within household savings, while the financial savings rate declined sharply, the physical savings rate increased in 2010-11. The decline in the net financial savings rate was on account of the slower growth in households’ savings in bank deposits and life insurance as well as an absolute decline in investment in shares and debentures, mainly driven by redemption of mutual fund units. Even so, there was a shift in favour of small savings and currency during the year. II.3 The decline in the rate of gross domestic capital formation (investment) in 2010-11 was on account of a decline in private corporate sector and public sector investment rates even as the household investment rate increased. Given the huge demand for infrastructure development as well as extremely strained capacity in sectors such as petroleum refinery, there is a compelling case for increasing the rate of capital formation in the economy, both in construction and in machinery and equipment. Going forward, the revival and sustainability of a high growth rate over the medium-term is contingent upon the enhancement of savings and investment rates, besides improvements in productivity. Corporate investment remains subdued II.4 Corporate pipeline investment has shrunk and new investment remains tepid. As such, investment revival is expected to materialise slowly in 2012-13. Analysis of the time-phasing details of projects sanctioned institutional assistance in various years reveals that intended capital expenditure incurred by private corporate (non-financial) sector during 2011-12 is likely to be lower than that in the previous year (Table II.3). Higher interest rates and rising input prices, among other factors, are likely to have adversely affected the investment sentiment. II.5 The deceleration in capital formation is apparent in the sharp moderation in the number/ outlay of projects sanctioned finance by major banks/financial institutions (FIs). The moderation that started in Q3 of 2010-11 has persisted through Q3 of 2011-12 (Table II.4). The decline in outlay/projects that were sanctioned financial assistance is particularly acute for ‘metal and metal products’ and power industries (Chart II.1).
Corporate profitability hit by high interest expenses and rising input costs II.6 While sales continued to be healthy during Q3 of 2011-12, registering higher growth on both y-o-y and q-o-q basis, operating profit and net profit declined as expenses and interest cost increased substantially (Tables II.5 and II.6). Net profits were further dented on account of the large non-operating deficit of a few large companies.
II.7 The ratio of stock-in-trade to sales was higher in Q3 of 2011-12 compared to the corresponding period of the previous year and the preceding quarter (Chart II.2). The accumulation of inventory in Q3 was mainly observed in chemical fertilisers and pesticides, iron and steel, refineries and food products and beverages industries.
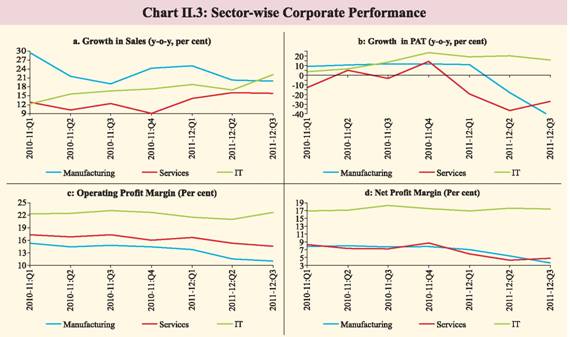
II.8 Sector-wise analysis shows that Information Technology (IT) was the best performing sector in terms of sales and operating profit. Hence, the net profit margin of the sector remained largely intact (Chart II.3). This mainly reflected the depreciation of the rupee. Higher growth in input prices and interest payments led to a decline in profits for both manufacturing and services sectors. Significant budgeted reduction in fiscal deficit for 2012-13 needs to be supported by credible fiscal consolidation strategy II.9 The central government could not contain its fiscal deficit within the budget estimates for 2011-12, resulting in the widening of the gross fiscal deficit (GFD)-GDP ratio to 5.9 per cent. The fiscal situation is, however, budgeted to record a significant improvement in terms of both revenue deficit and GFD indicators in 2012-13. The fiscal correction, as indicated in the Union Budget, along with other policy measures to address supply-side bottlenecks in agriculture, energy and transport sectors, are expected to create conditions for revival of investment activity in the economy.
II.10 It may be noted that the proposed fiscal consolidation in 2012-13 is primarily based on the revenue-raising efforts of the central government. The achievement of budgeted reduction in GFD-GDP ratio would also depend on the commitment of the government to contain its expenditure on subsidies within the stipulated cap of 2 per cent of GDP in 2012-13. II.11 The amendment of the FRBM Act, 2003 and introduction of a Medium-term Expenditure Framework Statement in the Act, which will, inter alia, include three-year rolling targets in respect of expenditure indicators, is expected to bring about fiscal discipline and create the fiscal space essential for the government to pursue its objective of a faster, sustainable and more inclusive growth during the Twelfth Plan. Notwithstanding the envisaged fiscal correction, the key deficits will remain higher than the path set out by the 13th Finance Commission (Table II.7). Budgeted tax buoyancy for 2012-13 reflect tax measures but is subject to downside risks II.12 Given the slowdown in 2011-12 as well as tax changes introduced earlier, both direct and indirect tax revenues grew at a lower rate than the budgeted rate for the year as well as the rate in 2010-11 (Table II.8). On the basis of tax measures announced in the Union Budget 2012-13, viz., widening the base of services tax through stipulating a negative list of exempted categories, partial rollback of reductions in standard excise duty and service tax rates, and the rationalisation of customs duty rates, tax buoyancy is budgeted at 1.39 for 2012-13. This is significantly higher than the long-term average tax buoyancy of 1.11 for the period 2003-04 to 2011-12 as well as the average of 1.14 for the recent period 2010-11 to 2011-12.
Commitment to cap subsidy expenditure from 2012-13 onwards a positive step II.13 As noted in the Union Budget for 2012- 13, overshooting of expenditure on subsidies was one of the main reasons for deterioration of fiscal balance in 2011-12. The expenditure restructuring strategy in 2012-13 is premised on capping expenditure on subsides while raising allocations for capital expenditures (both plan and non-plan components). Restricting expenditure on subsidies to below 2 per cent of GDP in the coming years would be a major achievement towards fiscal consolidation. II.14 There are latent pressures on the expenditure side of the central government finances for 2012-13. On the petroleum subsidy front, upside risks stem from high international crude oil prices and pressures on the exchange rate. Unless the government progresses towards phasing-in flexible pricing of administered petroleum products in the early part of the year, the risk to budget projections remain substantial. If prices for these products are not adjusted upwards, the under-recoveries in 2012-13 would well exceed that in 2011-12. This will lead to a large fiscal slippage. II.15 Also, the budgeted growth of 3 per cent in food subsidies in 2012-13 appears to be modest when viewed in the context of the implemention of the Food Security Bill (Table II.9).
Increasing dependence on market borrowing for financing fiscal deficit could exert pressure on interest rates II.16 The fiscal deficit financing pattern for 2012-13 shows continued reliance on market borrowings though the recourse to short-term financing through treasury bills is budgeted at 2 per cent, significantly lower than the 22 per cent in 2011-12 (Table II.10). The larger market borrowing of the central government could put pressure on yields, especially at the long end. Such pressures could exacerbate considerably if credit demand picks up with recovery in growth, increasing the interest burden on the government and crowding out private investment. Economic recovery hinges on credible fiscal consolidation, inflation control and higher capital formation II.17 Even though investment spending floundered in 2011-12, a slow recovery could set in during 2012-13. The recovery would be dependent on inflation not accelerating again. On current assessment, investment should start picking up at a moderate pace, especially if the cost of capital comes down. Rigidities in funding costs for the banks and the large draft of the government on financial surplus of the households, however, impart stickiness to interest rates. II.18 The Indian economy maintained a reasonable consumption-fixed investment mix, during the 4-year period beginning 2004-05. However, in recent years the consumption component has been the predominant driver of growth, with the contribution of the fixed investment component showing a sharper decline from the pre-crisis (2005-08) levels. Deceleration in investment reduces the potential output of the economy, emphasising the importance of rebalancing. High levels of government spending do provide a consumption stimulus but compound the inflationary situation. Reigning in inflation through tight monetary policy assumes importance in promoting sustainable growth and investment, even if it results in high cost of capital in the short run.
II.19 In this context, it is important to note that fiscal consolidation as envisaged in the latest budget is subject to risks, especially with respect to subsidies. Tax revenues may also be adversely affected if the economic climate remains subdued. The indirect tax measures introduced in the budget will themselves have inflation implications. Against this backdrop, aggregate demand management poses challenges for policy during 2012-13. * Despite well-known limitations, expenditure-side GDP data are being used as proxies for components of Aggregate Demand. |
||||||||||||||||||||||||||||||||||||||||||||||||||||||||||||||||||||||||||||||||||||||||||||||||||||||||||||||||||||||||||||||||||||||||||||||||||||||||||||||||||||||||||||||||||||||||||||||||||||||||||||||||||||||||||||||||||||||||||||||||||||||||||||||||||||||||||||||||||||||||||||||||||||||||||||||||||||||||||||||||||||||||||||||||||||||||||||||||||||||||||||||||||||||||||||||||||||||||||||||||||||||||||||||||||||||||||||||||||||||||||||||||||||||||||||||||||||||||||||||||||||||||||||||||||||||||||||||||||||||||||||||||||||||||||||||||||||||||||||||||||||||||||||||||||||||||||||||||||||||||||||||||||||||||||||||||||||||||||||||||||||||||||||||||||||||||||||||||||||||||||||||||||||||||||||||||||||||||||||||||||||||||||||||||||||||||||||||||||||||||||||||||||||||||||||||||||||||||||||||||||||||||||||||||||||||||||||||||||||||||||||||||||||||||||||||||||||||||||||||||||||||||||||||||||||||||||||||||||||||||||||||||||||||||||||||||||||||||||||||||||||||||||||||||
Page Last Updated on:


