II. Fiscal Situation - RBI - Reserve Bank of India
II. Fiscal Situation
Combined Government Finances
Centre’s Fiscal Position
State Finances
Financing Patterns
Public Debt
The Fiscal Outlook
The budgets for the year 2002-03 placed the combined gross fiscal deficit of the Centre and States at 9.5 per cent of GDP as against 10.3 per cent in the revised estimates for 2001-02. The combined gross primary and revenue deficits were placed at 3.1 per cent and 6.2 per cent of GDP, respectively, as compared with 4.0 per cent and 7.0 per cent in the revised estimates for 2001-02. The reduction in the deficits was sought to be achieved primarily through higher revenue mobilisation.
The Union budget for 2002-03 had envisaged ongoing fiscal consolidation through higher growth in revenue (15.3 per cent) and a relatively moderate growth (12.6 per cent) in aggregate expenditure. In the revised estimates for 2002-03, all the key deficit indicators were placed higher than their budgeted levels despite a decline in aggregate expenditure (Table 7). The deterioration was mainly due to shortfalls in revenue receipts and significantly lower disinvestment proceeds in relation to budgetary projections.
Table 7 : Deficit Indicators of the Centre |
|||||
(Rupees crore) |
|||||
|
|
|||||
2001-02 |
2002-03 |
2002-03 |
Variation (4 over 3) |
||
(BE) |
(RE) |
Rupees crore |
Per cent |
||
|
|
|||||
1 |
2 |
3 |
4 |
5 |
6 |
|
|
|||||
Gross Fiscal Deficit |
1,40,955 |
1,35,524 |
1,45,466 |
9,942 |
7.3 |
(6.1) |
(5.3) |
(5.9) |
|||
Revenue Deficit |
1,00,162 |
95,377 |
1,04,712 |
9,335 |
9.8 |
(4.3) |
(3.8) |
(4.3) |
|||
Gross Primary Deficit |
33,495 |
18,134 |
29,803 |
11,669 |
64.3 |
(1.5) |
(0.7) |
(1.2) |
|||
|
|
|||||
BE: Budget Estimates; RE: Revised Estimates. |
|||||
Revenue receipts declined from their budgeted level due to a gap of 5.1 per cent in tax collection. Barring customs duties, all the major taxes fell short of the budget estimates (Chart 14).
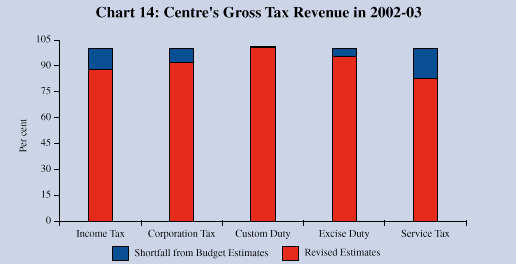
Non-tax revenue registered a marginal increase over the budget estimates. Disinvestment proceeds at Rs.3,360 crore were substantially lower than the target of Rs.12,000 crore. Non-debt capital receipts (disinvestment and recoveries) accounted for 12.9 per cent of total capital receipts. The rest was contributed by debt receipts (Table 8).
Table 8 : Total Receipts of the Centre |
|||||
(Rupees crore) |
|||||
|
|
|||||
2001-02 |
2002-03 |
2002-03 |
Variation (4 over 3) |
||
(BE) |
(RE) |
Rupees crore |
Per cent |
||
|
|
|||||
1 |
2 |
3 |
4 |
5 |
6 |
|
|
|||||
Total Receipts |
3,62,453 |
4,10,309 |
4,04,013 |
-6,296 |
-1.5 |
(15.8) |
(16.0) |
(16.4) |
|||
Revenue Receipts |
2,01,449 |
2,45,105 |
2,36,936 |
-8,169 |
-3.3 |
(8.8) |
(9.6) |
(9.6) |
|||
Tax Revenue |
1,33,662 |
1,72,965 |
1,64,177 |
-8,788 |
-5.1 |
(5.8) |
(6.8) |
(6.7) |
|||
Non-Tax Revenue |
67,787 |
72,140 |
72,759 |
619 |
0.9 |
(3.0) |
(2.8) |
(3.0) |
|||
Capital Receipts |
1,61,004 |
1,65,204 |
1,67,077 |
1,873 |
1.1 |
(7.0) |
(6.5) |
(6.8) |
|||
|
|
|||||
BE: Budget Estimates; RE: Revised Estimates. |
|||||
Aggregate expenditure in the revised estimates for 2002-03 was lower by 1.5 per cent than the budget estimates. Expenditure reduction was solely in non-Plan expenditure on account of reduced grants and loans to States and Union Territories (UTs) due to non-utilisation of the ‘Fiscal Incentive Fund’, lower defence capital expenditure, reduced interest payments due to decline in interest rates on Government securities and reduction in pension expenditure. Plan expenditure showed a marginal rise of Rs.589 crore (Table 9).
Table 9 : Aggregate Expenditure of the Centre |
||||||
(Rupees crore) |
||||||
|
|
||||||
2001-02 |
2002-03 |
2002-03 |
Variation (4 over 3) |
|||
(BE) |
(RE) |
Rupees crore |
Per cent |
|||
|
|
||||||
1 |
2 |
3 |
4 |
5 |
6 |
|
|
|
||||||
Total Expenditure |
3,62,453 |
4,10,309 |
4,04,013 |
-6,296 |
-1.5 |
|
(1+2=3+4) |
(15.8) |
(16.0) |
(16.4) |
|||
1. |
Non-Plan Expenditure |
2,61,259 |
2,96,809 |
2,89,924 |
-6,885 |
-2.3 |
of which: |
(11.4) |
(11.6) |
(11.8) |
|||
Interest Payments |
1,07,460 |
1,17,390 |
1,15,663 |
-1,727 |
-1.5 |
|
(4.7) |
(4.6) |
(4.7) |
||||
Defence |
54,266 |
65,000 |
56,000 |
-9,000 |
-13.8 |
|
(2.4) |
(2.5) |
(2.3) |
||||
Subsidies |
31,207 |
39,801 |
44,618 |
4,817 |
12.1 |
|
(1.4) |
(1.6) |
(1.8) |
||||
2. |
Plan Expenditure |
1,01,194 |
1,13,500 |
1,14,089 |
589 |
0.5 |
(4.4) |
(4.4) |
(4.6) |
||||
3. |
Revenue Expenditure |
3,01,611 |
3,40,482 |
3,41,648 |
1,166 |
0.3 |
(13.1) |
(13.3) |
(13.9) |
||||
4. |
Capital Expenditure |
60,842 |
69,827 |
62,365 |
-7,462 |
-10.7 |
(2.6) |
(2.7) |
(2.5) |
||||
|
|
||||||
BE: Budget Estimates; RE: Revised Estimates. |
||||||
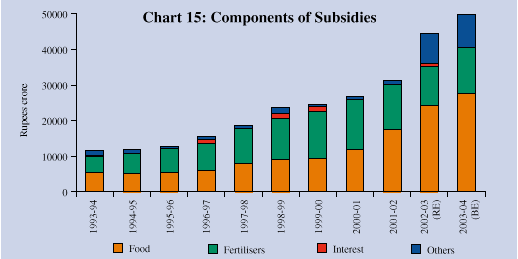
Expenditure on subsidies increased over the budget estimates. Almost 83 per cent of the rise was accounted for by food and indigenous fertiliser subsidies. Total subsidies have shown a rising profile since the early 1990s mainly driven by food subsidy. Fertiliser subsidy has stabilised since 2000-01 (Chart 15). With the abolition of the Administered Price Mechanism in the petroleum sector and cessation of the oil pool account, petroleum subsidies now have to be provided for explicitly in the Union Budget, starting in 2002-03.
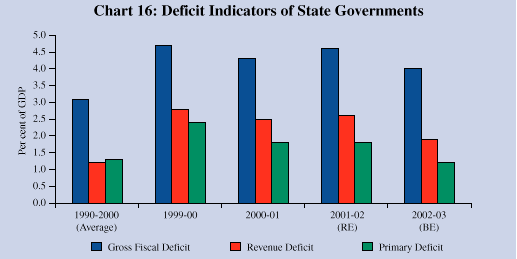
The finances of State Governments during 2002-03 were budgeted to improve over the previous year with the revenue deficit placed at 1.9 per cent of GDP (2.6 per cent in the revised estimates (RE) for 2001-02), the gross fiscal deficit at 4.0 per cent (4.6 per cent in 2001-02 RE) and the primary deficit at 1.2 per cent (1.8 per cent in 2001-02 RE) (Chart 16).
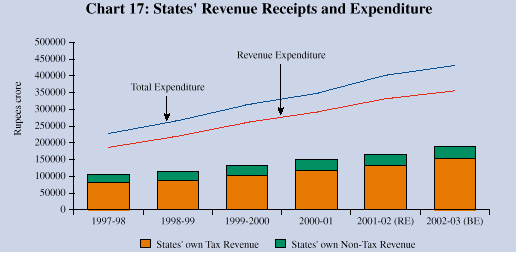
During 2002-03, revenue receipts were budgeted to rise by 13.3 per cent (Chart 17). States’ own revenue receipts (revenue receipts minus sharable taxes and grants) were expected to finance 53.6 per cent of revenue expenditure and 44.2 per cent of the aggregate expenditure. The total expenditure of States was budgeted to grow by 7.3 per cent, significantly lower than 15.7 per cent in the previous year.
Details regarding the fiscal performance of States vis-a-vis budgetary projections for 2002-03 are not yet available. The budgets of States continue to emphasise fiscal consolidation through expenditure management, revenue augmentation and restructuring of public sector undertakings. Institutional reforms proposed in the State budgets aim at fiscal stability and sustainability. Several States have already finalised their Medium Term Fiscal Reforms Plans (MTFRP), while a few States have initiated measures to provide statutory backing to the fiscal reform process through enabling legislation. States have also focused on development of infrastructure, including encouragement to private investment in infrastructure projects and promotion of growth enhancing sectors like information technology and agro-based industries.
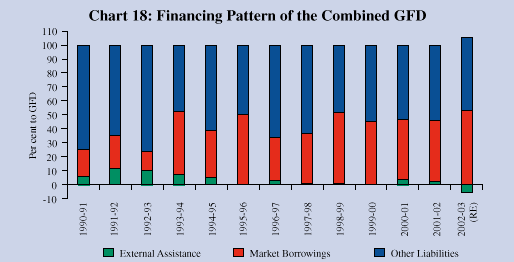
The financing pattern of fiscal deficits has undergone shifts since the 1990s. Among the domestic sources of financing which generally constitute 99 per cent of the combined gross fiscal deficit (GFD) of the Centre and States, the share of market borrowings rose from 19.7 per cent in 1990-91 to 53.0 per cent in 2002-03. The share of other domestic financing items including small savings, provident funds, deposits, reserve funds and others underwent a corresponding decline from 74.4 per cent to 52.7 per cent (Chart 18). In particular, the share of small savings and provident funds taken together has contracted in recent years. The share of external finance declined sharply from 11.8 per cent in 1991-92 to barely 2.4 per cent in 2001-02. Large repayments (inclusive of prepayment) resulted in net outflows under external assistance in 2002-03 (-5.7 per cent of GFD).
Financing of the Union Budget
Gross market borrowings of the Centre were budgeted at Rs.1,42,867 crore and net market borrowings at Rs.95,859 crore for 2002-03. The revised estimates for 2002-03 have placed the net borrowings at Rs.1,12,865 crore which exceeded the budget estimates by 17.7 per cent.
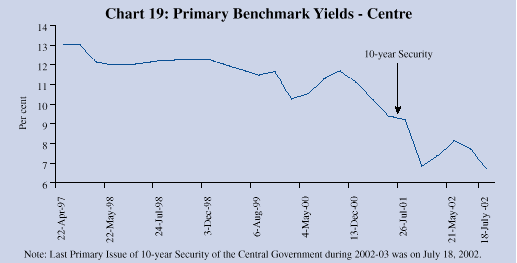
The Reserve Bank continued its practice of combining auctions with private placement to avoid strain on yields. Comfortable liquidity conditions enabled a decline in the interest rates on market borrowings by the Centre after May 2002 (Chart 19). The yield on the 10-year benchmark security in the primary market declined to 6.72 per cent by July 18, 2002.
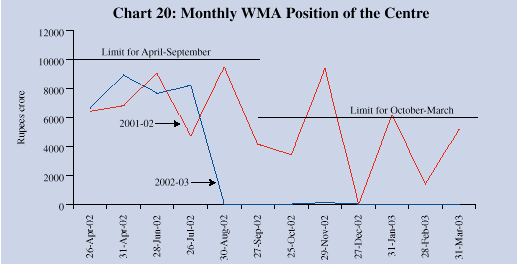
The agreed limits on the Centre’s Ways and Means Advances (WMA) from the Reserve Bank for the first and second halves of 2002-03 were fixed at Rs.10,000 crore (April-September) and Rs. 6,000 crore (October-March), the same as in the previous year. The average utilisation of WMA at Rs.4,182 crore during 2002-03 was lower than in the previous year (Chart 20).
Financing of State Budgets
The gross and net market borrowings allocated to States in 2002-03 (including additional allocation of Rs.10,000 crore under the debt-swap scheme) amounted to Rs.30,933 crore and Rs.29,144 crore, respectively. States raised Rs.30,853 crore of which Rs.27,880 crore (90.4 per cent) was raised through tap issues at coupon rates between 6.6 – 7.8 per cent and Rs.2,973 crore (9.6 per cent) through auctions at interest rates ranging between 6.7 - 8.0 per cent. States that raised funds through auction were Andhra Pradesh (Rs.545 crore), Gujarat (Rs.445 crore), Jammu and Kashmir (Rs.70 crore), Karnataka (Rs.200 crore), Kerala (Rs.445 crore), Madhya Pradesh (Rs.247 crore), Maharashtra (Rs.509 crore), Punjab (Rs.85 crore), Tamil Nadu (Rs.275 crore) and West Bengal (Rs.153 crore).
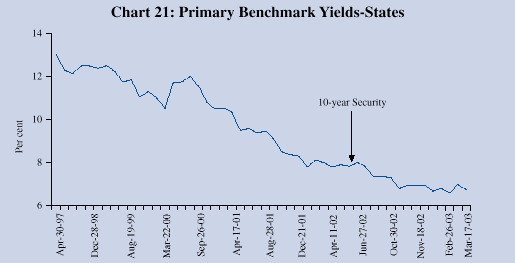
The average interest rate on market borrowings of States has declined continuously in recent years. During 2002-03, the interest rate on market borrowings remained in the range of 6.6 - 8.0 per cent as compared with 11.5 per cent in case of loans from the Centre (Plan loans) and 10.5 per cent on loans against small saving collections. The coupon rate for the tap tranche held in August 2002 was fixed 50 basis points over the then prevailing yield on Government of India (GoI) 10-year security. In the tranche conducted in December 2002, the spread was lower at 37 basis points over the yield on GoI 10-year security. The yield on primary issue of 10-year security fell to 6.75 per cent on March 17, 2003 from a peak of 8.0 per cent on April 11, 2002 (Chart 21).
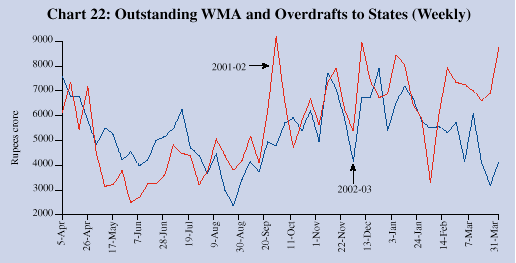
The outstanding WMA and overdrafts of State Governments was lower by 52.9 per cent at Rs.4,128 crore as at end-March 2003 as compared with the outstanding amount of Rs.8,758 crore as at end-March 2002 (Chart 22). The revised scheme of WMA 2003 has been implemented with effect from March 1, 2003.
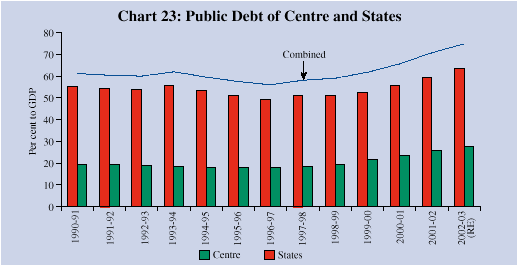
The combined debt-GDP ratio of the Centre and States is estimated to have risen to 75.3 per cent in 2002-03 (Chart 23). During the year, the weighted average maturity of government securities was lower at 13.8 years as compared with 14.3 years in the previous year. The weighted average coupon rate also fell to 7.34 per cent from 9.44 per cent in the preceding year. There was an issue of floating rate bonds on July 2, 2002 with the rate linked to the 364-day treasury bill rate with a mark-up of 34 basis points.
Information on the outlook for State finances would become available by August 2003. The Union budget 2003-04 aims to pursue fiscal consolidation through expenditure reprioritisation and revenue augmentation. With moderate growth rates of 7.2 per cent in revenue receipts and 8.6 per cent in aggregate expenditure, all major deficit indicators are expected to be lower as proportions to GDP in 2003-04 as compared with the revised estimates for 2002-03 – the gross fiscal deficit at 5.6 per cent of GDP, the revenue deficit at 4.1 per cent and the primary deficit at 1.1 per cent.
Under revenue receipts, tax revenue is projected to increase by 12.2 per cent; consequently, the gross tax-GDP ratio of the Central Government would show a modest rise to 9.2 per cent during 2003-04 from 9.0 per cent in the revised estimates for 2002-03. As regards aggregate expenditure, revenue expenditure is budgeted to grow by 7.2 per cent, while capital expenditure would be higher by 16.4 per cent (Table 10). Non-Plan revenue expenditure would account for 79.0 per cent of the revenue expenditure. Among the major non-Plan revenue expenditure items, interest payments, defence expenditure and subsidies taken together would account for 75.2 per cent of non-Plan revenue expenditure and would absorb 85.6 per cent of revenue receipts. The interest payments alone would pre-empt 48.5 percent of the revenue receipts in 2003-04. Non-Plan capital expenditure would account for 39.2 per cent of the total capital expenditure in 2003-04 and would rise by 35.8 per cent. Plan capital expenditure is budgeted to rise by 6.5 per cent during 2003-04.
Net market borrowings are budgeted lower at Rs.1,07,194 crore for 2003-04 than Rs.1,12,865 crore in the revised estimates for 2002-03. Net market borrowings would finance 69.8 per cent of the GFD (as against 77.6 per cent in the revised estimates for 2002-03). Inclusive of repayments, the gross market borrowings for 2003-04 are placed at Rs.1,66,230 crore. The debt-GDP ratio of the Centre is budgeted to rise to 64.9 per cent by the end of fiscal year 2003-04 as against 63.3 per cent placed in revised estimates for 2002-03. The Union budget has proposed improved cash management and debt restructuring by way of prepayment of external debt, buy-back of high cost debt from banks and debt swaps with State Governments.
Table 10: Union Budget 2003-04 at a Glance |
||||
|
|
||||
2002-03 (RE) |
2003-04 (BE) |
Variation (3 over 2) |
||
Rupees crore |
Per cent |
|||
|
|
||||
1 |
2 |
3 |
4 |
5 |
|
|
||||
Revenue Receipts |
2,36,936 |
2,53,935 |
16,999 |
7.2 |
(9.6) |
(9.3) |
|||
Tax Revenue |
1,64,177 |
1,84,169 |
19,992 |
12.2 |
(6.7) |
(6.7) |
|||
Non-Tax Revenue |
72,759 |
69,766 |
-2,993 |
-4.1 |
(3.0) |
(2.5) |
|||
Non-Plan Expenditure |
2,89,924 |
3,17,821 |
27,897 |
9.6 |
of which: |
(11.8) |
(11.6) |
||
Interest Payments |
1,15,663 |
1,23,223 |
7,560 |
6.5 |
(4.7) |
(4.5) |
|||
Defence |
56,000 |
65,300 |
9,300 |
16.6 |
(2.3) |
(2.4) |
|||
Subsidies |
44,618 |
49,907 |
5,289 |
11.9 |
(1.8) |
(1.8) |
|||
Plan Expenditure |
1,14,089 |
1,20,974 |
6,885 |
6.0 |
(4.6) |
(4.4) |
|||
Revenue Expenditure |
3,41,648 |
3,66,227 |
24,579 |
7.2 |
(13.9) |
(13.3) |
|||
Capital Receipts |
1,67,077 |
1,84,860 |
17,783 |
10.6 |
(6.8) |
(6.7) |
|||
Capital Expenditure |
62,365 |
72,568 |
10,203 |
16.4 |
(2.5) |
(2.6) |
|||
Gross Fiscal Deficit |
1,45,466 |
1,53,637 |
8,171 |
5.6 |
(5.9) |
(5.6) |
|||
Revenue Deficit |
1,04,712 |
1,12,292 |
7,580 |
7.2 |
(4.3) |
(4.1) |
|||
Gross Primary Deficit |
29,803 |
30,414 |
611 |
2.1 |
(1.2) |
(1.1) |
|||
|
|
||||
BE: Budget Estimates; RE: Revised Estimates. |
||||


