 IST,
IST,
II. Fiscal Situation
Combined Government Finances
Centre’s Fiscal Position
State Finances
Financing Patterns
Public Debt
The Fiscal Outlook
The combined gross fiscal deficit of the Centre and States for the year 2003-04 was budgeted at 9.2 per cent of GDP, lower than 10.1 per cent in the revised estimates for 2002-03. Commensurate reductions were also envisaged in the combined gross primary deficit and the revenue deficit through higher revenue mobilisation as well as moderation in the growth of aggregate expenditure.
Centre’s Fiscal Position
The Union Budget for 2003-04 accorded the highest priority to fiscal consolidation through revenue augmentation and elimination of budgetary drags. The revised estimates (RE) for 2003-04 presented in the Interim Budget for 2004-05 indicate a satisfactory outcome, with all key deficit indicators undershooting the budget estimates (BE) for the first time since 1991 (Table 6). This was a consequence of a combination of measures to enhance revenue buoyancy, contain revenue expenditure and secure higher realisation of disinvestment proceeds.
Table 6 : Deficit Indicators of the Centre
| (Rupees crore) | ||||||
| Item | 2002-03 | 2003-04 | 2003-04 | Variation | ||
| (BE) | (RE) | (Column 4 over Column 3) | ||||
| Amount | Per cent | |||||
| 1 | 2 | 3 | 4 | 5 | 6 | |
| 1. | Gross Fiscal Deficit | 1,31,306 | 1,53,637 | 1,32,103 | -21,534 | -14.0 |
| (5.4) | (5.6) | (4.8) | ||||
| 2. | Revenue Deficit | 1,07,879 | 1,12,292 | 99,860 | -12,432 | -11.1 |
| (4.4) | (4.1) | (3.6) | ||||
| 3. | Gross Primary Deficit | 13,502 | 30,414 | 7,548 | -22,866 | -75.2 |
| (0.6) | (1.1) | (0.3) | ||||
| BE:Budget Estimates. | ||||||
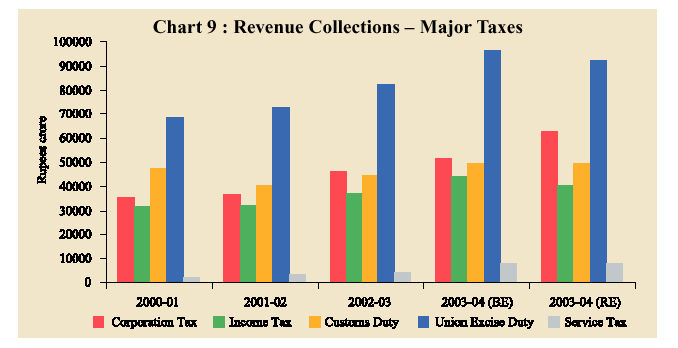
Revenue receipts were 3.6 per cent higher than their budgeted levels, buoyed by higher tax collections as well as non-tax revenues. The rise in tax revenues was essentially on account of increased corporation tax and service tax collections, reflecting improved profitability of the corporate sector. This more than offset the shortfall in both personal income tax and union excise duty vis-a-vis the BE (Chart 9).
The increase in non-tax revenues over the BE was mainly due to higher dividends and profits which accounted for 73.8 per cent of the rise. Non-debt capital receipts (comprising disinvestment and recovery of loans) accounted for 37.5 per cent of total capital receipts, significantly higher than the budgeted 16.9 per cent. This was largely on account of receipts under the State Debt Swap Scheme (DSS), which enabled the States to substitute high-cost debt owed to the Central Government with market borrowings raised at relatively lower rates of interest in 2003-04 and part of current small savings transfers. All loans from the Centre to the State Governments bearing coupons in excess of 13 per cent are to be swapped at prevailing interest rates over a period of three years ending in 2004-05. As these receipts were used by the Centre to discharge its liabilities under the National Small Savings Fund (NSSF), thereby increasing its non-plan capital expenditure, transactions on account of the State DSS are deficit neutral. Net of receipts under the debt swap, non-debt capital receipts contributed 19.8 per cent of the total capital receipts (Table 7).
Aggregate expenditure was higher than the budget estimates mainly on account of debt swap transactions (Table 8). Aggregate expenditure, net of repayment to the NSSF was, however, lower than the budget estimate. Compression in expenditure was effected exclusively in the non-plan component. Of this, a reduction of Rs.4,582 crore in the revenue account was mainly on account of lower spending on subsidies. The remaining decline of Rs.7,094 crore was in the capital account, mainly in the outlay on defence. Interest payments (excluding pre-payment premium of Rs.4,080 crore on internal and external debt) also recorded a decline from the budgeted level, reflecting the softening of interest rates on Government securities.
Table 7 : Total Receipts of the Centre
| (Rupees crore) | ||||||
| Item | 2002-03 | 2003-04 | 2003-04 | Variation (4 over 3) | ||
| (BE) | (RE) | Amount | Per cent | |||
| 1 | 2 | 3 | 4 | 5 | 6 | |
| 1. | Total Receipts (2+5) | 4,00,396 | 4,38,795 | 4,74,255 | 35,460 | 8.1 |
| (16.2) | (16.0) | (17.2) | ||||
| 2. | Revenue Receipts (3+4) | 2,31,748 | 2,53,935 | 2,63,027 | 9,092 | 3.6 |
| (9.4) | (9.3) | (9.5) | ||||
| 3. | Tax Revenue | 1,59,425 | 1,84,169 | 1,87,539 | 3,370 | 1.8 |
| (6.5) | (6.7) | (6.8) | ||||
| 4. | Non-Tax Revenue | 72,323 | 69,766 | 75,488 | 5,722 | 8.2 |
| (2.9) | (2.5) | (2.7) | ||||
| Of which: | ||||||
| Dividends and Profits | 21,230 | 17,861 | 22,081 | 4,220 | 23.6 | |
| 5. | Capital Receipts | 1,68,648 | 1,84,860 | 2,11,228 | 26,368 | 14.3 |
| (6.8) | (6.7) | (7.7) | ||||
| Of which: | ||||||
| Market Borrowing | 1,04,126 | 1,07,194 | 85,671 | -21,523 | -20.1 | |
| Recovery of Loans | 34,191 | 18,023 | 64,625 | 46,602 | 258.6 | |
| Disinvestment proceeds | 3,151 | 13,200 | 14,500 | 1,300 | 9.8 | |
| BE:Budget Estimates. | ||||||
Table 8 : Aggregate Expenditure of the Centre
| (Rupees crore) | ||||||
| Item | 2002-03 | 2003-04 | 2003-04 | Variation (4 over 3) | ||
| (BE) | (RE) | Amount | Per cent | |||
| 1 | 2 | 3 | 4 | 5 | 6 | |
| 1. | Total Expenditure (2+3=4+5) | 4,00,397 | 4,38,795 | 4,74,255 | 35,460 | 8.1 |
| 2. | Non-Plan Expenditure | 2,88,942 | 3,17,821 | 3,06,145* | -11,676 | -3.7 |
| (11.7) | (11.6) | (11.1) | ||||
| Of which: | ||||||
| Interest Payments | 1,17,804 | 1,23,223 | 1,24,555# | 1,332 | 1.1 | |
| (4.8) | (4.5) | (4.5) | ||||
| Defence | 55,662 | 65,300 | 60,300 | -5,000 | -7.7 | |
| (2.3) | (2.4) | (2.2) | ||||
| Subsidies | 43,515 | 49,907 | 44,707 | -5,200 | -10.4 | |
| (1.8) | (1.8) | (1.6) | ||||
| 3. | Plan Expenditure | 1,11,455 | 1,20,974 | 1,21,507 | 533 | 0.4 |
| (4.5) | (4.4) | (4.4) | ||||
| 4. | Revenue Expenditure | 3,39,628 | 3,66,227 | 3,62,887 | -3,340 | -0.9 |
| (13.8) | (13.3) | (13.2) | ||||
| 5. | Capital Expenditure | 60,769 | 72,568 | 1,11,368 | 38,800 | 53.5 |
| (2.5) | (2.6) | (4.0) | ||||
| *Net of receipts of Rs.46,602 crore from States under the Debt Swap Scheme. | ||||||
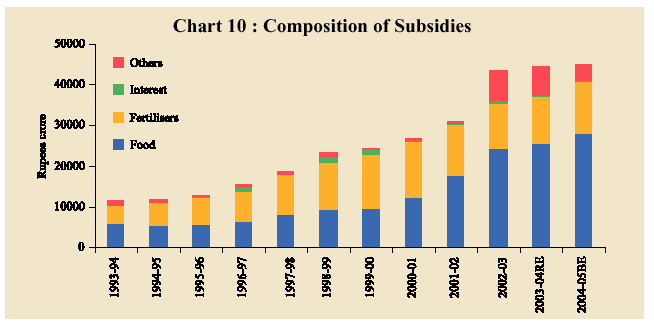
Outgo on subsidies was sharply curtailed. The expenditure on subsidies increased by only 2.7 per cent in 2003-04 as compared with an annual average increase of 19.3 per cent in the preceding five years (1998-2003). Food subsidies – the single largest component with a share of 56.0 per cent in total subsidies – could be contained on account of a lower carrying cost of food stock during the year (Chart 10).
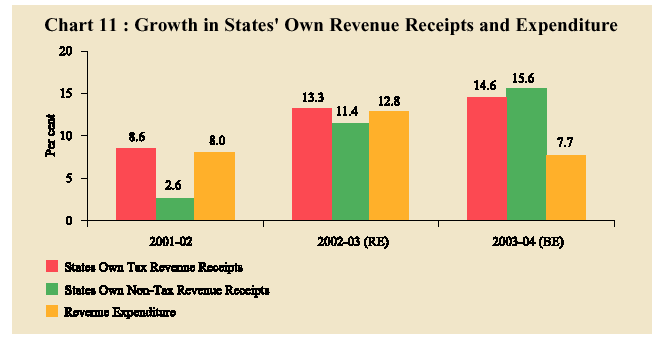
The finances of State Governments were budgeted to record an improvement during 2003-04, with all key deficit indicators placed lower than in the previous year. A reduction of 0.7 percentage points in the revenue deficit/GDP ratio was envisaged through growth in revenue receipts (13.7 per cent) outpacing revenue expenditure (7.7 per cent) (Chart 11).
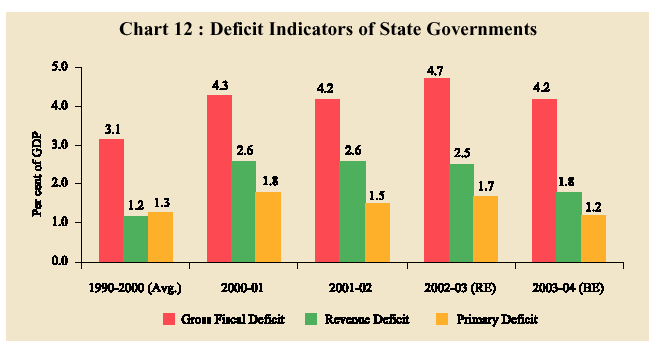
With the compression in the revenue deficit, the gross fiscal deficit (GFD) and the primary deficit were also budgeted to narrow by a similar magnitude as proportions to GDP (Chart 12).
The State budgets for 2003-04 emphasised fiscal rectitude through measures for revenue augmentation, expenditure containment and institutional reforms to strengthen the process of fiscal consolidation. On the revenue front, strengthening of tax efforts and rationalisation of user charges mainly relating to power, water and transport are under way. Some States have proposed introduction of a contributory pension scheme for their newly recruited staff. Twenty one States have constituted State Electricity Regulatory Commissions (SERCs) for determining the power tariff structure. Of these, SERCs of 17 States have become operational and 16 have issued tariff orders.
Some States have initiated measures to provide statutory backing to fiscal reforms through enabling legislation. The objective is to eliminate the revenue deficit and contain the fiscal deficit in the medium term. The States of Karnataka, Kerala, Punjab, Tamil Nadu and Uttar Pradesh have already enacted Fiscal Responsibility legislation. A bill has also been introduced in the legislature of Maharashtra. The Central Government supports States’ Medium-Term Fiscal Reforms Programmes (MTFRP) covering targets for broad fiscal indicators, restructuring of public sector enterprises, power sector reforms and fiscal transparency. It has set up an Incentive Fund to encourage States to implement monitorable fiscal reforms.
Financing Patterns
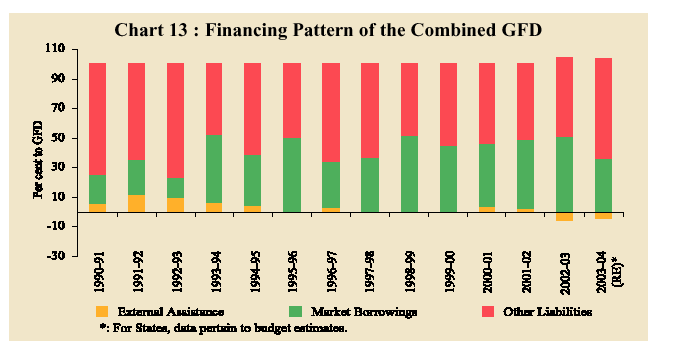
The combined fiscal deficit was entirely financed from domestic sources. The share of ‘other liabilities’ - small savings, provident funds and deposits – in financing increased from 53.7 per cent in 2002-03 to 68.2 per cent in 2003-04. The proportion of the combined deficit financed through market borrowings fell from 51.0 per cent to 36.0 per cent over the same period, reflecting the effect of debt swap transactions. Actual net market borrowings (including on account of debt swap transactions) amounted to Rs.1,35,475 crore vis-a-vis Rs.99,160 crore in the revised estimates. External financing continued to record net outflows for the second consecutive year, reflecting prepayments of external debt (Chart 13).
Financing of the Union Budget
Gross market borrowings of the Centre for 2003-04 were budgeted at Rs.1,65,887 crore and the net market borrowings at Rs.1,07,194 crore. The revised estimates for 2003-04 placed the net borrowings at Rs.85,671 crore, 20.1 per cent lower than the budget estimates. Actual net market borrowings amounted to Rs. 88,816 crore during 2003-04. Although there is no impact of the DSS on the fiscal deficit of the Central Government, these transactions did result in a compositional change in the financing pattern of the GFD. Market borrowings (dated securities and 364-day Treasury Bills) financed 64.9 per cent of the GFD and the securities issued against small savings financed around 45.7 per cent. The latter represent the reinvestment by the NSSF out of the proceeds received on redemption of Special Central Government securities. The surplus cash balances amounted to Rs.13,697 crore and accounted for 10.4 per cent of the GFD.
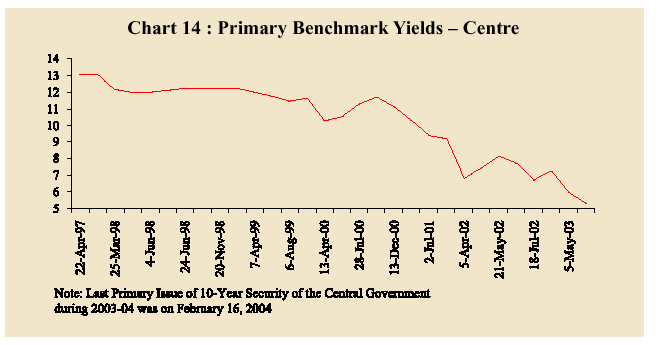
Interest rates on market borrowings continued to decline with liquidity conditions remaining comfortable. The yield on the 10-year benchmark security declined to 5.32 per cent in the primary market by February 16, 2004 (Chart 14).
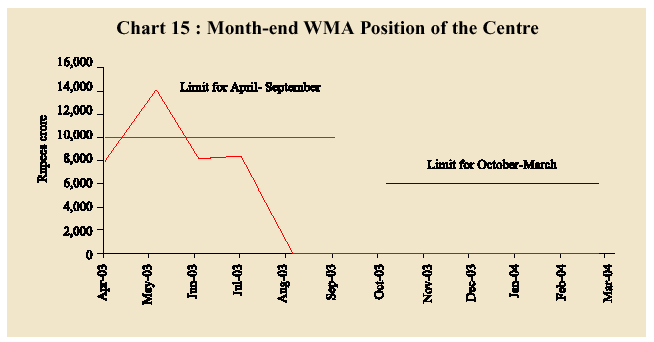
The agreed limits on the Centre’s Ways and Means Advances (WMA) from the Reserve Bank for the first and second halves of 2003-04 were set at Rs.10,000 crore (April-September) and Rs.6,000 crore (October-March), respectively. The average utilisation of WMA, at Rs.3,947 crore, was lower than in the preceding year (Chart 15). The Centre resorted to ways and means advances (Rs.245 crore) on April 30, 2004 for the first time since August 8, 2003.
Financing of State Budgets
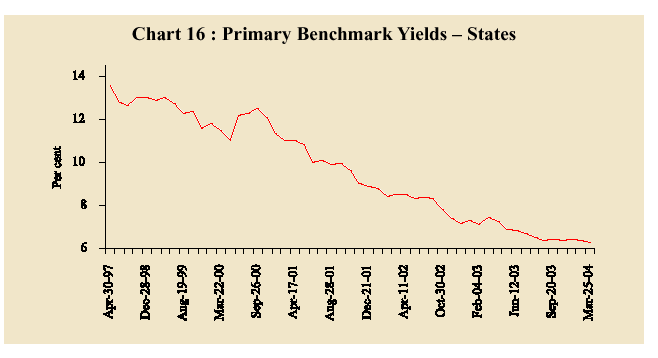
The net market borrowings allocated to States for 2003-04 amounted to Rs. 46,659 crore including additional allocation of Rs. 29,000 crore under the DSS. Taking into account the repayment of Rs. 4,145 crore, the gross allocation amounted to Rs. 50,805 crore. Of Rs.29,000 crore allocated under the DSS, Rs.26,623 crore went towards repayment of debt under the DSS while a few States were allowed to retain a part of the DSS amount for other purposes and a small portion of the DSS amount remained unsubscribed. The gross market borrowings raised by State Governments during 2003-04 amounted to Rs.50,521 crore (Rs.47,626 crore through tap sale and Rs.2,895 crore through auction). In consonance with the declining trend in interest rates, the interest rates on States’ market borrowings fell to a range of 5.78-6.40 per cent during 2003-04 from a range of 6.6-8.0 per cent in 2002-03 (Chart 16).
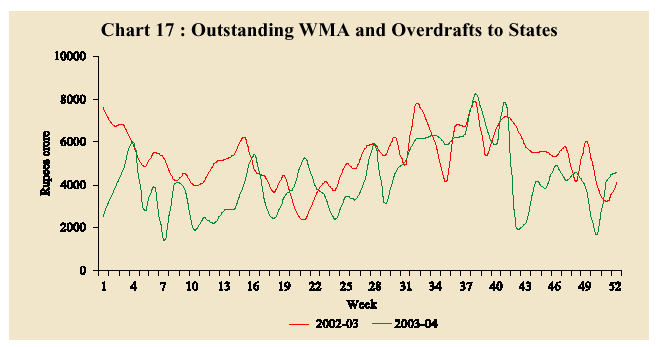
Although data on the actual fiscal outturn of the State Governments during 2003-04 are not yet available, recourse to WMA and overdrafts (ODs) by States during 2003-04 was generally lower than in the previous year suggesting improved management of cash flows (Chart 17).
Public Debt
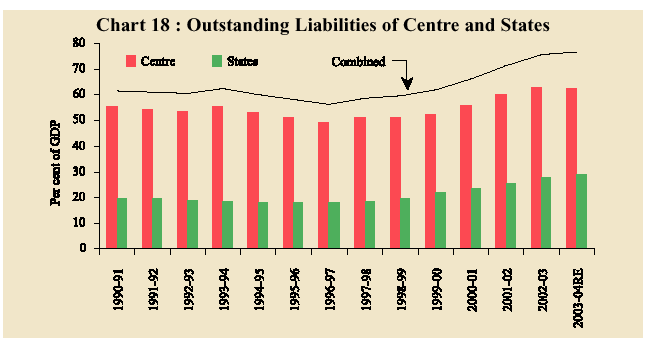
The combined debt-GDP ratio of the Centre and the States is estimated to have increased to 76.6 per cent in 2003-04 from 75.8 per cent in 2002-03 (Chart 18). The weighted average maturity of Central Government dated securities issued during 2003-04 was higher at 14.94 years as against 13.83 years in the previous year. The weighted average yield also fell to 5.74 per cent from 7.34 per cent in the preceding year. There were three issues of floating rate bonds on May 20, 2003, August 8, 2003 and November 10, 2003 with the rate linked to the 364-day Treasury Bill rate and mark-ups ranging between 9-14 basis points.
The Fiscal Outlook
The Interim Budget for 2004-05 has reiterated a commitment to the process of fiscal consolidation. Revenue receipts are budgeted to grow by 10.6 per cent and aggregate expenditure would decline by 3.5 per cent. Accordingly, all major deficit indicators are expected to be lower in 2004-05 as proportions to GDP than the revised estimates for 2003-04 (Table 9).
Table 9 : Interim Union Budget 2004-05 at a Glance
| (Rupees crore) | |||||||
| Item | 2003-04 | 2004-05 | Variation (3 over 2) | ||||
| (RE) | (BE) | Amount | Per cent | ||||
| 1 | 2 | 3 | 4 | 5 | |||
| 1. | Revenue Receipts (i+ii) | 2,63,027 | 2,90,882 | 27,855 | 10.6 | ||
| (9.5) | (9.4) | ||||||
| i. | Tax Revenue | 1,87,539 | 2,20,132 | 32,593 | 17.4 | ||
| (6.8) | (7.1) | ||||||
| ii. | Non-tax Revenue | 75,488 | 70,750 | -4,738 | -6.3 | ||
| (2.7) | (2.3) | ||||||
| 2. | Non-Plan Expenditure | 3,52,748 | 3,22,363 | -30,385 | -8.6 | ||
| (12.8) | (10.4) | ||||||
| of which: | |||||||
| i. | Interest Payments | 1,24,555 | 1,29,500 | 4,945 | 4.0 | ||
| (4.5) | (4.2) | ||||||
| ii. | Defence | 60,300 | 66,000 | 5,700 | 9.5 | ||
| (2.2) | (2.1) | ||||||
| iii. | Subsidies | 44,707 | 45,175 | 468 | 1.0 | ||
| (1.6) | (1.5) | ||||||
| 3. | Plan Expenditure | 1,21,507 | 1,35,071 | 13,564 | 11.2 | ||
| (4.4) | (4.4) | ||||||
| 4. | Revenue Expenditure | 3,62,887 | 3,80,742 | 17,855 | 4.9 | ||
| (13.2) | (12.3) | ||||||
| 5. | Capital Expenditure | 1,11,368 | 76,692 | -34,676 | -31.1 | ||
| (4.0) | (2.5) | ||||||
| 6. | Revenue Deficit | 99,860 | 89,860 | -10,000 | -10.0 | ||
| (3.6) | (2.9) | ||||||
| 7. | Gross Fiscal Deficit | 1,32,103 | 1,36,452 | 4,349 | 3.3 | ||
| (4.8) | (4.4) | ||||||
| 8. | Gross Primary Deficit |
7,548 |
6,952 |
-596 | -7.9 | ||
|
(0.3) |
(0.2) | ||||||
| BE:Budget
Estimates. | |||||||
Under revenue receipts, tax revenue is projected to increase by 17.4 per cent. A major portion of the increase in tax revenue is estimated to emanate from corporation tax and service tax. Consequently, the gross tax-GDP ratio of the Central Government is expected to rise to 9.7 per cent in 2004-05 from 9.3 per cent in the revised estimates for 2003-04. Non-tax revenue, on the other hand, is budgeted to decline by 6.3 per cent on account of a sharp fall in dividends and profits. As regards aggregate expenditure, revenue expenditure is budgeted to grow by 4.9 per cent while capital expenditure is expected to be lower by 31.1 per cent, mainly on account of reduction in non-plan capital expenditure. The sharp contraction in non-plan capital expenditure reflects the absence of any provision for public debt repayments as a capital expenditure item as was the case in the revised estimates for 2003-04. Among the major non-Plan revenue expenditure items, interest payments, defence expenditure and subsidies taken together would account for 73.9 per cent of the non-Plan revenue expenditure. Total Plan expenditure is budgeted to rise by 11.2 per cent during 2004-05. Capital outlay (both Plan and non-plan) is budgeted to rise by 31.1 per cent over the revised estimates, implying a better quality of fiscal adjustment.
During 2004-05, net market borrowings are budgeted higher at Rs.90,502 crore than Rs.85,671 crore in the revised estimates for 2003-04. Inclusive of repayments to the tune of Rs.60,356 crore, the gross market borrowings are placed at Rs.1,50,858 crore. Net market borrowings would finance 66.3 per cent of GFD in 2004-05 as compared with 64.9 per cent in the revised estimates for 2003-04. The fiscal correction envisaged in the Interim Budget provides a foundation for the implementation of the provisions in the Fiscal Responsibility and Budget Management Act, 2003 for fiscal consolidation.


