 IST,
IST,
II. Fiscal Situation
Combined Government Finances: 2006-07
Key fiscal indicators suggest that the process of fiscal consolidation is expected to continue during 2006-07. The combined gross fiscal deficit (GFD) of the Centre and States is budgeted to decline by one percentage point to 6.5 per cent of GDP in 2006-07. The combined primary deficit and revenue deficit are also budgeted to decline by 0.8 percentage point and 0.9 percentage point of GDP, respectively, in 2006-07 (Table 10). The reduction in the deficits is sought to be achieved primarily through higher tax collections and containment of revenue expenditure. The share of capital outlay in total expenditure is budgeted to improve in 2006-07 though the share of overall developmental expenditure would decline from that in the revised estimates for 2005-06.
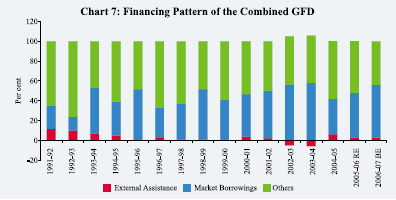
The financing pattern indicates that 52.9 per cent of the combined GFD during 2006-07 would be financed by market borrowings as compared with 45.2 per cent during 2005-06 (Chart 7).
|
Table 10: Key Fiscal Indicators |
|||
|
(Per cent to GDP) |
|||
|
Year |
Primary Deficit |
Revenue Deficit |
Gross Fiscal Deficit |
|
1 |
2 |
3 |
4 |
|
Centre |
|||
|
2002-03 |
1.1 |
4.4 |
5.9 |
|
2003-04 |
-0.03 |
3.6 |
4.5 |
|
2004-05 |
-0.1 |
2.5 |
4.0 |
|
2005-06 RE |
0.5 |
2.6 |
4.1 |
|
(0.4) |
(2.7) |
(4.1) |
|
|
2006-07 BE |
0.2 |
2.1 |
3.8 |
|
States |
|||
|
2002-03 |
1.3 |
2.2 |
4.1 |
|
2003-04 |
1.5 |
2.2 |
4.5 |
|
2004-05 |
0.7 |
1.2 |
3.5 |
|
2005-06 RE |
0.7 |
0.5 |
3.2 |
|
2006-07 BE |
0.2 |
0.05 |
2.7 |
|
Combined |
|||
|
2002-03 |
3.1 |
6.7 |
9.6 |
|
2003-04 |
2.1 |
5.8 |
8.5 |
|
2004-05 |
1.6 |
3.7 |
7.5 |
|
2005-06 RE |
1.6 |
3.1 |
7.5 |
|
2006-07 BE |
0.8 |
2.2 |
6.5 |
|
RE: Revised Estimates. BE: Budget Estimates. |
|||
Public Debt
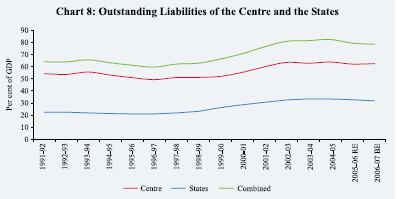
Reflecting the fiscal consolidation, the combined debt-GDP ratio of the Centre and the States is estimated to decline from 79.5 per cent as at end-March 2006 (RE) to 78.6 per cent by end-March 2007 (BE) (Chart 8).
Centre’s Fiscal Situation: 2006-07
The Union Budget 2006-07, taking forward the fiscal consolidation stipulated under the Fiscal Responsibility and Budget Management (FRBM) Rules, 2004, projected the revenue deficit and gross fiscal deficit at 2.1 per cent and 3.8 per cent
of GDP, respectively, lower than that of 2.6 per cent (2.7 per cent in the provisional accounts) and 4.1 per cent of GDP in the revised estimates for 2005-06. The Budget envisaged revenue-led correction along with reprioritisation of expenditure to augment allocations for improvement in the social and physical infrastructure particularly in the rural areas.
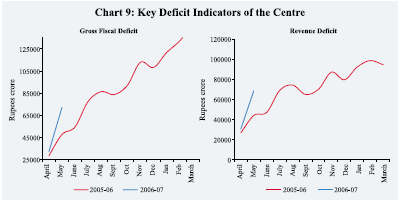
Available information on Central Government finances during April-May 2006 indicates buoyant tax collections, particularly in respect of corporation tax, personal income tax and customs duties. Union excise duties, however, declined during April-May 2006 over their level a year ago. Non-tax revenue showed improvement mainly on account of returns from economic services. Aggregate expenditure during April-May 2006 registered substantial growth on account of increase in interest payments, food and fertiliser subsidies, grants to States and higher non-defence capital outlay. Accordingly, all the key deficit indicators, as proportion to budget estimates, during April-May 2006 were placed significantly higher than their levels a year ago (Table 11 and Chart 9).
Financing of the Union Budget
Net market borrowings (excluding allocations under Market Stabilisation Scheme), at Rs.1,13,778 crore, are budgeted to finance 76.5 per cent of the GFD
|
Table 11: Central Government Finances during April-May 2006 |
|||||||
|
(Rupees crore) |
|||||||
|
Items |
2006-07 |
April-May |
Per cent of Budget Estimates |
||||
|
(Budget |
April-May |
||||||
|
Estimates) |
|||||||
|
2005 |
2006 |
2005 |
2006 |
||||
|
1 |
2 |
3 |
4 |
5 |
6 |
||
|
1. |
Revenue Receipts (i + ii) |
4,03,465 |
11,944 |
19,330 |
3.4 |
4.8 |
|
|
i) |
Tax Revenue |
3,27,205 |
8,659 |
15,087 |
3.2 |
4.6 |
|
|
ii) |
Non-tax Revenue |
76,260 |
3,285 |
4,243 |
4.2 |
5.6 |
|
|
2. |
Non-Debt Capital Receipts |
11,840 |
190 |
500 |
1.6 |
4.2 |
|
|
3. |
Non-Plan Expenditure |
3,91,263 |
46,788 |
62,882 |
12.6 |
16.1 |
|
|
of which: |
|||||||
|
i) |
Interest Payments |
1,39,823 |
21,167 |
23,919 |
15.8 |
17.1 |
|
|
ii) |
Defence |
89,000 |
4,751 |
6,314 |
5.7 |
7.1 |
|
|
iii) |
Subsidies |
44,792 |
7,196 |
11,412 |
15.5 |
25.5 |
|
|
4. |
Plan Expenditure |
1,72,728 |
12,949 |
29,036 |
9.0 |
16.8 |
|
|
5. |
Revenue Expenditure |
4,88,192 |
56,098 |
87,950 |
12.6 |
18.0 |
|
|
6. |
Capital Expenditure |
75,799 |
3,639 |
3,968 |
5.4 |
5.2 |
|
|
7. |
Total Expenditure |
5,63,991 |
59,737 |
91,918 |
11.6 |
16.3 |
|
|
8. |
Revenue Deficit |
84,727 |
44,154 |
68,620 |
46.3 |
81.0 |
|
|
(2.1) |
|||||||
|
9. |
Gross Fiscal Deficit |
1,48,686 |
47,603 |
72,088 |
31.5 |
48.5 |
|
|
(3.8) |
|||||||
|
10. |
Gross Primary Deficit |
8,863 |
26,436 |
48,169 |
153.7 |
543.5 |
|
|
(0.2) |
|||||||
|
Note : Figures in parentheses are percentages to GDP. |
|||||||
in 2006-07 as compared with 69.2 per cent in the preceding year. Including repayment obligations of Rs.65,939 crore, as per the Union Budget, gross market borrowings of the Central Government work out to Rs.1,79,716 crore, Rs.21,857 crore higher than the actual amount raised in 2005-06.
On March 24, 2006, the issuance calendar for dated securities for the first half of 2006-07 fixed at Rs.89,000 crore (Rs.81,000 during the corresponding period of last year) was issued in consultation with the Central Government. During 2006-07 (up to July 18, 2006), the actual issuances of dated securities at Rs.59,000 crore were marginally higher than scheduled in the calendar (Rs.58,000 crore) (Table 12) and the amount raised (Rs.57,000 crore) in the comparable period of the preceding year. The actual issuance was higher than the indicative calendar as the Government, in
|
Table 12: Central Government Securities Issued during 2006-07 |
|||
|
Date of Auction |
Notified Amount |
Residual Maturity |
Cut-off Yield |
|
(Rupees crore) |
(Years) |
(Per cent) |
|
|
1 |
2 |
3 |
4 |
|
April 10, 2006 |
5,000 |
10.00 |
7.59 |
|
3,000 |
28.33 |
7.97 |
|
|
April 25. 2006 |
6,000 |
6.02 |
7.06 |
|
4,000 |
26.34 |
8.00 |
|
|
May 4, 2006 |
6,000 |
9.94 |
7.55 |
|
4,000 |
28.26 |
8.14 |
|
|
May 23, 2006 |
5,000 |
15.00 |
7.94 |
|
June 6, 2006 |
4,000 |
30.00 |
8.33 |
|
6,000 |
5.07 |
7.39 |
|
|
June 22, 2006 |
5,000 |
8.52 |
7.92 |
|
4,000 |
14.95 |
8.46 |
|
|
July 11, 2006 |
5,000 |
9.75 |
8.29 |
|
2,000 |
28.08 |
8.75 |
|
consultation with the Reserve Bank of India, frontloaded its market borrowings by an additional Rs.4,000 crore on June 22, 2006. On the other hand, there was a reduction in the notified amount from Rs.6,000 crore and Rs.4,000 crore (as per the issuance auction calendar) to Rs.5,000 crore and Rs.2,000 crore, respectively, in the auctions held on July 11, 2006. An amount of Rs. 5,604 crore devolved on primary dealers during 2006-07 (up to July 18, 2006); there was no devolvement during the corresponding period of the preceding year. During 2006-07 so far, 13 securities have been issued. While 10 securities were reissues, three new securities of 10,15 and 30-year maturity were issued to provide benchmarks in the respective segments. Gross and net market borrowings (including dated securities and 364-day Treasury Bills) raised by the Centre amounted to 38.2 per cent and 30.4 per cent of the budget estimates as compared with 37.2 per cent and 39.1 per cent, respectively, a year ago.
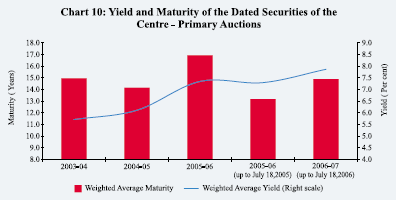
During 2006-07 (up to July 18, 2006), the weighted average maturity of dated securities of the Central Government at 14.88 years was higher than that of 13.16 years in the corresponding period of the preceding year. The weighted average yield of dated securities issued over the same period also increased to 7.86 per cent from 7.29 per cent during the corresponding period of 2005-06 (Chart 10). In this context, it may be noted that the secondary market yield on 10-year Central Government securities increased from 7.01 per cent during April-June 2005 to 7.64 per cent during April-June 2006.
With a view to achieving a smooth transition to the new regime as envisaged in the FRBM Act whereby the participation of the Reserve Bank in the primary issuance of Central Government securities has been prohibited with effect from April 1, 2006, the Ways and Means Advances (WMA) arrangements for
2006-07 were revised in consultation with the Government. As per the revised arrangement, the WMA limits would be fixed on a quarterly basis instead of the existing half-yearly basis. Accordingly, the WMA limits for 2006-07 have been placed at Rs.20,000 crore and Rs.10,000 crore for the first and second quarters, respectively, and Rs.6,000 crore each for the third and fourth quarters of the year. The Reserve Bank would retain the flexibility to revise the limits in consultation with the Government taking into consideration the transitional issues and prevailing circumstances. Furthermore, the interest rates on WMA and overdraft have been linked to the repo rate as against the Bank Rate hitherto, following emergence of the repo rate as the short-term reference rate. Accordingly, the interest rate on WMA will be at the repo rate and that on overdraft will be at repo rate plus two percentage points.
The Central Government took recourse to WMA on 36 days during 2006-07 (up to July 14, 2006) as compared with only two days during the entire fiscal year 2005-06. The average WMA utilisation during 2006-07 (up to July 14) was Rs.1,370 crore as compared with Rs.12 crore in the corresponding period of the preceding year.
State Finances: 2006-071
The State budgets for 2006-07 proposed various policy initiatives to carry forward the process of fiscal correction and consolidation. The States have emphasised fiscal empowerment through broad basing and rationalisation of the tax system. In order to improve the accountability of budget proposals, some States have proposed to introduce ‘Outcome Budget’, following the pattern of the Central Government. Furthermore, many State Governments have proposed to introduce ‘Gender Budgeting’. A number of States announced introduction of new pension schemes based on defined contribution to restrict their rising pension obligations. There has been progressive enactment of fiscal responsibility legislation (FRL) to put in place a rule-based fiscal policy at the State level (22 States as at end-March 2006). All States, barring Tamil Nadu and Uttar Pradesh, have opted for value added tax (VAT) in lieu of sales tax as on April 1, 2006.
All major deficit indicators are budgeted to decline in 2006-07 from their respective levels in the previous year. The revenue deficit as ratio to GDP is budgeted to reach almost zero level in 2006-07 from that of 0.5 per cent in the previous year. Consequently, gross fiscal deficit is budgeted to decline to 2.7 per cent in 2006-07 from that of 3.2 per cent of GDP a year ago (Chart 11). The fiscal correction in State finances during 2006-07 is proposed to be brought about mainly by consolidation of the revenue account with revenue expenditure-GDP
1 Based on information pertaining to 29 State Budgets, of which four are Vote-on-Accounts.
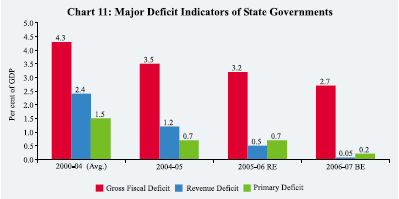
ratio budgeted to decline from 13.4 per cent in 2005-06 to 13.0 per cent in 2006-07 while revenue receipts are budgeted to increase marginally from 12.9 per cent to 13.0 per cent. States’ own revenues (taxes and non-taxes) are budgeted to be stagnant at 7.7 per cent of GDP during 2006-07 while current devolution and transfers (grants and shareable Central taxes) from the Centre are budgeted to increase marginally from 5.2 per cent in 2005-06 to 5.3 per cent in 2006-07.
A perusal of the Union Budget 2006-07 in conjunction with State budgets indicates that grants-in-aid have been overestimated while shareable Central taxes have been underestimated by the States. Adjusting for the data as reported in the Union Budget 2006-07, the revenue deficit and gross fiscal deficit of the State Governments, as per cent of GDP, would be placed at 0.3 per cent and 3.0 per cent, respectively. Furthermore, flows (net) from the National Small Savings Fund (NSSF) have been underestimated in the State budgets as compared with Union Budget 2006-07 while the loans from Centre have been overestimated. Adjusting for these, States are not likely to have much difficulty in financing their deficits.
Financing of the States’ Budgets
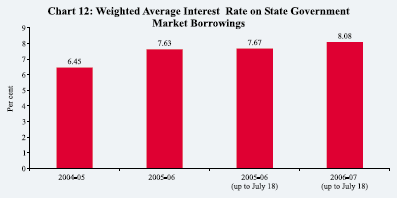
The provisional net allocation under market borrowing programme for State Governments is placed at Rs.17,077 crore during 2006-07. Taking into account the additional allocation of Rs.35 crore and repayments of Rs.6,551 crore, the gross allocation amounts to Rs.23,663 crore. During 2006-07 so far (up to July 18, 2006), the States have raised market loans amounting to Rs.7,343 crore (31.0 per cent of gross allocation) through auctions with a cut-off rate in the range 7.65-8.66 per cent (Table 13). The weighted average interest rate of market loans firmed up from 7.67 per cent during 2005-06 (up to July 18, 2005) to 8.08 per cent during 2006-07 (up to July 18, 2006) (Chart 12).
|
Table 13: Market Borrowings of State Governments during 2006-07 |
||||||
|
(up to July 18, 2006) |
||||||
|
Items |
Date |
Cut-off Rate |
Tenor |
Amount Raised |
||
|
(Per cent) |
(Years) |
(Rupees crore) |
||||
|
1 |
2 |
3 |
4 |
5 |
||
|
A. |
Tap Issues |
– |
– |
– |
– |
|
|
B. |
Auctions (i to xviii) |
7,343 |
||||
|
i. |
First |
April 27, 2006 |
7.65 |
10 |
300 |
|
|
ii. |
Second |
May 11, 2006 |
7.89 |
10 |
500 |
|
|
iii. |
Second |
May 11, 2006 |
8.00 |
10 |
1,646 |
|
|
iv. |
Second |
May 11, 2006 |
7.95 |
10 |
881 |
|
|
v. |
Second |
May 11, 2006 |
8.04 |
10 |
150 |
|
|
vi. |
Second |
May 11, 2006 |
7.96 |
10 |
130 |
|
|
vii. |
Second |
May 11, 2006 |
7.87 |
10 |
400 |
|
|
viii. |
Second |
May 11, 2006 |
7.91 |
10 |
500 |
|
|
ix. |
Second |
May 11, 2006 |
7.98 |
10 |
57 |
|
|
x. |
Second |
May 11, 2006 |
8.05 |
10 |
15 |
|
|
xi. |
Second |
May 11, 2006 |
7.93 |
10 |
1,307 |
|
|
xii. |
Third |
July 13, 2006 |
8.65 |
10 |
742 |
|
|
xiii. |
Third |
July 13, 2006 |
8.65 |
10 |
78 |
|
|
xiv. |
Third |
July 13, 2006 |
8.66 |
10 |
300 |
|
|
xv. |
Third |
July 13, 2006 |
8.65 |
10 |
29 |
|
|
xvi. |
Third |
July 13, 2006 |
8.65 |
10 |
19 |
|
|
xvii. |
Third |
July 13, 2006 |
8.62 |
10 |
225 |
|
|
xviii. |
Third |
July 13, 2006 |
8.65 |
10 |
64 |
|
|
Grand Total (A+B) |
7,343 |
|||||
|
Source : Reserve Bank of India. |
||||||
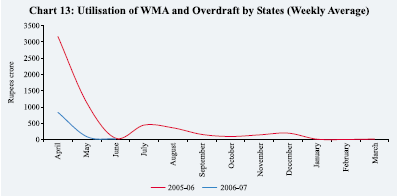
The weekly average utilisation of WMA and overdraft by the States has been substantially lower during 2006-07 so far: Rs.316 crore (up to June 30, 2006) as compared with Rs.1,449 crore in the corresponding period of the previous year (Chart 13). Two States have resorted to overdraft during 2006-07 so far as compared with nine States during the corresponding period of the previous year.
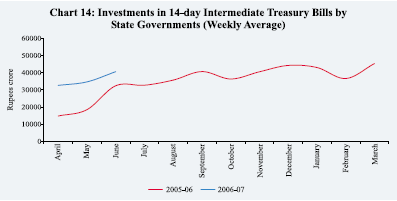
The cash surplus position of the States, as reflected in their investments in 14-day Intermediate Treasury Bills, continued to be comfortable. The weekly average investment by the States in the 14-day Treasury Bills during April-June 2006 amounted to Rs.35,859 crore, considerably higher than that of Rs.21,847 crore in the corresponding period of the previous year (Chart 14).
Page Last Updated on:


