 IST,
IST,


II. Fiscal Situation
Combined Government Finances: 2006-07
Against the backdrop of the renewed thrust on fiscal consolidation process by
the Central Government under the Fiscal Responsibility and Budget Management
(FRBM) Rules, 2004 and the adoption of fiscal responsibility legislations at
the State level, key deficit indicators of the combined Government finances
are budgeted to show a decline during 2006-07. Combined revenue deficit of the
Centre and State Governments is budgeted to decline in 2006-07 on account of
a reduction in revenue expenditure (by 0.5 per cent of GDP) and improvement
in revenue receipts (by 0.3 per cent of GDP). On the revenue front, greater
stress has been placed on buoyancy of tax collections, especially in respect
of direct taxes, although sluggishness in non-tax revenues would partially offset
this rise. The combined Government capital outlay is budgeted to improve in
2006-07. The envisaged improvement in the revenue account is expected to enable
a reduction in the combined gross fiscal deficit (GFD) by 1.0 per cent of GDP
in 2006-07 (Table 12).
|
Table 12: Key Fiscal Indicators |
|||
|
(Per cent to GDP) |
|||
|
Year |
Primary Deficit |
Revenue Deficit |
Gross Fiscal Deficit |
|
1 |
2 |
3 |
4 |
|
Centre |
|||
|
2002-03 |
1.1 |
4.4 |
5.9 |
|
2003-04 |
-0.03 |
3.6 |
4.5 |
|
2004-05 |
-0.1 |
2.5 |
4.0 |
|
2005-06 RE |
0.5 |
2.6 |
4.1 |
|
(0.4) |
(2.7) |
(4.1) |
|
|
2006-07 BE |
0.2 |
2.1 |
3.8 |
|
States |
|||
|
2002-03 |
1.3 |
2.3 |
4.1 |
|
2003-04 |
1.5 |
2.2 |
4.5 |
|
2004-05 |
0.7 |
1.2 |
3.5 |
|
2005-06 RE |
0.7 |
0.5 |
3.2 |
|
2006-07 BE |
0.2 |
0.05 |
2.7 |
|
Combined |
|||
|
2002-03 |
3.1 |
6.7 |
9.6 |
|
2003-04 |
2.1 |
5.8 |
8.5 |
|
2004-05 |
1.4 |
3.7 |
7.5 |
|
2005-06 RE |
1.6 |
3.1 |
7.5 |
|
2006-07 BE |
0.8 |
2.2 |
6.5 |
|
RE: Revised Estimates. BE: Budget Estimates. |
|||
Centre’s Fiscal Situation: 2006-07
The information on Central Government finances for the first five months of
2006-07 (April-August) indicates that all key deficit indicators (as proportion
to budget estimates) were placed higher than the corresponding period of the
previous year. While tax revenues continued to be buoyant, aggregate expenditure
was substantially higher. Tax revenues increased mainly on account of higher
collections under personal income tax, corporation tax and customs duties. Non-tax
revenues also exhibited buoyancy mainly reflecting higher dividends and profits
from public sector enterprises and receipts from economic services. The surplus
transfer from the Reserve Bank at Rs. 8,404 crore was higher than the previous
year. As regards aggregate expenditure, the increase was entirely on account
of sharp rise in revenue expenditure; capital expenditure showed a decline.
Within revenue expenditure, non-Plan expenditure registered a large increase
during April-August 2006 mainly on account of interest payments, defence expenditure,
subsidies and grants to States (Table 13). Plan expenditure, on the other hand,
decelerated with the evening out of front-loaded expenditures incurred during
the first quarter of the year. On account of the substantial
|
Table 13: Central Government Finances during April-August 2006 |
|||||||
|
(Rupees crore) |
|||||||
|
Items |
2006-07 |
Per cent of Budget Estimates |
|||||
|
(Budget Estimates) |
April-August |
April-August |
|||||
|
2005 |
2006 |
2005 |
2006 |
||||
|
1 |
2 |
3 |
4 |
5 |
6 |
||
|
1. |
Revenue Receipts (i + ii) |
4,03,465 |
81,169 |
1,06,551 |
23.1 |
26.4 |
|
|
i) |
Tax Revenue |
3,27,205 |
58,482 |
81,444 |
21.4 |
24.9 |
|
|
ii) |
Non-tax Revenue |
76,260 |
22,687 |
25,107 |
29.2 |
32.9 |
|
|
2. |
Non-Debt Capital Receipts |
11,840 |
3,292 |
3,207 |
27.4 |
27.1 |
|
|
3. |
Non-Plan Expenditure |
3,91,263 |
1,23,453 |
1,46,516 |
33.3 |
37.4 |
|
|
of which: |
|||||||
|
i) |
Interest Payments |
1,39,823 |
44,770 |
51,089 |
33.4 |
36.5 |
|
|
ii) |
Defence |
89,000 |
19,249 |
22,420 |
23.2 |
25.2 |
|
|
iii) |
Major Subsidies |
44,792 |
19,947 |
23,784 |
43.0 |
53.1 |
|
|
iv) |
Grants to States |
35,361 |
9,909 |
14,810 |
29.2 |
41.8 |
|
|
4. |
Plan Expenditure |
1,72,728 |
47,336 |
53,920 |
33.0 |
31.2 |
|
|
5. |
Revenue Expenditure |
4,88,192 |
1,55,541 |
1,85,949 |
34.8 |
38.1 |
|
|
6. |
Capital Expenditure |
75,799 |
15,248 |
14,487 |
22.5 |
19.1 |
|
|
7. |
Total Expenditure |
5,63,991 |
1,70,789 |
2,00,436 |
33.2 |
35.5 |
|
|
8. |
Revenue Deficit |
84,727 |
74,372 |
79,398 |
78.0 |
93.7 |
|
|
(2.1) |
|||||||
|
9. |
Gross Fiscal Deficit |
1,48,686 |
86,328 |
90,678 |
57.1 |
61.0 |
|
|
(3.8) |
|||||||
|
10. |
Gross Primary Deficit |
8,863 |
41,558 |
39,589 |
241.6 |
446.7 |
|
|
(0.2) |
|||||||
|
Note : Figures in parentheses are percentages to GDP. |
|||||||
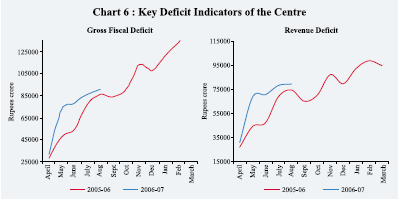
increase in non-plan revenue expenditure, the revenue deficit during the first five months of 2006-07 was 93.7 per cent of the full year budget estimates (Chart 6). The cut back in non-defence capital outlay dampened the impact on GFD though, as per cent of budget estimates, it was higher than the position a year ago.
Assessment of Quarterly Central Government Finances: April-June, 20061
The Government in its review of finances for the first quarter of 2006-07
brought out the progress made in meeting the targets as set under the FRBM Rules
and the direction of revenues and expenditure in the remaining quarters of the
current year. The Government reaffirmed its commitment to a fiscal policy stance
guided by FRBM Rules with stress on revenue correction and reprioritisation
of expenditure towards social sector programmes ensuring ‘quality’ rather than
‘quantity’ in expenditures. The Review noted that the budgetary imbalances witnessed
in the first quarter on account of front-loading of Plan expenditures would
even out as revenue receipts step up and expenditure pattern stabilises during
the remaining part of the year. Furthermore, in order to limit non-Plan expenditures,
expenditure management measures were put in place on July 22, 2006.
Financing of the Union Budget
Net market borrowings (excluding allocations under the Market Stabilisation
Scheme), at Rs.1,13,778 crore, are budgeted to finance 76.5 per 1 As reported
by the Government of India in "Statement on Quarterly Review of the Trends
in Receipts and Expenditure in relation to the Budget at the end of the first
quarter of financial year, 2006-07" under the Fiscal Responsibility and
Budget Management (FRBM) Act, 2003.
cent of the GFD in 2006-07 as compared with 69.2 per cent in the preceding year. Including repayment obligations of Rs.65,939 crore, gross market borrowings of the Central Government work out to Rs. 1,79,716 crore. For 2006-07, there is no provision for utilising draw down of cash balances to finance the GFD whereas in 2005-06 (RE) draw down of cash balances financed 10.3 per cent of the GFD. The investment by National Small Savings Funds (NSSF) in special securities against small savings is budgeted to finance 2.0 per cent of the GFD as against 0.9 per cent in 2005-06 (RE).
During 2006-07 (up to October 23, 2006), the issuances of dated securities at Rs.98,000 crore were higher than the amount raised (Rs.84,000 crore) in the comparable period of the preceding year (Table 14). Though aggregate amount of issuance was as per the indicative issuance calendar, an issuance of Rs. 4000 crore was front loaded on June 22, 2006. On the other hand, the notified amounts of Rs.6,000 crore and Rs.4,000 crore (as per issuance auction calendar) were reduced to Rs.5,000 crore and Rs.2,000 crore, respectively, in the auctions held
|
Table 14: Central Government Securities Issued during 2006-07 |
|||||||
|
(Amount in Rupees crore/Maturity in years) |
|||||||
|
Borrowings as per Issuance Auction Calendar |
Actual Borrowings |
||||||
|
Sr. |
Date of Auction |
Amount |
Residual Maturity |
Date of Auction |
Amount |
Residual |
Yield |
|
No. |
Maturity |
(Per cent) |
|||||
|
1 |
2 |
3 |
4 |
5 |
6 |
7 |
8 |
|
1. |
April 3-12, 2006 |
5,000 |
10-14 years |
April 10, 2006 |
5,000 |
10.00 |
7.59 |
|
3,000 |
20-years and above |
April 10, 2006 |
3,000 |
28.30 |
7.97 |
||
|
2. |
April 18-25, 2006 |
6,000 |
5-9 years |
April 25, 2006 |
6,000 |
6.02 |
7.06 |
|
4,000 |
20-years and above |
April 25, 2006 |
4,000 |
26.34 |
8.00 |
||
|
3. |
May 2-9, 2006 |
6,000 |
10-14 years |
May 4, 2006 |
6,000 |
9.94 |
7.55 |
|
4,000 |
20-years and above |
May 4, 2006 |
4,000 |
28.26 |
8.14 |
||
|
4. |
May 16-24, 2006 |
5,000 |
15-19 years |
May 23, 2006 |
5,000 |
15.00 |
7.94 |
|
5. |
June 1-8, 2006 |
6,000 |
5-9 years |
June 6, 2006 |
6,000 |
5.07 |
8.33 |
|
4,000 |
20-years and above |
June 6, 2006 |
4,000 |
30.00 |
7.39 |
||
|
6. |
June 15-24, 2006 |
5,000 |
15-19 years |
June 22, 2006 |
5,000 |
8.52 |
7.92 |
|
June 22, 2006 |
4,000 |
14.95 |
8.46 |
||||
|
7. |
July 3-11, 2006 |
6,000 |
10-14 years |
July 11, 2006 |
5,000 |
9.75 |
8.29 |
|
4,000 |
20-years and above |
July 11, 2006 |
2,000 |
28.08 |
8.75 |
||
|
8. |
July 17-25, 2006 |
5,000 |
15-19 years |
July 27, 2006 |
4,000 |
3.79 |
7.69 |
|
9. |
August 1-8, 2006 |
6,000 |
5-9 years |
August 8, 2006 |
6,000 |
4.90 |
7.94 |
|
3,000 |
20-years and above |
August 8, 2006 |
3,000 |
9.68 |
8.27 |
||
|
10. |
August 14-22, 2006 |
5,000 |
10-14 years |
August 18, 2006 |
3,000 |
29.79 |
8.72 |
|
3,000 |
20-years and above |
August 18, 2006 |
5,000 |
10.40 |
8.12 |
||
|
11. |
September 4-12, 2006 |
6,000 |
10-14 years |
September 8, 2006 |
6,000 |
9.59 |
7.76 |
|
3,000 |
20-years and above |
September 8, 2006 |
3,000 |
27.91 |
8.45 |
||
|
12. |
October 6-13, 2006 |
6,000 |
10-14 years |
October 13, 2006 |
6,000 |
9.49 |
7.63 |
|
3,000 |
20-years and above |
October 13, 2006 |
3,000 |
29.64 |
8.10 |
||
on July 11, 2006. Furthermore, the notified amount of issuance was lowered from Rs.5000 crore to Rs.4000 crore on July 27, 2006. During the year so far, 22 securities have been issued. While 19 securities were reissues, three new securities of 10-, 15- and 30-year maturity were issued to provide benchmarks in the respective segments. Gross and net market borrowings (including dated securities and 364-day Treasury Bills) raised by the Centre during 2006-07 (up to October 23, 2006) amounted to 64.1 per cent and 58.0 per cent of the budget estimates as compared with 61.4 per cent and 51.7 per cent, respectively, a year ago.
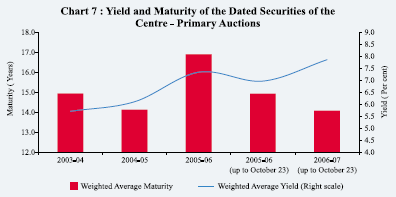
During 2006-07 (up to October 23, 2006), the weighted average maturity of dated securities of the Central Government at 14.08 years was lower than that of 15.11 years in the corresponding period of the preceding year. The weighted average yield of the dated securities issued over the same period, on the other hand, increased to 7.92 per cent from 7.29 per cent (Chart 7). In this context, it may be noted that the average secondary market yield on 10-year Central Government securities has increased from 6.97 per cent during April-September 2005 to 7.86 per cent during April-September 2006.
With a view to achieving a smooth transition to the new regime as envisaged in the FRBM Act whereby the participation of the Reserve Bank in the primary issuance of Central Government securities has been prohibited with effect from April 1, 2006, the Ways and Means Advances (WMA) arrangements for 2006-07 were revised in consultation with the Government. As per the revised arrangement, the limits would be fixed on a quarterly basis instead of the existing half-yearly basis. Accordingly, the WMA limits for 2006-07 have been placed at Rs.20,000 crore and Rs.10,000 crore for the first and second quarters, respectively, and Rs.6,000 crore each for the third and fourth quarters of the year. The Reserve Bank would
retain the flexibility to revise the limits in consultation with the Government of India taking into consideration the transitional issues and prevailing circumstances. Furthermore, the interest rates on WMA and overdraft have been linked to the repo rate as against the Bank Rate hitherto, following emergence of the repo rate as the short-term reference rate. Accordingly, the interest rate on WMA is at the repo rate and that on overdraft is at repo rate plus two percentage points.
The Central Government has taken recourse to WMA on 39 days during 2006-07 (up to October 20) as compared with only two days during the entire fiscal year 2005-06. The average WMA utilisation during 2006-07 (up to September 30) was Rs.801 crore as compared with Rs.14 crore in the corresponding period of the preceding year.
State Finances
Financing of the States’ Budgets
The provisional net allocation under market borrowing programme for the State
Governments is placed at Rs.17,242 crore during 2006-07. Taking into account
the additional allocation of Rs.35 crore in respect of Arunachal Pradesh and
repayments of Rs.6,551 crore, the gross allocation amounts to Rs.23,828 crore.
During 2006-07 so far (up to October 23, 2006), the States have raised market
loans amounting to Rs.8,595 crore (or 36.1 per cent of gross allocation) through
auctions with cut-off rates in the range of 7.65-8.66 per cent (Table 15).
|
Table 15: Market Borrowings of State Governments during 2006-07 |
||||||
|
Cut-off |
Tenor |
Amount |
||||
|
Rate |
(Years) |
Raised |
||||
|
Items |
Date |
(Per cent) |
(Rupees crore) |
|||
|
1 |
2 |
3 |
4 |
5 |
||
|
A. |
Tap Issues |
– |
– |
– |
– |
|
|
B. |
Auctions (i to xvii) |
8,595 |
||||
|
i. |
First |
April 27, 2006 |
7.65 |
10 |
300 |
|
|
ii. |
Second |
May 11, 2006 |
7.89 |
10 |
500 |
|
|
iii. |
Second |
May 11, 2006 |
8.00 |
10 |
1,646 |
|
|
iv. |
Second |
May 11, 2006 |
7.95 |
10 |
881 |
|
|
v. |
Second |
May 11, 2006 |
8.04 |
10 |
150 |
|
|
vi. |
Second |
May 11, 2006 |
7.96 |
10 |
130 |
|
|
vii. |
Second |
May 11, 2006 |
7.87 |
10 |
400 |
|
|
viii. |
Second |
May 11, 2006 |
7.91 |
10 |
500 |
|
|
ix. |
Second |
May 11, 2006 |
7.98 |
10 |
57 |
|
|
x. |
Second |
May 11, 2006 |
8.05 |
10 |
15 |
|
|
xi. |
Second |
May 11, 2006 |
7.93 |
10 |
1,307 |
|
|
xii. |
Third |
July 13, 2006 |
8.65 |
10 |
933 |
|
|
xiii. |
Third |
July 13, 2006 |
8.66 |
10 |
300 |
|
|
xiv. |
Third |
July 13, 2006 |
8.62 |
10 |
225 |
|
|
xv. |
Fourth |
August 25, 2006 |
8.11 |
10 |
1,050 |
|
|
xvi. |
Fifth |
October 18, 2006 |
7.99 |
10 |
153 |
|
|
xvii. |
Fifth |
October 18, 2006 |
8.04 |
10 |
48 |
|
|
Grand Total (A+B) |
8,595 |
|||||
|
Source : Reserve Bank of India. |
||||||
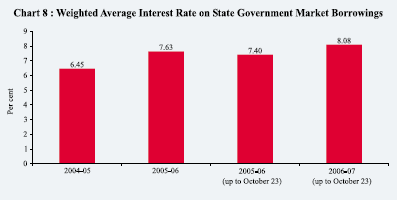
The weighted average interest rate of market loans firmed up to 8.08 per cent during 2006-07 (up to October 23, 2006) from 7.40 per cent in the corresponding period of the previous year (Chart 8).
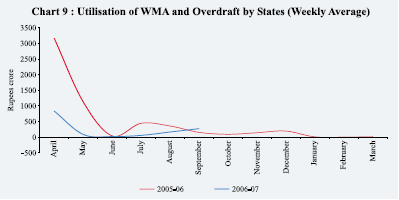
The liquidity position of the States has remained comfortable during 2006-07 so far. The weekly average utilisation of WMA and overdraft by the States at Rs.121 crore in 2006-07 (up to September 30, 2006) was substantially lower than that of Rs.885 crore in the corresponding period of 2005-06 (Chart 9). Two States have resorted to overdraft during 2006-07 (up to September 30, 2006) as compared with nine States during the corresponding period of the previous year.
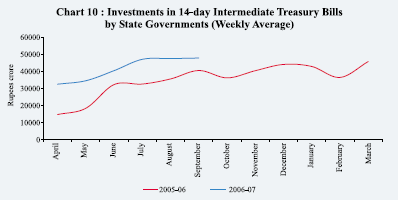
Concomitantly, the weekly average investment by the States in the 14-day Treasury Bills during 2006-07 (up to end-September 2006) at Rs.41,677 crore was considerably higher than that of Rs.29,052 crore in the corresponding period of the previous year (Chart 10).

Share this page:


Install the RBI mobile application and get quick access to the latest news!
Scan the QR code to install our app


Page Last Updated on:


