Combined Government Finances: 2006-07
Combined
Government finances were budgeted to improve in 2006-07, with key fiscal ratios
placed 0.8-1.0 percentage points of GDP lower than in 2005-06, reflecting the
improvement in the finances of both the Central and State Governments (Table
14). This was envisaged to be achieved through a reduction in expenditure
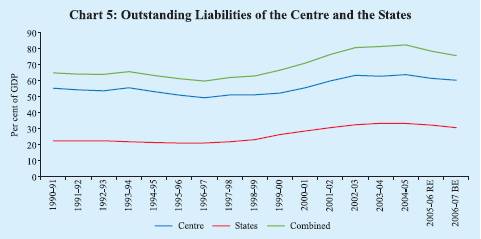
(as percentage of GDP), particularly in the revenue account. The combined debt-GDP
ratio was budgeted to decline from 78.5 per cent at end-March 2006 to 75.7 per
cent at end-March 2007
(Chart 5).
The combined fiscal
deficit during 2006-07 was budgeted to be financed primarily from domestic resources.
Market borrowings were budgeted to finance 52.4 per cent of the gross fiscal deficit
(GFD) during 2006-07 (45.5 per cent a year ago) while other liabilities (small
savings, provident funds, reserve funds and deposits and advances) were budgeted
to finance 44.9 per cent (43.7 per cent in 2005-06). External assistance was budgeted
to finance 3.2 per cent of the combined fiscal deficit during 2006-07 as compared
with 2.9 per cent in 2005-06 (Chart 6).
Table
14: Key Fiscal Indicators | (Per
cent to GDP) | Year | Revenue
Deficit | Gross Fiscal Deficit | Primary
Deficit | 1 | 2 | 3 | 4 |
Centre |
2003-04 | 3.6 | 4.5 | -0.03 |
2004-05 | 2.5 | 4.0 | -0.04 |
2005-06 | 2.6 | 4.1 | 0.4 |
2006-07 BE | 2.1 | 3.8 | 0.2 |
2006-07 RE | 2.0 | 3.7 | 0.1 |
2007-08 BE | 1.5 | 3.3 | -0.2 |
States |
2002-03 | 2.2 | 4.2 | 1.3 |
2003-04 | 2.2 | 4.5 | 1.5 |
2004-05 | 1.2 | 3.5 | 0.7 |
2005-06 RE | 0.5 | 3.2 | 0.7 |
2006-07 BE | 0.1 | 2.7 | 0.2 |
Combined
| 2002-03 | 6.6 | 9.6 | 3.1 |
2003-04 | 5.8 | 8.5 | 2.1 |
2004-05 | 3.7 | 7.5 | 1.4 |
2005-06 RE | 3.1 | 7.4 | 1.6 |
2006-07 BE | 2.2 | 6.4 | 0.8 |
RE: Revised Estimates. BE: Budget Estimates.
Note:
The fiscal ratios for finances of the Centre are from
the Union Budget 2007-08.
The fiscal ratios in respect of States and Combined
finances for 2005-06 RE and 2006-07 BE are based on CSO’s Quick Estimates
and Advance Estimates, respectively. |
Centre’s
Fiscal Situation: 2006-07
According to the revised estimates
for 2006-07, the key deficit indicators of the Union Government, viz.,
revenue deficit, gross fiscal deficit and primary deficit, relative to GDP, were
placed lower than the budgeted levels. This mainly reflected buoyancy in revenue
receipts, which more than offset the increased expenditures, particularly, in
respect of interest payments, fertiliser and interest subsidies, and non-defence
capital outlay. The Government could, therefore, effect reduction of 0.1 percentage
point of GDP in each of the three key fiscal indicators vis-à-vis
the budgeted levels. The reductions in GFD and revenue deficit (RD), relative
to GDP, 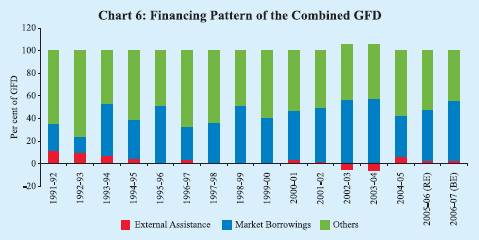
of
0.4 percentage points and 0.6 percentage points, respectively, during 2006-07
(RE) over 2005-06 were also more than the minimum thresholds of 0.3 percentage
points and 0.5 percentage points of GDP, respectively, stipulated under the Fiscal
Responsibility and Budget Management (FRBM) Rules, 2004. The fiscal consolidation
process was, thus, resumed during 2006-07 after a pause in 2005-06.
Revenue
receipts in the revised estimates showed an increase of 4.9 per cent over the
budgeted levels and were placed at 10.3 per cent of GDP. This was mainly on account
of higher net tax revenue (5.7 per cent higher than budgeted) (Table
15), in turn, due to higher than budgeted collections in respect of personal
income tax, corporation tax, customs duties and new taxes. However, collections
under excise duties in the revised estimates were lower than the budget estimates
(Chart 7). The collections under non-tax revenues were also
better than the budget estimates on account of higher dividends and profits (10.7
per cent) and interest receipts (4.5 per cent). Among the capital receipts, recoveries
of loans and advances were lower than budgeted, reflecting the impact of the debt
waiver to the State Governments under the Twelfth Finance Commission (TFC) award.
The aggregate expenditure in the revised estimates for 2006-07 was 3.1 per
cent higher than the budget estimates on account of higher revenue expenditure,
particularly in interest payments, subsidies and grants to States (Table
16).
The total expenditure on subsidies at Rs.53,463 crore (1.3 per
cent of GDP) in the revised estimates for 2006-07 was 15.7 per cent higher than
the budgeted amount mainly on account of fertiliser and interest subsidies exceeding
Table
15: Receipts of the Centre | (Amount
in Rupees crore) | Item | | 2005-06 | 2006-07 | 2006-07 | Variation
(4 over 3) | | | | (Accounts) | (BE) | (RE) | | |
| | | | | | Amount | Per
cent | 1 | | | 2 | 3 | 4 | 5 | 6 |
1. | Total
Receipts (2+3) | 5,06,123 | 5,63,991 | 5,81,637 | 17,646 | 3.1 |
| | | (14.2) | (14.3) | (14.2) | | |
2. | Revenue
Receipts (i+ii) | 3,47,462 | 4,03,465 | 4,23,331 | 19,866 | 4.9 |
| | | (9.7) | (10.2) | (10.3) | | |
| i) | Tax
Revenue (Net) | 2,70,264 | 3,27,205 | 3,45,971 | 18,766 | 5.7 |
| | | (7.6) | (8.3) | (8.4) | | |
| ii) | Non-Tax
Revenue | 77,198 | 76,260 | 77,360 | 1,100 | 1.4 |
| | | (2.2) | (1.9) | (1.9) | | |
3. | Capital
Receipts | 1,58,661 | 1,60,526 | 1,58,306 | -2,220 | -1.4 |
| | | (4.4) | (4.1) | (3.9) | | |
| of
which: | | | | | |
| Market
Borrowings | 1,06,241 | 1,13,778 | 1,10,500 | -3,278 | -2.9 |
| Recoveries
of Loans | 10,645 | 8,000 | 5,450 | -2,550 | -31.9 |
| Disinvestment
Proceeds | 1,581 | 3,840 | 528* | -3,312 | -86.3 |
RE: Revised Estimates. BE: Budget
Estimates.
* Represents bonus shares issued by Oil and Natural Gas Corporation
(ONGC) Ltd.
Note : Figures in parentheses are percentages
to GDP. | 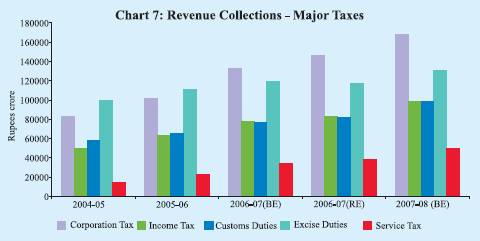
the
budget estimates by Rs.5,199 crore (30.1 per cent) and Rs.2,320 crore (478.4 per
cent), respectively (Chart 8). While fertilisers subsidies
increased from Rs.17,253 crore in the budget estimates to Rs.22,452 crore in the
revised estimates, interest subsidies increased from Rs.485 crore to Rs.2,805
crore. Fertiliser subsidies were higher than the budget estimates on account of
increase in input costs and cost of imported fertiliser. Interest relief to debt
stressed farmers
Table
16: Aggregate Expenditure of the Centre | (Amount
in Rupees crore) | Item | 2005-06
(Accounts) | 2006-07(BE) | 2006-07(RE) | Variation
(4 over 3) | | | | | | Amount | Per
cent | 1 | | 2 | 3 | 4 | 5 | 6 |
1. | Total
Expenditure (2+3 = 4+5) | 5,06,123 | 5,63,991 | 5,81,637 | 17,646 | 3.1 |
| | (14.2) | (14.3) | (14.2) | | |
2. | Non-Plan
Expenditure | 3,65,485 | 3,91,263 | 4,08,907 | 17,644 | 4.5 |
| | (10.2) | (9.9) | (10.0) | | |
| of
which: | | | | | |
| Interest
Payments | 1,32,630 | 1,39,823 | 1,46,192 | 6,369 | 4.6 |
| | (3.7) | (3.5) | (3.6) | | |
| Defence
Expenditure | 80,549 | 89,000 | 86,000 | -3,000 | -3.4 |
| | (2.3) | (2.3) | (2.1) | | |
| Subsidies | 47,520 | 46,213 | 53,463 | 7,250 | 15.7 |
| | (1.3) | (1.2) | (1.3) | | |
3. | Plan
Expenditure | 1,40,638 | 1,72,728 | 1,72,730 | 2 | 0.0 |
| | (3.9) | (4.4) | (4.2) | | |
4. | Revenue
Expenditure | 4,39,761 | 4,88,192 | 5,06,767 | 18,575 | 3.8 |
| | (12.3) | (12.4) | (12.4) | | |
5. | Capital
Expenditure | 66,362 | 75,799 | 74,870 | -929 | -1.2 |
| | (1.9) | (1.9) | (1.8) | | |
RE : Revised Estimates. BE :
Budget Estimates.
Note : Figures in parentheses are percentages
to GDP. | 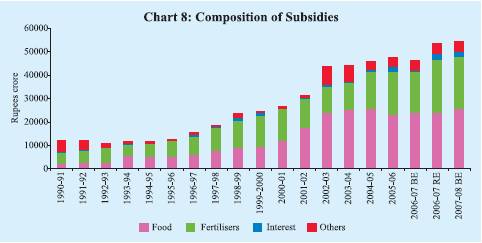
and
provision of interest subvention on short-term credit to farmers led to higher
than budgeted interest subsidies.
Financing of the Union Budget
Gross and net market
borrowings (dated securities and 364-day Treasury Bills excluding allocations
under the Market Stabilisation Scheme) of the Centre for 2006-07 were budgeted
at Rs.1,79,716 crore and Rs.1,13,778 crore, respectively. In the revised estimates,
net market borrowings were placed lower at Rs.1,10,500 crore, thus, financing
72.5 per cent of GFD. Apart from market borrowings, drawdown of cash balances
financed 7.2 per cent of GFD in the revised estimates as compared to nil percentage
in the budget estimates. In the public account, deposits and advances, state provident
funds and reserve funds financed 7.6 per cent, 3.3 per cent and 2.8 per cent,
respectively, of GFD.
According to the Reserve Bank records, actual gross
market borrowings by the Central Government through dated securities and 364-day
Treasury Bills amounted to Rs.1,79,373 crore (net Rs.1,11,270 crore) during 2006-07.
Gross market borrowings through dated securities by the Central Government amounted
to Rs.1,46,000 crore (net Rs.1,06,916 crore) during 2006-07 as compared with Rs.1,31,000
crore (net Rs.98,370 crore) during the previous year (Table 17).
Gross market borrowings through dated securities during 2006-07 were 94 per cent
of the budget estimates, the same as that in the previous year. Of the 33 auctions
held during 2006-07, 30 auctions were in respect of reissuance of existing securities.
Three new securities of 10-year, 15-year and 30-year were issued to provide a
benchmark in the secondary market. The total devolvement on the primary dealers
(PDs) was Rs.5,604 crore.
Table
17: Central Government Securities Issued during 2006-07 |
(Amount in Rupees
crore/Maturity in years) | | Borrowings
as per Issuance Auction Calendar | Actual
Borrowings | |
Sr. No. | Date
of
Auction | Amount | Residual
Maturity | Date of
Auction | Amount | Residual
Maturity | Yield
(Per
cent) | 1 | 2 | 3 | 4 | 5 | 6 | 7 | 8 |
1. | April
3-12, 2006 | 5,000 | 10
-14 | April 10, 2006 | 5,000 | 10.00 | 7.59 |
| | 3,000 | 20
and above | April 10, 2006 | 3,000 | 28.30 | 7.97 |
2. | April
18-25, 2006 | 6,000 | 5-9 | April
25, 2006 | 6,000 | 6.02 | 7.06 |
| | 4,000 | 20
and above | April 25, 2006 | 4,000 | 26.34 | 8.00 |
3. | May
2-9,2006 | 6,000 | 10-14 | May
4, 2006 | 6,000 | 9.94 | 7.55 |
| | 4,000 | 20
and above | May 4, 2006 | 4,000 | 28.26 | 8.14 |
4. | May
16-24, 2006 | 5,000 | 15
-19 | May 23, 2006 | 5,000 | 15.00 | 7.94 |
5. | June
1- 8, 2006 | 6,000 | 5-9 | June
6, 2006 | 6,000 | 5.07 | 7.39 |
| | 4,000 | 20
and above | June 6, 2006 | 4,000 | 30.00 | 8.33 |
6. | June
15-24, 2006 | 5,000 | 15-19 | June
22, 2006 | 5,000 | 7.81 | 7.92 |
| | | | June
22, 2006# | 4,000 | 14.92 | 8.46 |
7. | July
3-11, 2006 | 6,000 | 10-14 | July
11, 2006 | 5,000 | 9.75 | 8.29 |
| | 4,000 | 20
and above | July 11, 2006 | 2,000 | 28.08 | 8.75 |
8. | July
17-25, 2006 | 5,000 | 15-19 | July
27, 2006 | 4,000 | 3.79 | 7.69 |
9. | August
1-8, 2006 | 6,000 | 5-9 | August
8, 2006 | 6,000 | 4.90 | 7.94 |
| | 3,000 | 20
and above | August 8, 2006 | 3,000 | 9.68 | 8.27 |
10. | August
14-22, 2006 | 5,000 | 10-14 | August
18, 2006 | 5,000 | 10.40 | 8.12 |
| | 3,000 | 20
and above | August 18, 2006 | 3,000 | 29.79 | 8.72 |
11. | September
4-12, 2006 | 6,000 | 10-14 | September
8, 2006 | 6,000 | 9.59 | 7.76 |
| | 3,000 | 20
and above | September 8, 2006 | 3,000 | 27.91 | 8.45 |
12. | October
6-13, 2006 | 6,000 | 10
-14 | October 13, 2006 | 6,000 | 9.49 | 7.63 |
| | 3,000 | 20
and above | October 13, 2006 | 3,000 | 29.64 | 8.10 |
13. | November
3-10, 2006 | 6,000 | 5-9 | November
3, 2006 | 6,000 | 5.49 | 7.50 |
| | 3,000 | 20
and above | November 3, 2006 | 3,000 | 27.76 | 8.02 |
14. | November
17-24, 2006 | 5,000 | 10-14 | November
24, 2006 | 5,000 | 10.13 | 7.43 |
15. | December
1-8, 2006 | 6,000 | 5-9 | December
8, 2006 | 5,000 | 7.35 | 7.31 |
| | 3,000 | 20
and above | December 8, 2006 | 4,000 | 29.49 | 7.63 |
16. | January
5-12, 2007 | 5,000 | 10-14 | Not
issued | – | – | – |
| | 4,000 | 20
and above | January 12, 2007 | 4,000 | 29.39 | 8.24 |
17. | January
18-25, 2007 | 5,000 | 15-20 | January
25, 2007 | 5,000 | 14.32 | 8.20 |
18. | February
2-9, 2007 | 6,000 | 5-9 | February
9, 2007 | 6,000 | 7.18 | 7.88 |
| | 3,000 | 20
and above | February 9, 2007 | 3,000 | 29.32 | 8.19 |
19. | March
2-9, 2007 | 5,000 | 10-14 | March
9, 2007 | 4,000 | 9.84 | 8.06 |
| | 3,000 | 20
and above | March 9, 2007 | 3,000 | 29.24 | 8.40 |
# : Not scheduled. |
The weighted average yield of the dated securities
issued during 2006-07 increased to 7.89 per cent from 7.34 per cent during the
previous year. The weighted average maturity of the dated securities issued during
the year, on the other hand, fell to 14.72 years from 16.90 years during 2005-06
(Chart 9).
With the Reserve Bank withdrawing from
participation in the primary issuance of the Central Government securities with
effect from April 1, 2006 in accordance with the FRBM Act, 2003, the Ways and
Means Advances (WMA) arrangements were revised from 2006-07 in consultation with
the Government. Under the previous arrangements, the limits of WMA were fixed
on a half-yearly basis. For 2005-06, the limits were Rs.10,000 crore for the first
half of the fiscal 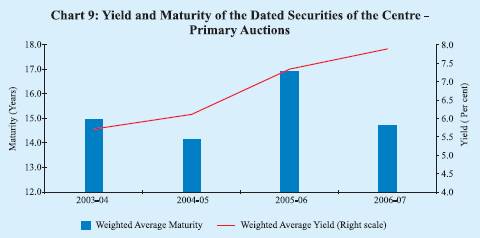
year
(April-September) and Rs.6,000 crore for the second half of the fiscal year (October-March).
In order to facilitate the transition necessitated by the new FRBM provisions,
under the revised arrangements, the limits for 2006-07 were fixed on a quarterly
basis instead of half-yearly basis. Accordingly, the WMA limits for 2006-07 were
placed at Rs.20,000 crore and Rs.10,000 crore for the first and second quarters,
respectively, and Rs.6,000 crore each for the third and fourth quarters of the
year. The Reserve Bank retained the flexibility to revise the limits in consultation
with the Government of India taking into consideration the transitional issues
and prevailing circumstances. Furthermore, interest rates on WMA and overdraft
have been linked to the repo rate as against the Bank Rate hitherto, following
emergence of the repo rate as the short-term reference rate. Accordingly, the
interest rate on WMA is at the repo rate and that on overdraft is at repo rate
plus two percentage points.
The Central Government took recourse
to WMA on 39 days during 2006-07 as compared with only two days during 2005-06.
The average WMA utilisation during 2006-07 was Rs.402 crore as compared with Rs.3
crore in the previous year. The peak WMA availed amounted to Rs.11,754 crore on
June 6, 2006. The Central Government did not resort to overdraft during the year.
The surplus cash balances of the Centre which amounted to Rs.48,928 crore
at end-March 2006 dwindled rapidly during April-May 2006. The Centre has, however,
been maintaining surplus cash balance from August 8, 2006, mainly reflecting parking
of surplus cash by the State Governments in the 14-day Intermediate Treasury Bills
during the greater part of the year. The surplus balance rose to an intra-year
high of Rs.77,473 crore on March 21, 2007, reflecting buoyancy in advance
tax collections. As on March 31, 2007, the surplus balance amounted to Rs.50,092
crore. The daily surplus balance of the Central Government averaged Rs.28,022
crore during 2006-07 as compared with Rs.25,296 crore a year ago. State
Finances: 2006-07
Revenue deficit (RD) and gross fiscal deficit
(GFD) of State Governments were budgeted at 0.1 per cent and 2.7 per cent, respectively,
of GDP during 2006-07 -a reduction of 0.4 percentage points and 0.5 percentage
points, respectively, over the previous year (Table 14).
State budgets for 2006-07 reflect the efforts of the State Governments to pursue
the process of fiscal correction and consolidation through the progressive enactment
of Fiscal Responsibility Legislations (FRLs). The State Governments were aided
in their effort by larger devolution and transfer through shareable Central taxes
and grants under the TFC award. Furthermore, all States, barring Uttar Pradesh,
have implemented value added tax (VAT) in lieu of sales tax, which is
expected to provide buoyancy to the States’ own tax revenue. Recognising
that sustained fiscal correction lies in revenue augmentation, the State Governments
in their budgets for 2006-07 laid stress on improvement in tax administration
and streamlining and strengthening of tax and non-tax collections. For improving
accountability of budget proposals, some States proposed to introduce ‘Outcome
Budget’. Several States announced introduction of new pension scheme based
on defined contribution to restrict their rising pension obligations. The States
also proposed to improve spending on education and health sector and implement
the centrally sponsored scheme of rural employment guarantee scheme.
The fiscal correction in the revenue account during 2006-07 was proposed to be
achieved primarily through containment of growth in revenue expenditure to 11.3
per cent in 2006-07 from 15.4 per cent in the previous year. As a proportion to
GDP, revenue expenditure was envisaged to decline to 12.8 per cent during 2006-07
(BE) from 13.2 per cent in the previous year (Chart 10).
Revenue receipts were budgeted to be maintained at the level of 12.7 per cent
of GDP in 2006-07 (BE). States’ own tax as well as own non-tax revenues,
as percentage to GDP, at 6.3 per cent and 1.3 per cent, respectively, during 2006-07
(BE) would remain the same as 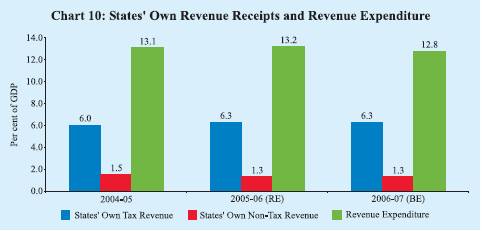
a year ago. Higher grants coupled with the incentives
provided by the TFC towards restructuring of State finances aided the States in
their endeavour for fiscal correction and consolidation.
The decomposition
of GFD of the State Governments reveals an improvement in the quality of fiscal
consolidation, with the share of revenue deficit budgeted to decline substantially
to 4.1 per cent in 2006-07 from 15.1 per cent in the previous year. Correspondingly,
the share of capital outlay would move up from 74.9 per cent in 2005-06 (RE) to
88.0 per cent in 2006-07 (BE). As regards financing of GFD, securities issued
to the National Small Savings Fund (NSSF) would continue to be the major source
of financing, although its share would decline from 65.4 per cent to 53.1 per
cent. Market borrowings with their share at 20.8 per cent (16.4 per cent during
the previous year) would finance a larger share of GFD during 2006-07 (Table
18).
Table
18: Decomposition and Financing Pattern of GFD of States |
(Per cent) |
Item | 1990-95 | 1995-2000 | 2000-04 | 2004-05 | 2005-06 | 2006-07 |
| | (Average) | (Average) | (Average) | | (RE) | (BE) |
1 | | | 2 | 3 | 4 | 5 | 6 | 7 |
Decomposition (1 to 4) | | 100.0 | 100.0 | 100.0 | 100.0 | 100.0 | 100.0 |
1. | Revenue Deficit | | 24.7 | 44.8 | 56.3 | 33.3 | 15.1 | 4.1 |
2. | Capital Outlay | | 55.3 | 43.3 | 36.7 | 56.3 | 74.9 | 88.0 |
3. | Net Lending | | 20.0 | 12.2 | 7.0 | 10.3 | 10.0 | 8.8 |
4. | Disinvestment | | – | -0.2 | – | – | – | -0.9 |
| | | | | | | | |
Financing (1 to 11) | | 100.0 | 100.0 | 100.0 | 100.0 | 100.0 | 100.0 |
1. | Market Borrowings | | 16.0 | 16.1 | 24.6 | 31.6 | 16.4 | 20.8 |
2. | Loans from Centre | | 49.0 | 40.6 | 7.8 | -10.8 | 1.9 | 4.4 |
3. | Special Securities issued
to NSSF/Small Savings | | – | 28.9* | 35.4 | 62.2 | 65.4 | 53.1 |
4. | Loans from
LIC, NABARD, NCDC, SBI and | | | | | | |
| other banks | | 1.8 | 2.8 | 4.9 | –** | 4.9 | 6.9 |
5. | State Provident Fund | | 14.3 | 13.4 | 8.3 | 7.2 | 7.9 | 8.0 |
6. | Reserve Funds | | 6.8 | 5.5 | 4.5 | 6.5 | 2.9 | 4.0 |
7. | Deposits and Advances | | 9.8 | 9.8 | 3.4 | 7.4 | -0.6 | -1.1 |
8. | Suspense and
Miscellaneous | 4.3 | 2.7 | -0.4 | -2.4 | 3.3 | 3.3 |
9. | Remittances | | -1.4 | -3.6 | 0.6 | 1.1 | 0.8 | 1.8 |
10. | Overall Surplus(+)/Deficit(-) | 4.4 | -2.6 | 1.1 | 9.6 | 4.9 | 3.6 |
11. | Others | | -5.0 | 9.5 | 9.8 | -12.4
$ | -7.9 | -4.7 |
BE: Budget Estimates. RE: Revised Estimates.
– : Negligible/Not applicable.
* : Pertains to 1999-2000 as the scheme
was introduced from that year only. The sum of items will
not be equal to 100
for 1995-2000 (Average).
** : Tamil Nadu has shown a negative figure of Rs.1,376
crore under Loans from National Co operative Development Corporation (NCDC) on
account of adjustment of
Tamil Nadu Industrial Development Corporation (TIDCO)
bonds.
$ : On account of Land Compensation and other bonds ( Rs.1,962 crore)
issued by Government of Tamil Nadu.
Notes :
1. ‘Others’
is a residual item and includes, inter alia, Contingency Funds, Appropriation
to
Contingency Funds, Miscellaneous Capital Receipts, Inter-State Settlement,
Land Compensation and Other Bonds and Loans from Financial Institutions other
than those mentioned in the Table.
2. Due to the change in the accounting
procedure from 1999-2000, Loans from the Centre exclude States’ share in
small saving collections which are shown under Securities issued to the NSSF under
internal debt.
Accordingly, repayments of small saving collections included
in under repayments of Loans to the Centre are now shown under discharge of Internal
Debt to have consistent accounting for receipts and expenditure.
3. Figures
for 2004-05 (Accounts) in respect of Jammu & Kashmir and Jharkhand relate
to Revised Estimates.
4. All financing items are on net basis.
Source
: Budget Documents of State Governments. | Market
Borrowings
The provisional net allocation of market borrowings for
all State Governments during 2006-07 was placed at Rs.17,243 crore. The gross
allocation of market borrowings amounted to Rs.26,597 crore, including the additional
allocation of Rs.2,803 crore and repayments of Rs.6,551 crore. During 2006-07,
the States raised market loans amounting to Rs.20,825 crore (or 78.3 per cent
of gross allocation) through auctions, with cut-off rates in the range 7.65-8.66
per cent (Table 19). The
Table
19: Market Borrowings of State Governments during 2006-07 |
Item | | Date | Cut-off
Rate | Tenor | Amount
Raised | | | | | (Per
cent) | (Years) | (Rupees
crore) | 1 | | | 2 | 3 | 4 | 5 |
A. | Tap
Issues | – | – | – | – |
B. | Auctions
(i to xii) | | | | 20,825 |
| i. | First | April
27, 2006 | 7.65 | 10 | 300 |
| ii. | Second | May
11, 2006 | 7.89 | 10 | 500 |
| | | | 8.00 | 10 | 1,646 |
| | | | 7.95 | 10 | 881 |
| | | | 8.04 | 10 | 150 |
| | | | 7.96 | 10 | 130 |
| | | | 7.87 | 10 | 400 |
| | | | 7.91 | 10 | 500 |
| | | | 7.98 | 10 | 57 |
| | | | 8.05 | 10 | 15 |
| | | | 7.93 | 10 | 1,307 |
| iii. | Third | July
13, 2006 | 8.65 | 10 | 933 |
| | | | 8.66 | 10 | 300 |
| | | | 8.62 | 10 | 225 |
| iv. | Fourth | August
25, 2006 | 8.11 | 10 | 1,050 |
| v. | Fifth | October
17, 2006 | 7.99 | 10 | 153 |
| | | | 8.04 | 10 | 48 |
| vi. | Sixth | November
16, 2006 | 7.74 | 10 | 2,184 |
| | | | 7.80 | 10 | 91 |
| | | | 7.82 | 10 | 156 |
| vii. | Seventh | December
14, 2006 | 7.81 | 10 | 340 |
| | | | 7.89 | 10 | 166 |
| | | | 7.93 | 10 | 809 |
| | | | 7.94 | 10 | 455 |
| | | | 7.99 | 10 | 193 |
| viii.Eighth | January
18, 2007 | 7.99 | 10 | 300 |
| | | | 7.99 | 10 | 100 |
| | | | 7.99 | 10 | 315 |
| | | | 7.96 | 10 | 500 |
| ix. | Ninth | February
2, 2007 | 7.95 | 10 | 200 |
| x. | Tenth | February
22, 2007 | 8.17 | 10 | 375 |
| | | | 8.10 | 10 | 47 |
| | | | 8.20 | 10 | 213 |
| | | | 8.19 | 10 | 300 |
| | | | 8.20 | 10 | 350 |
| | | | 8.19 | 10 | 500 |
| | | | 8.45 | 10 | 1,615 |
| xi. | Eleventh | March
13, 2007 | 8.38 | 10 | 212 |
| | | | 8.45 | 10 | 250 |
| | | | 8.40 | 10 | 470 |
| | | | 8.39 | 10 | 67 |
| | | | 8.39 | 10 | 70 |
| | | | 8.39 | 10 | 90 |
| | | | 8.32 | 10 | 300 |
| | | | 8.25 | 10 | 200 |
| | | | 8.32 | 10 | 414 |
| | | | 8.38 | 10 | 211 |
xii. | Twelfth | March
23, 2007 | 8.35 | 10 | 738 |
| | | | | | |
Grand Total (A+B) | | | | 20,825 |
Source : Reserve Bank of
India. | 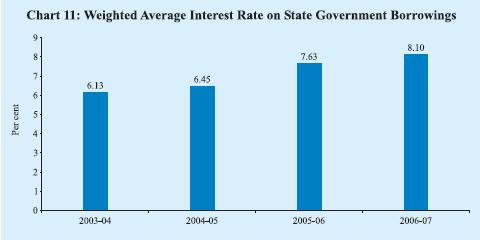
weighted
average interest rate of market loans increased to 8.10 per cent during 2006-07
from 7.63 per cent during the previous year (Chart 11).
The liquidity position of the States remained comfortable during 2006-07.
This was reflected in the weekly average investment by the States in the 14-day
Treasury Bills which increased further during 2006-07 to Rs.43,075 crore from
Rs.35,278 crore in the previous year (Chart 12).
The surplus cash balances of the State Governments are automatically invested
in 14-day Treasury Bills. The weekly average utilisation of WMA and overdraft
by the States at Rs.234 crore in 2006-07 was lower than that of Rs.482 crore in
2005-06 (Chart 13). 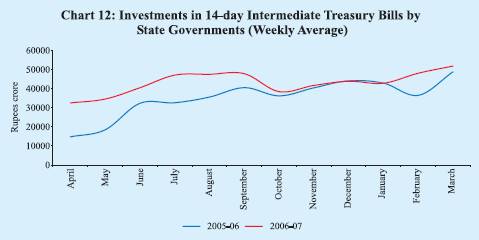
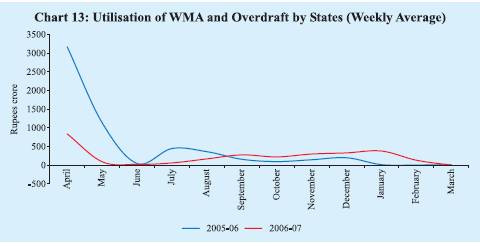
Two States resorted to overdraft during 2006-07
as compared with eight States during the previous year.
Fiscal
Outlook: 2007-08
The Union Budget for 2007-08 proposes to continue
the fiscal consolidation process, with the key deficit indicators, viz.,
gross fiscal deficit (GFD), revenue deficit (RD) and primary deficit (PD), budgeted
to be lower by 0.3-0.5 percentage points of GDP in 2007-08 than the previous year
(Table 20). The Budget envisages a revenue-led fiscal consolidation
along with reprioritisation of expenditure to augment allocations for improvement
in the social and physical infrastructure, particularly in the rural areas so
as to achieve a ‘faster and more inclusive’ growth process. The revenue
deficit relative to GDP is budgeted to be reduced in 2007-08 by 0.5 percentage
points, which is the minimum stipulated threshold limit under the FRBM Rule, 2004;
therefore, a substantial correction in the revenue deficit of 1.5 percentage points
would be required in 2008-09, the terminal year for meeting the FRBM target.
The gross tax-GDP ratio, which has been rising since 2002-03, is budgeted
to improve from 11.4 per cent in 2006-07 (RE) to 11.8 per cent in 2007-08 (BE).
This reflects expectations of high growth as well as the impact of measures taken
to widen the tax base, rationalise exemptions and improve tax compliance (Table
21). The budget estimates of total expenditure in the Union Budget 2007-08
include a sum of Rs.40,000 crore allocated for acquiring the Reserve Bank’s
equity holding in the State Bank of India (SBI). As thistransaction is matched
by the non-debt capital receipt of an equal amount, there would be no impact on
the
Table
20: Union Budget 2007-08 at a Glance | (Amount
in Rupees crore) | Item | | 2006-07 | 2007-08 | Growth
rate
( per cent ) | | | | (RE) | (BE) | | |
| | | | | 2006-07 | 2007-08 |
1 | | | 2 | 3 | 4 | 5 |
1, | Revenue Receipts
(i+ii) | 4,23,331 | 4,86,422 | 21.8 | 14.9 |
| | | (10.3) | (10.5) | | |
| i) | Tax
Revenue (Net) | 3,45,971 | 4,03,872 | 28.0 | 16.7 |
| | | (8.4) | (8.7) | | |
| ii) | Non-Tax
Revenue | 77,360 | 82,550 | 0.2 | 6.7 |
| | | (1.9) | (1.8) | | |
2. | Non-Plan Expenditure | 4,08,907 | 4,35,421* | 11.9 | 6.5 |
| | | (10.0) | (9.4) | | |
| of which: | | | | |
| i) | Interest
Payments | 1,46,192 | 1,58,995 | 10.2 | 8.8 |
| | | (3.6) | (3.4) | | |
| ii) | Defence
Expenditure | 86,000 | 96,000 | 6.8 | 11.6 |
| | | (2.1) | (2.1) | | |
| iii) | Subsidies | 53,463 | 54,330 | 12.5 | 1.6 |
| | | (1.3) | (1.2) | | |
3. | Plan Expenditure | 1,72,730 | 2,05,100 | 22.8 | 18.7 |
| | | (4.2) | (4.4) | | |
4. | Revenue Expenditure | 5,06,767 | 5,57,900 | 15.2 | 10.1 |
| | | (12.4) | (12.0) | | |
5. | Capital Expenditure | 74,870 | 82,621* | 12.8 | 10.4 |
| | | (1.8) | (1.8) | | |
6. | Total Expenditure | 5,81,637 | 6,40,521* | 14.9 | 10.1 |
| | | (14.2) | (13.8) | | |
7. | Revenue Deficit | 83,436 | 71,478 | -9.6 | -14.3 |
| | | (2.0) | (1.5) | | |
8. | Gross Fiscal
Deficit | 1,52,328 | 1,50,948 | 4.0 | -0.9 |
| | | (3.7) | (3.3) | | |
9. | Gross Primary
Deficit | 6,136 | -8,047 | -55.6 | -231.1 |
| | | (0.1) | (-0.2) | | |
* : Adjusted for an amount of Rs.40,000 crore
on account of transactions relating to transfer of RBI’s stake in SBI to
the Government.
Note : Figures in parentheses are percentages
to GDP. | deficit indicators. Aggregate expenditure, after
adjusting for this transaction, is budgeted to increase by 10.1 per cent in 2007-08.
Growth in the revenue expenditure in 2007-08 is budgeted to decelerate to 10.1
per cent from 15.2 per cent in 2006-07 on account of containment of subsidies
and deceleration in the growth of interest payments. The capital outlay (adjusted
for transactions for purchasing stake in the SBI) is budgeted to increase by 15.3
per cent as compared with an increase of 18.4 per cent in 2006-07.
During
2007-08, net market borrowings (net of MSS) are budgeted to increase marginally
from Rs.1,10,500 crore in 2006-07 (RE) to Rs.1,10,827 crore. Inclusive of repayments
of Rs.76,942 crore, gross market borrowings, net of MSS, are
placed at Rs.1,87,769 crore in 2007-08. Net market borrowings would finance
Table
21: Gross Tax Revenues of the Centre | (Per
cent to GDP) | Year | Direct | Indirect | Total |
1 | 2 | 3 | 4 |
1990-91 | 1.9 | 8.2 | 10.1 |
1991-92 | 2.3 | 8.0 | 10.3 |
1992-93 | 2.4 | 7.5 | 10.0 |
1993-94 | 2.4 | 6.5 | 8.8 |
1994-95 | 2.7 | 6.5 | 9.1 |
1995-96 | 2.8 | 6.5 | 9.4 |
1996-97 | 2.8 | 6.6 | 9.4 |
1997-98 | 3.2 | 6.0 | 9.1 |
1998-99 | 2.7 | 5.6 | 8.3 |
1999-00 | 3.0 | 5.8 | 8.8 |
2000-01 | 3.2 | 5.7 | 9.0 |
2001-02 | 3.0 | 5.2 | 8.2 |
2002-03 | 3.4 | 5.4 | 8.8 |
2003-04 | 3.8 | 5.4 | 9.2 |
2004-05 | 4.2 | 5.5 | 9.8 |
2005-06 | 4.6 | 5.6 | 10.3 |
2006-07 RE | 5.6 | 5.8 | 11.4 |
2007-08 BE | 5.8 | 6.1 | 11.8 |
73.4 per cent of GFD in 2007-08 as compared with 72.5 per cent in the
revised estimates for 2006-07. Investments by the National Small Savings Fund
(NSSF) in the special Central Government securities are budgeted to finance 7.0
per cent of GFD as against 2.0 per cent in the previous year. This reflects
the reinvestment of redemption proceeds as well as investment from small savings
collections in Central Government special securities following the policy decision
to reduce the minimum obligation of the State Governments to borrow from the NSSF
to 80 per cent of net collections from 100 per cent. External assistance is budgeted
to finance 6.0 per cent of GFD as compared with 5.2 per cent of GFD in 2006-07. |
 IST,
IST,


