Combined Government Finances: 2007-08 The key fiscal indicators, viz., gross fiscal deficit (GFD), revenue deficit and primary deficit of combined finances of the Central and State Governments are budgeted to decline by 0.7-0.9 percentage points of GDP during 2007-08 over the revised estimates (RE) for 2006-07 (Table 15). The budgeted revenue surpluses by the States would be an important contributing factor to the envisaged reduction in the key deficit indicators. A significant feature of both the Central and State Government finances during 2007-08 would be higher allocation for development expenditure, while continuing with the process of fiscal consolidation. Reflecting the fiscal consolidation process and buoyancy in economic growth, the combined debt-GDP ratio of the Central and State Governments is budgeted to decline from 77.0 per cent at end-March 2007 to 74.2 per cent by end-March 2008 (Table 15).
Market borrowings would finance 54.4 per cent of the combined GFD during 2007-08, followed by small savings (23.3 per cent) (Table 16).
Table 15: Key Fiscal Indicators |
(Per cent to GDP) |
Year |
Primary
Deficit |
Revenue
Deficit |
Gross Fiscal
Deficit |
Outstanding
Liabilities * |
1 |
2 |
3 |
4 |
5 |
Centre |
2002-03 |
1.1 |
4.4 |
5.9 |
63.4 |
2003-04 |
-0.03 |
3.6 |
4.5 |
62.8 |
2004-05 |
-0.04 |
2.5 |
4.0 |
63.8 |
2005-06 |
0.4 |
2.6 |
4.1 |
63.4 |
2006-07 RE |
0.1 |
2.0 |
3.7 |
61.5 |
|
(-0.2) |
(1.9) |
(3.5) |
|
2007-08 BE |
-0.2 |
1.5 |
3.3 |
59.2 |
States |
2002-03 |
1.3 |
2.2 |
4.2 |
32.5 |
2003-04 |
1.5 |
2.2 |
4.5 |
33.4 |
2004-05 |
0.7 |
1.2 |
3.5 |
33.3 |
2005-06 |
0.1 |
0.04 |
2.4 |
32.5 |
2006-07 RE |
0.4 |
-0.01 |
2.6 |
30.3 |
2007-08 BE |
-0.02 |
-0.4 |
2.1 |
29.2 |
Combined |
2002-03 |
3.1 |
6.6 |
9.6 |
80.7 |
2003-04 |
2.1 |
5.8 |
8.5 |
81.4 |
2004-05 |
1.4 |
3.7 |
7.5 |
82.4 |
2005-06 |
1.0 |
2.6 |
6.6 |
80.5 |
2006-07 RE |
0.7 |
2.0 |
6.2 |
77.0 |
2007-08 BE |
0.0 |
1.2 |
5.3 |
74.2 |
RE : Revised Estimates.
BE : Budget Estimates.
* : Include external liabilities at historical exchange rates.
Note :
1. Figures in parentheses relate to provisional accounts.
2. Negative sign indicates surplus.
3. Data in respect of States are provisional from 2005-06 onwards and relate to 27
States (including National Capital Territory of Delhi), of which two are vote-on accounts.
|
Table 16: Financing Pattern of Combined Gross Fiscal Deficit of the |
Centre and States |
(Rupees crore) |
Year |
Market |
State |
Small |
External |
Others |
Gross |
|
Borrowings |
Provident |
Savings |
Assistance |
|
Fiscal |
|
|
Funds |
|
|
|
Deficit |
1 |
2 |
3 |
4 |
5 |
6 |
7 |
2003-04 |
1,36,156 |
12,014 |
67,642 |
-13,488 |
32,177 |
2,34,501 |
|
(58.1) |
(5.1) |
(28.8) |
(-5.8) |
(13.7) |
|
2004-05 |
85,498 |
13,139 |
87,690 |
14,753 |
33,641 |
2,34,721 |
|
(36.4) |
(5.6) |
(37.4) |
(6.3) |
(14.3) |
|
2005-06 |
1,20,164 |
14,687 |
89,836 |
7,472 |
2,630 |
2,34,789 |
|
(51.2) |
(6.3) |
(38.3) |
(3.2) |
(1.1) |
|
2006-07 RE |
1,28,245 |
14,437 |
61,600 |
7,892 |
44,887 |
2,57,061 |
|
(49.9) |
(5.6) |
(24.0) |
(3.1) |
(17.5) |
|
2007-08 BE |
1,34,544 |
15,583 |
57,500 |
9,111 |
30,459 |
2,47,197 |
|
(54.4) |
(6.3) |
(23.3) |
(3.7) |
(12.3) |
|
BE : Budget Estimates. RE : Revised Estimates.
Note :
Figures in parentheses are percentages of GFD. |
Centre’s Fiscal Situation: 2007-08
The budgeted revenue deficit and the GFD of the Centre at 1.5 per cent and 3.3 per cent of GDP, respectively, during 2007-08 would be 0.5 percentage point and 0.4 percentage point lower than those in the revised estimates for 2006-07. Available information on Central Government finances for April-May 2007 indicates that all the key deficit indicators were lower than a year ago in absolute terms (Chart 5). GFD was also lower than in April-May 2006 in terms of percentage of budget estimates.
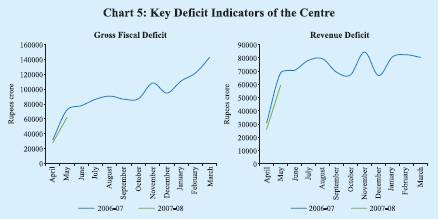
The improvement in the Central Government finances during April-May 2007 was brought about by higher tax revenues, higher non-debt capital receipts and lower plan expenditure. All major tax revenues were higher than a year ago; revenue from corporation tax increased by more than three times that of the corresponding period of the previous year. Aggregate expenditure during April-May 2007 declined over April-May 2006 on account of a decline in plan revenue expenditure (Table 17). Financing of the Union Budget
The fiscal deficit during 2007-08 would continue to be financed largely by market borrowings. According to budget estimates, net market borrowings would finance 73.4 per cent of GFD in 2007-08 as against 72.5 per cent in 2006-07 RE. The net market borrowings do not include the increase of Rs.10,000 crore budgeted under the Market Stabilisation Scheme (MSS). Receipts under the MSS remain in the cash balance of the Government and are not available for financing GFD.
Net market borrowings through dated securities and 364-day Treasury Bills (excluding allocations under MSS) for 2007-08 are placed at Rs.1,09,579 crore. Including repayments of Rs.79,249 crore, gross market borrowings are estimated at Rs.1,88,828 crore. The issuance calendar for dated securities, fixed at Rs.92,000 crore for the first half of 2007-08 (Rs.89,000 crore during the corresponding period of 2006-07), was released on March 30, 2007, in consultation with the Central Government. During 2007-08 (up to July 26, 2007), the actual issuances of dated
Table 17: Central Government Finances: April-May 2007 |
(Rupees crore) |
|
Item |
2007-08
(Budget Estimates) |
April-May |
Per cent of Budget
Estimates April-May |
|
|
|
2006 |
2007 |
2006 |
2007 |
|
1 |
2 |
3 |
4 |
5 |
6 |
1. |
Revenue Receipts (i + ii) |
4,86,422 |
19,330 |
25,899 |
4.8 |
5.3 |
|
i) Tax Revenue |
4,03,872 |
15,087 |
21,725 |
4.6 |
5.4 |
|
ii) Non-tax Revenue |
82,550 |
4,243 |
4,174 |
5.6 |
5.1 |
2. |
Non-Debt Capital Receipts |
43,151* |
500 |
2,716 |
4.2 |
6.3 |
3. |
Non-Plan Expenditure |
4,75,421* |
62,882 |
67,615 |
16.1 |
14.2 |
|
of which: |
|
|
|
|
|
|
i) Interest Payments |
1,58,995 |
23,919 |
26,221 |
17.1 |
16.5 |
|
ii) Defence |
96,000 |
6,314 |
6,770 |
7.1 |
7.0 |
|
iii) Subsidies |
51,247 |
11,412 |
15,508 |
25.5 |
30.3 |
4. |
Plan Expenditure |
2,05,100 |
29,036 |
23,135 |
16.8 |
11.3 |
5. |
Revenue Expenditure |
5,57,900 |
87,950 |
85,234 |
18.0 |
15.3 |
6. |
Capital Expenditure |
1,22,621* |
3,968 |
5,516 |
5.2 |
4.5 |
7. |
Total Expenditure |
6,80,521* |
91,918 |
90,750 |
16.3 |
13.3 |
8. |
Revenue Deficit |
71,478 |
68,620 |
59,335 |
81.0 |
83.0 |
9. |
Gross Fiscal Deficit |
1,50,948 |
72,088 |
62,135 |
48.5 |
41.2 |
10. |
Gross Primary Deficit |
-8,047 |
48,169 |
35,914 |
543.5 |
-446.3 |
* : Includes an amount of Rs.40,000 crore on account of transactions relating to transfer of RBI’s
stake in SBI to the Government.
Source : Controller General Of Accounts, Ministry of Finance. |
securities amounted to Rs.73,000 crore as against Rs.68,000 crore scheduled in the calendar. All auctions were in accordance with the indicative issuance calendar except the one held on June 12, 2007 for Rs.5,000 crore. All auctions were reissuances of existing securities, barring one new issue (10-year security) for Rs.6,000 crore on July 6, 2007 (Table 18). There was no devolvement on the primary dealers. Gross and net market borrowings (dated securities and 364-day Treasury Bills) during 2007-08 (up to July 26, 2007) amounted to Rs.85,628 crore and Rs.46,047 crore, respectively, accounting for 45.3 per cent and 42.0 per cent of the estimated borrowings for the year. During the corresponding period of the previous year, the gross and net borrowings accounted for 39.5 per cent and 31.3 per cent, respectively, of the actual borrowings for 2006-07. The weighted average maturity of dated securities issued during 2007-08 (up to July 26, 2007) at 14.10 years was lower than that of 14.88 years during the corresponding period of the previous year. The weighted average yield of dated securities issued during the same period increased to 8.25 per cent from 7.86 per cent.
Table 18: Central Government Securities Issued during 2007-08 |
(Amount in Rupees crore/Maturity in years/Yield in per cent) |
|
Borrowings as per Issuance
Auction Calendar |
Actual Borrowings |
Sr.
No. |
Period of
Auction |
Amount |
Residual
Maturity |
Date of
Auction |
Amount |
Residual
Maturity |
Yield |
1 |
2 |
3 |
4 |
5 |
6 |
7 |
8 |
1. |
April 5-12, 2007 |
6,000 |
5-9 |
April 12, 2007 |
6,000 |
8.39 |
8.16 |
|
|
4,000 |
20 and above |
April 12, 2007 |
4,000 |
29.15 |
8.58 |
2. |
April 20-27, 2007 |
6,000 |
10-14 |
April 27, 2007 |
6,000 |
9.71 |
8.16 |
3. |
May 4-11, 2007 |
6,000 |
10-14 |
May 11, 2007 |
6,000 |
9.92 |
8.31 |
|
|
4,000 |
20 and above |
May 11, 2007 |
4,000 |
29.06 |
8.64 |
4. |
May 18-25, 2007 |
5,000 |
5-9 |
May 25, 2007 |
5,000 |
8.26 |
8.24 |
|
|
3,000 |
15-19 |
May 25, 2007 |
3,000 |
14.96 |
8.40 |
6. |
June 1-8, 2007 |
6,000 |
10-14 |
June 5, 2007 |
6,000 |
9.86 |
8.18 |
|
|
3,000 |
20 and above |
June 5, 2007 |
3,000 |
29.00 |
8.52 |
|
|
|
|
June 12, 2007* |
5,000 |
9.84 |
8.44 |
7. |
June 15-22, 2007 |
6,000 |
10-14 |
June 15, 2007 |
6,000 |
9.83 |
8.35 |
8. |
July 6-13, 2007 |
6,000 |
10-14 |
July 6, 2007 |
6,000 |
10.00 |
7.99 |
|
|
4,000 |
20 and above |
|
4,000 |
28.93 |
8.45 |
9. |
July 20-27, 2007 |
6,000 |
5-9 |
July 20, 2007 |
6,000 |
6.11 |
7.56 |
|
|
3,000 |
20 and above |
|
3,000 |
25.10 |
8.34 |
Memo: |
Year |
|
|
Weighted Average Maturity |
Weighted Average Yield |
|
|
|
|
|
|
|
|
2003-04 |
|
|
|
14.94 |
|
|
5.71 |
2004-05 |
|
|
|
14.13 |
|
|
6.11 |
2005-06 |
|
|
|
16.90 |
|
|
7.34 |
2006-07 |
|
|
|
14.72 |
|
|
7.89 |
2006-07 (up to July 26, 2006) |
|
14.88 |
|
|
7.86 |
2007-08 (up to July 26, 2007) |
|
14.10 |
|
|
8.25 |
* : Not scheduled.
Source : Reserve Bank of India. |
In consultation with the Central Government, the limits for Ways and Means Advances (WMA) for 2007-08 were fixed on a half-yearly basis as against on quarterly basis a year ago. The WMA limits were placed at Rs.20,000 crore for the first half of 2007-08 (April to September) as against separate limits of Rs.20,000 crore and Rs.10,000 crore for the first and second quarters in the preceding year; the limits for the second half (October to March) would be Rs.6,000 crore, the same as that for the third and fourth quarters a year ago. The Reserve Bank retains the flexibility to revise the limits at any time, in consultation with the Government of India, taking into consideration the transitional issues and prevailing circumstances. The interest rate on WMA and on overdraft, as in the preceding year, would be the repo rate and two percentage points above the repo rate, respectively.
The Central Government recorded a surplus cash balance of Rs.50,092 crore at end-March 2007. Reflecting the usual seasonal pattern, the cash balances dwindled rapidly during April 2007, necessitating recourse to WMA on April 27, 2007. The cash position of the Centre was again under pressure towards the end-June on account of the acquisition of the SBI stake by the Government from the Reserve Bank. During 2007-08 (up to July 20, 2007), the Centre took recourse to WMA for 72 days as compared with 33 days during the same period in 2006-07. During 2007-08 (up to July 20, 2007), the Centre resorted to overdrafts on three occasions; during the previous year, the Centre had not resorted to overdrafts.
State Finances: 2007-081
The State Governments in their budgets for 2007-08 proposed various policy initiatives to carry forward the process of fiscal correction and consolidation through measures aimed at augmenting revenue and improving expenditure management. Some State Governments proposed to undertake a comprehensive review of the functioning of the State PSUs and their restructuring. In order to restore financial viability of electricity boards, some States have signed Memorandum of Understanding (MoU) with the Central Government. All States, barring Uttar Pradesh, have implemented Value Added Tax (VAT) in lieu of sales tax as on April 1, 2007. In view of the priority given to infrastructure development in the Eleventh Five Year Plan, the State Governments envisage implementation of various projects, especially power and roads, through the framework of public-private partnership (PPP). Fiscal Responsibility Legislations (FRLs) have been enacted by 25 State Governments (as of end-March 2007).
Reflecting the efforts towards fiscal consolidation, the State Governments have budgeted for a revenue surplus of 0.4 per cent of GDP in 2007-08, as compared with the near balance in the revenue account in the previous year. Consequently, gross fiscal deficit, as a ratio to GDP, is budgeted to decline to 2.1 per cent in 2007-08 from 2.6 per cent a year ago (see Table 15). The fiscal correction in 2007-08 is proposed to be brought about mainly by containing the growth in revenue expenditure; as a result, the revenue expenditure-GDP ratio is budgeted to decline from 12.5 per cent in 2006-07 to 12.2 per cent in 2007-08. Revenue receipts relative to GDP are budgeted to be maintained at 12.5 per cent in 2007-08; the major components of the revenues, viz., State’s own revenues (taxes and non-taxes) and current devolution and transfers would be unchanged at 7.4 per cent and 5.1 per cent of GDP, respectively, during 2007-08.
Financing of the States’ Budgets
The provisional net allocation under market borrowing programme for the State Governments during 2007-08 is placed at Rs.21,434 crore (excluding four State Governments for which the Annual Plans are yet to be finalised). Taking into account the repayments of Rs.11,554 crore and additional allocation of Rs.335 crore, the gross allocation amounts to Rs.33,323 crore for 2007-08 as compared with actual borrowings of Rs.20,825 crore for 2006-07. During 2007-08 (up to July 26, 2007), fourteen States raised market loans amounting to Rs.8,542 crore (25.6 per cent of gross allocation) through auctions at cut-off rates in the range 8.00-8.57 per cent as compared with Rs.7,343 crore at cut-off yields in the range of 7.65-8.66 per cent during the corresponding period of the previous year. All the issues during 2007-08 so far have been of 10-year maturity, as in the previous year. The weighted average interest rate of market loans hardened to 8.35 per cent during 2007-08 (up to July 26, 2007) from 8.08 per cent a year ago (Table 19). The spreads over the corresponding yields of Central Government securities were 11 to 36 basis points.
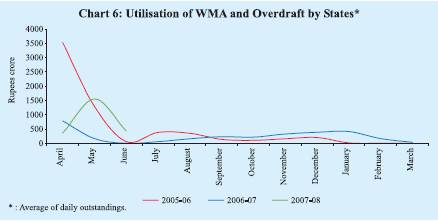
The average daily utilisation of WMA and overdraft by the States was Rs.694 crore during 2007-08 (up to July 20, 2007) as compared with Rs.258 crore in the corresponding period of the previous year (Chart 6). Three States resorted to overdrafts during 2007-08 (up to July 20, 2007) as compared with two States during the corresponding period of the previous year.
Table 19: Market Borrowings of State Governments during 2007-08 |
Item |
|
Date |
Cut-off Rate |
Tenor |
Amount Raised |
|
|
|
(Per cent) |
(Years) |
(Rupees crore) |
1 |
|
2 |
3 |
4 |
5 |
Auctions |
|
|
|
|
i. |
First |
April 19, 2007 |
8.30 |
10 |
1,837 |
ii. |
Second |
May 10, 2007 |
8.34 |
10 |
350 |
iii. |
Third |
May 17, 2007 |
8.40 |
10 |
1,400 |
iv. |
Fourth |
June 19, 2007 |
8.45-8.57 |
10 |
3,566 |
v. |
Fifth |
July 26, 2007 |
8.00-8.25 |
10 |
1,389 |
Grand Total |
|
|
|
8,542 |
Memo: |
Year |
|
|
Weighted Average Yield
(per cent) |
2003-04 |
|
|
|
6.13 |
2004-05 |
|
|
|
6.45 |
2005-06 |
|
|
|
7.63 |
2006-07 |
|
|
|
8.10 |
2006-07
(up to July 26, 2006) |
|
|
|
8.08 |
2007-08
(up to July 26, 2007) |
|
|
|
8.35 |
Source : Reserve Bank of India. |
 The cash surplus position of the States, as reflected in their investments in Treasury Bills (14-day intermediate Treasury Bills and Auction Treasury Bills) was Rs.75,321 crore on July 20, 2007 as compared with Rs.76,930 crore at end-June 2007 and Rs.80,768 crore at end-March 2007. The average investment by the States in Treasury Bills during April-June 2007 amounted to Rs.68,800 crore as against Rs.52,876 crore in the corresponding period of the previous year (Chart 7). 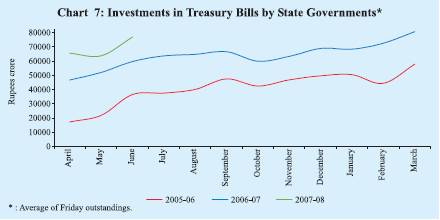
1 Based on information pertaining to 27 State Budgets (including NCT Delhi), of which two are Vote-on-Accounts.
|


