|
Combined Government Finances: 2007-08
An overview of the combined finances of the Central and State Governments budgeted for 2007-08 indicates the continuance of the fiscal consolidation process. The key deficit indicators are budgeted to decline over the revised estimates for 2006-07, both in absolute terms and as percentage of GDP. The improvement in combined finances during 2007-08 would primarily reflect the strengthening of the State Governments' finances, the revenue account of which is envisaged to record a surplus. Even though the non-tax revenue would remain sluggish, buoyant tax revenue is expected to raise the revenue receipts (by 0.4 percent of GDP) in 2007-08, while revenue expenditure would be curtailed (by 0.5 per cent of GDP). Consequently, the combined revenue deficit in 2007-08 is budgeted to decline by 0.9 per cent of GDP. The envisaged improvement in the revenue account is expected to bring down the combined gross fiscal deficit (GFD) by 0.8 per cent of GDP in 2007-08 (Table 15).
Table 15: Key Fiscal Indicators |
(Per cent to GDP) |
Year |
Primary
Deficit |
Revenue
Deficit |
Gross Fiscal
Deficit |
Outstanding
Liabilities * |
1 |
2 |
3 |
4 |
5 |
Centre |
2002-03 |
1.1 |
4.4 |
5.9 |
63.6 |
2003-04 |
-0.03 |
3.6 |
4.5 |
62.9 |
2004-05 |
-0.04 |
2.5 |
4.0 |
63.9 |
2005-06 |
0.4 |
2.6 |
4.1 |
63.4 |
2006-07 RE |
0.2 |
2.0 |
3.7 |
61.5 |
|
(0.2) |
(1.9) |
(3.5) |
|
2007-08 BE |
-0.2 |
1.5 |
3.3 |
59.2 |
States |
2002-03 |
1.3 |
2.2 |
4.2 |
32.5 |
2003-04 |
1.5 |
2.2 |
4.5 |
33.4 |
2004-05 |
0.7 |
1.2 |
3.5 |
33.3 |
2005-06 |
0.1 |
0.08 |
2.5 |
32.6 |
2006-07 RE |
0.4 |
0.03 |
2.8 |
30.5 |
2007-08 BE |
0.1 |
-0.4 |
2.4 |
29.6 |
Combined |
2002-03 |
3.1 |
6.6 |
9.6 |
81.0 |
2003-04 |
2.1 |
5.8 |
8.5 |
81.6 |
2004-05 |
1.4 |
3.7 |
7.5 |
82.5 |
2005-06 |
0.9 |
2.7 |
6.7 |
80.5 |
2006-07 RE |
0.8 |
2.1 |
6.4 |
77.0 |
2007-08 BE |
0.1 |
1.2 |
5.6 |
74.2 |
RE : Revised Estimates.
BE : Budget Estimates.
* : Includes external liabilities at historical exchange rates.
Note :
1. Figures in parentheses relate to provisional accounts.
2. Negative sign indicates surplus.
3. Data in respect of States are provisional from 2005-06 onwards and relate to 29 States
(including National Capital Territory of Delhi). |
Centre’s Fiscal Situation: 2007-08
Available information on Central Government finances for 2007-08 (April-August) indicates that GFD (as proportion of the budget estimates) was placed higher than a year ago. The revenue deficit was, however, placed lower than April-August 2006 mainly on account of profit transfer from the Reserve Bank on sale of its stake in the State Bank of India (SBI). Adjusting for this transaction, revenue deficit (as proportion to budget estimates) was higher than a year ago. Tax revenue remained buoyant, rising by 22.0 per cent over April-August 2006. Non-tax revenue (net of profit on sale of Reserve Bank's stake in SBI) registered a growth of 21.2 per cent during the same period. During the first five months of 2007-08, revenue receipts (net of profit on sale of Reserve Bank's stake in SBI), however, accounted for only 26.7 per cent of the budget estimates, while the corresponding proportion for revenue expenditure was higher at 39.0 per cent. Consequently, during April-August 2007, revenue deficit (adjusted for profit on sale of Reserve Bank's stake in SBI) was 122.9 per cent of the full year budget estimates. Aggregate expenditure (adjusted for acquisition cost of Reserve Bank's stake in SBI) increased mainly on account of a sharp increase in revenue expenditure and plan capital expenditure. Plan capital expenditure increased mainly under economic services and loans and advances. Under non-plan expenditure, interest payments and subsidies were significantly higher than a year ago. GFD during the same period was 68.5 per cent of the budget estimates as against 61.0 per cent in April-August 2007(Chart 5). As against a primary
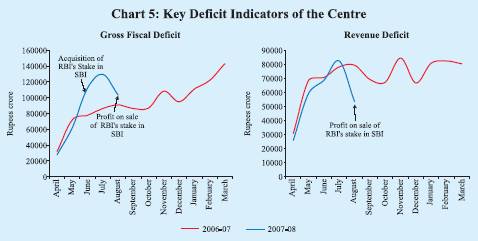
surplus of Rs.8,047 crore budgeted for 2007-08, the Centre recorded a gross primary deficit during the first five months of the year (Table 16).
Cash Management and Central Government Market Borrowings
During 2007-08 (up to October 22, 2007), the actual issuances of dated securities amounted to Rs.1,07,000 crore as against Rs.1,02,000 crore scheduled in the calendar for the same period. With the exception of one auction held on June 12, 2007 for Rs.5,000 crore, all auctions were in accordance with the indicative issuance calendar. All auctions were reissuances of existing securities, barring one new issue (10-year security) for Rs.6,000 crore on July 6, 2007.
Table 16 : Central Government Finances during April-August 2007 |
(Rupees crore) |
Item |
2007-08
(Budget Estimates) |
April-August |
Per cent of Budget Estimates April-August |
|
|
2006 |
2007 |
2006 |
2007 |
1 |
2 |
3 |
4 |
5 |
6 |
1. |
Revenue Receipts (i + ii) |
4,86,422 |
1,06,551 |
1,64,083 |
26.4 |
33.7 |
|
|
|
(1,29,775) |
|
(26.7) |
|
i) Tax Revenue |
4,03,872 |
81,444 |
99,356 |
24.9 |
24.6 |
|
ii) Non-tax Revenue |
82,550 |
25,107 |
64,727 |
32.9 |
78.4 |
|
|
|
(30,419) |
|
(36.8) |
2. |
Non-Debt Capital Receipts |
43,151 |
3,207 |
3,946 |
27.1 |
9.1 |
|
(3,151) |
|
|
|
(125.2) |
3. |
Non-Plan Expenditure |
4,75,421 |
1,46,516 |
1,99,042 |
37.4 |
41.9 |
|
(4,35,421) |
|
(1,63,511) |
|
(37.6) |
|
of which: |
|
|
|
|
|
|
i) |
Interest Payments |
1,58,995 |
51,089 |
63,039 |
36.5 |
39.6 |
|
ii) Defence |
96,000 |
22,420 |
23,379 |
25.2 |
24.4 |
|
iii) Subsidies |
51,247 |
23,784 |
30,034 |
53.1 |
58.6 |
|
iv) Grants to States |
38,403 |
15,029 |
14,643 |
42.5 |
38.1 |
4. |
Plan Expenditure |
2,05,100 |
53,920 |
72,325 |
31.2 |
35.3 |
5. |
Revenue Expenditure |
5,57,900 |
1,85,949 |
2,17,598 |
38.1 |
39.0 |
6. |
Capital Expenditure |
1,22,621 |
14,487 |
53,769 |
19.1 |
43.8 |
|
(82,621) |
|
(18,238) |
|
(22.1) |
7. |
Total Expenditure |
6,80,521 |
2,00,436 |
2,71,367 |
35.5 |
39.9 |
|
(6,40,521) |
|
(2,35,836) |
|
(36.8) |
8. |
Revenue Deficit |
71,478 |
79,398 |
53,515 |
93.7 |
74.9 |
|
|
|
(87,823) |
|
(122.9) |
9. |
Gross Fiscal Deficit |
1,50,948 |
90,678 |
1,03,338 |
61.0 |
68.5 |
|
|
|
(1,02,115) |
|
(67.6) |
10. |
Gross Primary Deficit |
-8,047 |
39,589 |
40,299 |
– |
– |
|
|
|
(39,076) |
|
|
Note :
Figures in parentheses are adjusted for transactions relating to transfer of the Reserve Bank's stake in SBI
to the Government. Accordingly, an amount of Rs.40,000 crore was adjusted in non-debt capital receipts as well as in non-plan expenditure, capital expenditure and total expenditure in the budget estimates for 2007-08. During April August 2007, an amount of Rs.34,308 crore, which represents transfer of profits on sale of Reserve Bank's stake in SBI in August 2007, was adjusted in non-tax revenue as well as in revenue receipts; an amount of Rs.35,531 crore which represents the actual acquisition cost of Reserve Bank's stake in SBI (including the book value of shares at Rs.1,223 crore) in June 2007 was adjusted in non-plan expenditure, capital expenditure and total expenditure.
Source : Controller General of Accounts, Ministry of Finance. |
There was no devolvement on the primary dealers. Gross and net market borrowings (including 364-day Treasury Bills) during 2007-08 (up to October, 22, 2007) amounted to Rs.1,26,036 crore and Rs.75,363 crore, respectively, accounting for 66.7 per cent and 68.7 per cent of the estimated borrowings for the year. The weighted average maturity of dated securities issued during 2007-08 (up to October 22, 2007) at 14.41 years was higher than that of 14.08 years during the corresponding period of the previous year. The weighted average yield of dated securities issued during the same period increased to 8.20 per cent from 7.91 per cent (Table 17).
Table 17: Central Government Securities Issued during 2007-08 |
(Amount in Rupees crore/Maturity in years/Yield in per cent) |
|
Borrowings as per Issuance Auction Calendar |
|
Actual Borrowings |
|
Sr. No. |
Period of
Auction |
Amount |
Residual
Maturity |
Date of
Auction |
Amount |
Residual
Maturity |
Yield |
1 |
2 |
3 |
4 |
5 |
6 |
7 |
8 |
1. |
April 5-12, 2007 |
6,000 |
5-9 |
April 12, 2007 |
6,000 |
8.39 |
8.16 |
|
4,000 |
20 and above |
April 12, 2007 |
4,000 |
29.15 |
8.58 |
2. |
April 20-27, 2007 |
6,000 |
10-14 |
April 27, 2007 |
6,000 |
9.71 |
8.16 |
3. |
May 4-11, 2007 |
6,000 |
10-14 |
May 11, 2007 |
6,000 |
9.92 |
8.31 |
|
4,000 |
20 and above |
May 11, 2007 |
4,000 |
29.06 |
8.64 |
4. |
May 18-25, 2007 |
5,000 |
5-9 |
May 25, 2007 |
5,000 |
8.26 |
8.24 |
|
3,000 |
15-19 |
May 25, 2007 |
3,000 |
14.96 |
8.40 |
5. |
June 1-8, 2007 |
6,000 |
10-14 |
June 5, 2007 |
6,000 |
9.86 |
8.18 |
|
|
3,000 |
20 and above |
June 5, 2007 |
3,000 |
29.00 |
8.52 |
|
|
|
June 12, 2007* |
5,000 |
9.84 |
8.44 |
6. |
June 15-22, 2007 |
6,000 |
10-14 |
June 15, 2007 |
6,000 |
9.83 |
8.35 |
7. |
July 6-13, 2007 |
6,000 |
10-14 |
July 6, 2007 |
6,000 |
10.00 |
7.99 |
|
4,000 |
20 and above |
July 7, 2007 |
4,000 |
28.93 |
8.45 |
8. |
July 20-27, 2007 |
6,000 |
5-9 |
July 20, 2007 |
6,000 |
6.10 |
7.59 |
|
3,000 |
20 and above |
July 20, 2007 |
3,000 |
25.10 |
8.34 |
9. |
August 3-10, 2007 |
6,000 |
10-14 |
August 3, 2007 |
6,000 |
9.93 |
7.93 |
|
4,000 |
20 and above |
August 3, 2007 |
4,000 |
25.06 |
8.45 |
10. |
August 17-24, 2007 |
5,000 |
5-9 |
August 24, 2007 |
5,000 |
6.02 |
7.87 |
|
2,000 |
10-14 |
August 24, 2007 |
2,000 |
9.89 |
7.91 |
11. |
September 7-14, 2007 |
4,000 |
10-14 |
September 7, 2007 |
4,000 |
14.43 |
8.16 |
|
3,000 |
20 and above |
September 7, 2007 |
3,000 |
28.74 |
8.41 |
12. |
October 5-12, 2007 |
6,000 |
10-14 |
October 12, 2007 |
6,000 |
9.73 |
7.91 |
|
4,000 |
20 and above |
October 12, 2007 |
4,000 |
25.20 |
8.45 |
Memo: |
Year |
Weighted Average
Maturity |
Weighted Average
Yield |
2003-04 |
14.94 |
5.71 |
2004-05 |
14.13 |
6.11 |
2005-06 |
16.90 |
7.34 |
2006-07 |
14.72 |
7.89 |
2006-07 (up to October 22, 2006) |
14.08 |
7.91 |
2007-08 (up to October 22, 2007) |
14.41 |
8.20 |
* : Not scheduled. |
The Central Government’s surplus cash balance of Rs.50,092 crore as at end-March 2007 was eroded rapidly and had turned into a deficit by April 27, 2007, reflecting sharp reduction in investments in Treasury Bills by the States, higher than anticipated spending and lower collections under the National Small Saving Fund (NSSF). The cash balance of the Government remained in deficit till June 17, 2007 except for a brief period of two days on May 17 and 18, 2007. On May 30, 2007, the cash deficit crossed the Ways and Means Advance (WMA) limit of Rs.20,000 crore for the first half and remained in an overdraft position till June 8, 2007. Additional issuance of 91-day and 182-day Treasury Bills amounting to Rs.27,500 crore (on six occasions), during June 6-27, 2007, auction of dated securities amounting to Rs.5,000 crore on June 12, 2007 outside the calendar, advance tax inflows for the April-June quarter and resumption of investment by States in Treasury Bills resulted in a build up of surplus position in Government balances from June 18, 2007, ahead of acquisition of the Reserve Bank’s stake in SBI by the Government. With this acquisition, which involved a cash outgo of Rs.35,531 crore on June 29, 2007, the cash balance of the Government again turned into deficit of Rs.15,159 crore. The Centre’s cash balances remained in deficit till August 8, 2007. Following the transfer of surplus from the Reserve Bank on August 9, 2007, the Centre’s cash balance returned to a surplus mode and remained so thereafter. Reflecting advance tax flows, the cash balances exhibited the usual volatility in September 2007. As on October 19, 2007, the surplus cash balance was placed at Rs.22,021 crore. During 2007-08 (up to October 19, 2007), the Centre took recourse to WMA for 91 days as compared with 39 days during the same period in 2006-07. The Central Government resorted to overdraft on three occasions during 2007-08 (up to October 19, 2007); during the corresponding period of the previous year, the Centre did not resort to any overdraft. The average utilisation of WMA/OD during 2007-08 (up to end-September, 2007) was Rs.8,510 crore as compared with Rs.801 crore in the corresponding period of the previous year.
State Finances
State Governments in their budgets for 2007-08 have committed to improve their fiscal position in line with their Fiscal Responsibility Legislations. Notwithstanding some variations across the States, the consolidated revenue balance is budgeted to show a noticeable improvement in 2007-08, with a surplus of 0.4 per cent of GDP as compared to a deficit of 0.03 per cent of GDP in 2006-07 (RE). As a result, the GFD is estimated to decline to 2.4 per cent of GDP in 2007-08 (BE) from 2.8 per cent of GDP during 2006-07(RE). The consolidated primary deficit is budgeted at 0.1 per cent of GDP in 2007-08.
Cash Management and State Governments’ Market Borrowings
The provisional net allocation under market borrowing programme for State Governments is placed at Rs.23,503 crore during 2007-08, excluding two State Governments for which the Annual Plans are yet to be finalised. Taking into account the repayments of Rs.11,555 crore and additional allocation of Rs.5,625 crore, the gross allocation amounts to Rs.40,682 crore. During 2007-08 (up to October 22, 2007), the States have raised market loans amounting to Rs.20,362 crore (50.1 per cent of gross allocation) through auctions as compared with Rs.8,596 crore (41.3 per cent) during the corresponding period of the previous year. The cut-off yield ranged between 8.00-8.90 per cent. The weighted average interest rate on market loans firmed up to 8.33 per cent during 2007-08 (up to October 22, 2007) from 8.08 per cent in the corresponding period of the previous year (Table 18).
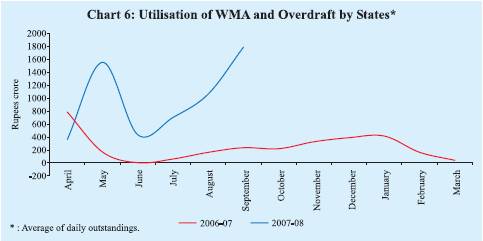
The average daily utilisation of WMA and overdraft by the States during 2007-08 (up to end-September 2007) at Rs.984 crore was higher than that of Rs.236 crore during the corresponding period of 2006-07 (Chart 6). Three States resorted to overdraft during 2007-08 (up to end-September 2007) as compared with one State during the corresponding period of the previous year. The WMA position as on October 19, 2007 was at Rs.19 crore.
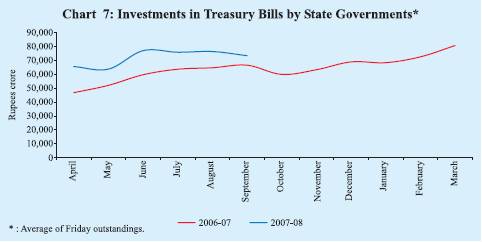
The cash surplus position of the States, as reflected in their investments in Treasury Bills (14-day and auction Treasury Bills), remained sizeable, although it declined from Rs.73,403 crore at end-March 2007 to
Table 18: Market Borrowings of State Governments during 2007-08 |
Item |
Date |
Cut-off Rate |
Tenor |
Amount Raised |
|
|
|
(Per cent) |
(Years) |
(Rupees crore) |
1 |
|
2 |
3 |
4 |
5 |
Auctions |
|
|
|
|
i. |
First |
April 19, 2007 |
8.30 |
10 |
1,837 |
ii. |
Second |
May 10, 2007 |
8.34 |
10 |
350 |
iii. |
Third |
May 17, 2007 |
8.40 |
10 |
1,400 |
iv. |
Fourth |
June 19, 2007 |
8.45-8.57 |
10 |
3,566 |
v. |
Fifth |
July 26, 2007 |
8.00-8.25 |
10 |
1,389 |
vi. |
Sixth |
August 16, 2007 |
8.30-8.90 |
10 |
3,485 |
vii. |
Seventh |
September 20, 2007 |
8.14-8.50 |
10 |
3,074 |
viii. |
Eighth |
October 4, 2007 |
8.20 |
10 |
590 |
xi. |
Ninth |
October 8, 2007 |
8.31-8.40 |
10 |
4,672 |
Grand Total |
|
|
|
20,363 |
Memo: |
Year |
|
|
Weighted Average Yield
(per cent) |
2003-04 |
|
|
6.13 |
2004-05 |
|
|
6.45 |
2005-06 |
|
|
7.63 |
2006-07 |
|
|
8.10 |
2006-07(up to October 22, 2006) |
|
|
8.08 |
2007-08(up to October 22, 2007) |
|
|
8.33 |
Source : Reserve Bank of India. |
Rs.64,578 crore on October 19, 2007. The average investment by the States in Treasury Bills during April-September 2007 amounted to Rs.73,483 crore as against Rs.58,921 crore in the corresponding period of the previous year (Chart 7).
1 In contrast to budget announcement of including the surplus transfer on account of transfer of Reserve Bank’s stake in SBI to the Central Government under ‘other capital receipts’, the Controller General of Accounts (CGA) in its release of September 28, 2007 on summary information for the Central Government’s Accounts for April-August 2007 has recorded this transaction under non-tax revenue receipts.
|
 IST,
IST,


