III. Monetary and Liquidity Conditions - RBI - Reserve Bank of India
III. Monetary and Liquidity Conditions
Monetary Trends
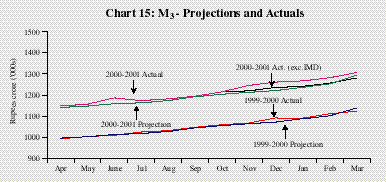
Broad money (M3) increased by 16.2 per cent during 2000-01 as compared with 14.6 per cent during 1999-2000. The (net of IMDs), however, registered a growth rate of 13.9 per cent which was well within the 15.0 per cent projection announced in the April 2000 monetary and credit policy statement (Table 7 and Chart 15). On a monthly average basis, the (net of RIBs/IMDs) growth rateM3 decelerated to 14.7 per cent during 2000-01 from 16.7 per cent during 1999-2000 and 18.2 per cent during 1998-99. Currency with the public increased by 10.8 per cent during 2000-01 as compared with 11.7 per cent during the previous year. Scheduled commercial banks' aggregate deposits registered a higher growth of 17.8 per cent as compared with 13.9 per cent during 1999-2000, driven largely by IMD inflows. Demand deposits increased by 10.5 per cent as compared with 8.5 per cent during the previous year. Time deposit growth, at 15.4 per cent, net of IMDs, was comparable with 15.0 per cent in 1999-2000.
(Per cent) |
|||||||||||||||||||
|
|
|||||||||||||||||||
Point-to-point basis |
Monthly Average basis |
||||||||||||||||||
|
|
|||||||||||||||||||
Variable |
1999- |
2000- |
Average |
1999- |
2000- |
Average |
|||||||||||||
2000 |
2001 |
during |
2000 |
2001 |
during |
||||||||||||||
1990s |
1990s |
||||||||||||||||||
|
|
|||||||||||||||||||
1 |
2 |
3 |
4 |
5 |
6 |
7 |
|||||||||||||
|
|
|||||||||||||||||||
I. |
Reserve Money |
8.1 |
8.3 |
13.9 |
12.0 |
8.1 |
14.4 |
||||||||||||
II. |
Narrow Money (M1) |
10.5 |
10.7 |
15.6 |
14.7 |
11.2 |
15.9 |
||||||||||||
III. |
Broad Money (M3) |
14.6 |
16.2 |
17.3 |
17.2 |
15.4 |
17.4 |
||||||||||||
III.1 M3, net of RIBs |
16.7 |
||||||||||||||||||
III.2 M3, net of IMDs |
13.9 |
14.5 |
|||||||||||||||||
III.3 NM3* |
13.3 |
12.7 |
16.4 |
17.3 |
16.6 |
||||||||||||||
IV. |
Components of Broad Money |
||||||||||||||||||
a) |
Currency with the Public |
11.7 |
10.8 |
15.2 |
16.3 |
9.1 |
15.9 |
||||||||||||
b) |
Aggregate Deposits (i+ii) |
15.3 |
17.2 |
17.8 |
17.3 |
16.8 |
17.8 |
||||||||||||
i) |
Demand Deposits |
9.7 |
9.9 |
16.3 |
13.1 |
14.1 |
15.8 |
||||||||||||
ii) |
Time Deposits |
16.4 |
18.6 |
18.1 |
18.2 |
17.3 |
18.2 |
||||||||||||
V. |
Sources of Broad Money |
||||||||||||||||||
a) |
Net Bank Credit to the |
||||||||||||||||||
Government (i+ii) |
14.1 |
16.2 |
14.2 |
15.1 |
13.7 |
14.6 |
|||||||||||||
i) |
Net Reserve Bank Credit |
||||||||||||||||||
to the Government |
-2.8 |
4.9# |
7.5 |
5.3 |
1.0 |
8.9 |
|||||||||||||
Of which: to Centre |
-3.8 |
6.5# |
7.1 |
4.3 |
0.4 |
8.8 |
|||||||||||||
ii) |
Other Banks' Credit to the |
||||||||||||||||||
Government |
25.2 |
22.0 |
21.2 |
21.7 |
20.0 |
21.1 |
|||||||||||||
b) |
Bank Credit to Commercial |
||||||||||||||||||
Sector |
18.3 |
14.3 |
14.6 |
16.4 |
19.3 |
14.4 |
|||||||||||||
Of which: |
|||||||||||||||||||
Scheduled Commercial Banks' |
|||||||||||||||||||
Non-food Credit |
16.5 |
14.3 |
15.4 |
15.5 |
15.4 |
15.3 |
|||||||||||||
c) |
Net Foreign Exchange Assets |
||||||||||||||||||
of the Banking Sector |
15.6 |
18.8 |
44.7 |
21.1 |
17.6 |
46.4 |
|||||||||||||
|
|
|||||||||||||||||||
Data are provisional. |
* Up to February 9, 2001 and February 11, 2000, respectively. |
# Before closure of Government accounts as on March 31, 2001. |
In pursuance of the recommendations of the Working Group on Money Supply (Chairman: Dr. Y.V. Reddy), it is necessary to adjust the M3 aggregate for India Millennium Deposits (IMDs) so that the monetary impact of such capital flows depends on their net effect on the monetary base (Table 8).
|
|
|||||||||||||||||||
Transaction |
Reserve Bank |
CommercialBanks |
Monetary Impact |
||||||||||||||||
|
|
|||||||||||||||||||
Foreign |
Govt |
Reserve |
Foreign |
Foreign |
Govt. |
Bank |
NM3 |
M3 |
|||||||||||
Assets |
Securities |
Money |
Liabilities |
Assets |
Securities# |
Credit |
|||||||||||||
|
|
|||||||||||||||||||
1 |
2 |
3 |
4 |
5 |
6 |
7 |
8 |
9 |
10 |
||||||||||
|
|
|||||||||||||||||||
Purchase by |
RBI |
||||||||||||||||||
Unsterilised |
|
« |
|
|
« |
« |
|
IMD+ |
|||||||||||
Purchase |
effect |
M 0 |
|||||||||||||||||
effect |
|||||||||||||||||||
Sterilised |
|
¯ |
« |
|
« |
|
« |
« |
IMD |
||||||||||
purchase |
|||||||||||||||||||
Retained by |
banks |
||||||||||||||||||
Invested |
|||||||||||||||||||
abroad |
« |
« |
« |
|
|
« |
« |
« |
IMD |
||||||||||
|
|
|||||||||||||||||||
Note : indicates increase, ¯ decrease and « no change. |
# Excluding Secondary market transactions with the non-bank sector. M0: Reserve money. |
It is necessary to recognise that the comparison of monetary flows between 1999-2000 and 2000-01 is complicated by two factors: i) the dip in the end-March 2000 position, because of the gap between the last reporting Friday of March (March 24) and the balance sheet date muting the impact of the year-end bulge in bank deposits and credit and ii) proceeds under the IMD scheme.
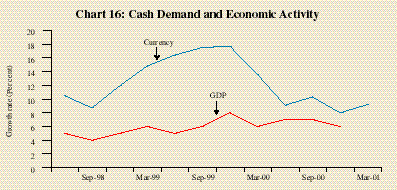
The monthly average year-on-year currency growth rate decelerated to a single digit (9.1 per cent) for the first time since 1975-76 from 16.3 per cent during 1999-2000. A slower cash demand has three implications. First, it reduces the currency to deposit ratio and thereby pumps up the money multiplier so that a relatively small increase in the monetary base could support a larger monetary expansion. Second, to the extent currency drawals are a leakage from the banking system, changes in cash demand, ceteris paribus, impact on bank liquidity. Third, currency essentially depends on the public demand for liquid transaction balances which, in turn, is a function of the level of economic activity, banking habits and the availability of alternate liquid monetary assets (Chart 16).
Credit Trends
Domestic credit (adjusted for scheduled commercial banks' investments in non-SLR securities) decelerated to 15.4 per cent during 2000-01 from 16.9 per cent during 1999-2000. The ratio of incremental (adjusted) non-food credit in incremental (adjusted) domestic credit at 42.4 per cent during 2000-01 was lower than 45.3 per cent during 1999-2000.
Net bank credit to the Government accelerated to 16.2 per cent from 14.1 per cent last year. The share of the Reserve Bank's incremental net credit to the Government in the increase in net bank credit to the Government shot up to 48.5 per cent as on November 3, 2000 with the tightening of liquidity conditions and thereafter fell to an average of 7.6 per cent during the last quarter of 2000-01, once the return of comfortable liquidity conditions revived the market interest in government paper. Scheduled commercial banks' investments in government securities decelerated to 21.8 per cent during 2000-01 from 24.7 per cent during 1999-2000.
Bank credit to the commercial sector moved contrary to the real activity conditions over the greater part of 2000-01. The year-on-year growth rate of scheduled commercial banks non-food credit was markedly high in the first half of the year, running, on average, at nearly 700 basis points above the growth rate in the first half of the previous year. By March 2001, however, the growth rate of non-food credit dipped by over 200 basis points below the corresponding growth rate recorded in March 2000. Scheduled commercial banks non-food credit amounted to only Rs. 11,294 crore in the last quarter of 2000-01, almost half of the off-take of Rs. 20,688 crore in the last quarter of 1999-2000. For the year 2000-01 as a whole, bank credit to the commercial sector decelerated to 14.3 per cent from 18.3 per cent in 1999-2000.
Net foreign assets of the banking sector increased by 18.8 per cent in 2000-01 as against an increase of 15.6 per cent during 1999-2000, bolstered by IMD inflows.
Reserve Money
Reserve money expanded by only 8.3 per cent during 2000-01, as against the long-term average growth rate of 13.9 per cent. In 1999-2000, reserve money growth was even lower at 8.1 per cent, muted by the first round release of resources, as a result of CRR changes, of about Rs.13,000 crore. The net RBI credit to the Centre increased by 6.5 per cent (Rs.9,023 crore) (before closure of accounts) during 2000-01 in sharp contrast to the decline of 3.8 per cent (Rs.5,587 crore) (after closure of accounts) during 1999-2000, mainly on account of the RBI's net subscription to the Centre's fresh dated securities (Rs.29,504 crore at face value) partly offset by net open market sales (Rs.19,218 crore, of which Rs.11,388 crore was to commercial banks). The commercial bank drawals from the Reserve Bank declined by Rs.4,471 crore in contrast to the increase of Rs.3,256 crore during 1999-2000, partly reflecting the reduction in refinance limits. The Reserve Banks credit to commercial sector declined by Rs.1,983 crore in contrast to the increase of Rs.3,044 crore in 1999-2000 essentially on account of the decline in availment of liquidity support by primary dealers. The Reserve Bank's foreign currency assets increased by Rs.27,463 crore (adjusted for revaluation) during 2000-01 as against an increase of Rs.27,382 crore (adjusted for revaluation) during 1999-2000, mainly on account of IMD inflows. The monetary impact of IMDs was, by and large, moderated by several measures impinging on liquidity.
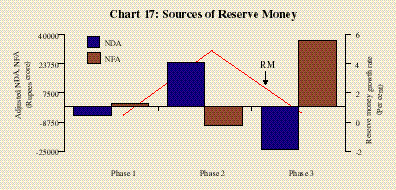
The Reserve Bank modulated the domestic and external sources of monetisation during the year (Chart 17). In the first phase (till April 21, 2000), primary liquidity generated by capital inflows was more than offset by a decline in the Reserve Bank's net domestic assets. In the second phase (i.e., April 21-November 3, 2000), the Reserve Bank's foreign currency assets declined by Rs.10,676 crore (adjusted for revaluation). Monetary policy action reduced liquidity in the form of a 0.5 per cent CRR hike and a reduction in banks' standing facilities. The gap was filled by the increase in the Reserve Bank's net credit to the Centre (Rs.17,783 crore), reflecting the net effect of the Reserve Bank's private placements and devolvements and repo operations under the Liquidity Adjustment Facility (LAF). In the third phase (November 3, 2000 onwards), liquidity generated by the Reserve Bank's absorption of IMD proceeds and the revival of capital inflows resulted in renewed interest in government paper, reducing the net RBI credit to the Centre by Rs.20,545 crore (before closure of accounts).
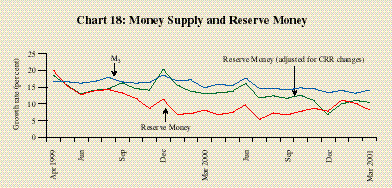
In a regime of frequent CRR changes, it is useful to adjust bank reserves and thus reserve money for changes in reserve requirements. Adjusted for cumulative first round changes in reserve requirements1, the reserve money growth rate followed an inverted U curve during 1999-2000 and 2000-01 in contrast to the path of the unadjusted reserve money growth rate (Chart 18). The deceleration in the average adjusted reserve money growth rate to 11.7 per cent during 2000-01 from 15.3 per cent during 1999-2000 pulled down monetary growth rate.
This is a simplified method of adjusting reserve money, which could be technically computed following Rangarajan C., and Anoop Singh, (1984), "Reserve Money : Concepts and Policy Implications Implications for India", RBI Occasional Papers, June:
M0* = M0 - { (rt r0) D + IR DF }
where M0* is adjusted reserve money, M0 reserve money, rt current cash reserve ratio, r0 base period cash reserve ratio, D demand and time liabilities relevant for computation of CRR, IR incremental reserve requirements and DF net CRR default for all commercial banks.
Monetary policy regimes all over the world have undergone fundamental shifts in their operational settings, reflecting the sweeping changes in their environment brought on by globalisation and financial restructuring. The progressive downgrading of monetary targets in several countries has ushered in a transitional phase during which the analytics and evidence are being re-examined in the search for a new operational framework for monetary policy. Some countries have chosen to develop institutional settings and operating procedures which enable them to directly target inflation. Operational independence for the monetary authority mandated by an act of legislature has usually formed part of the institutional apparatus for inflation targeting, consistent with the rule of 'one target, one instrument'. For many countries, however, strict pursuit of the assignment rule poses some problems. There is the absence of fully integrated financial markets which provide transmission channels for policy impulses and also allow for adjustments between the outcomes of independently deployed policy instruments. Furthermore, structural changes in the financial system have caused shifts in the transmission channels so that even in countries with well-developed financial markets, the transmission channels for monetary policy remain uncertain. In countries where monetary policy is also burdened with quasi-fiscal responsibilities such as debt management, deficit financing and the rationing of credit, the precise effects of monetary policy are difficult to estimate. Moreover, there is a high degree of uncertainty about the lags in monetary policy, and therefore, its impact on the future. Consequently, confronted with the short run trade-off between growth and inflation, the dilemma of having to pursue both becomes live and real. In such situations, target flexibility and balancing of conflicting goals is unavoidable. It is perhaps for this reason that central banks have to pursue multiple objectives in practice (Table 9).
In India also, monetary policy decisions are time-, context- and environment-specific with elements of sound judgement and objective/ quantitative analysis reinforcing each other. While rules serve the interest of transparency, they are not meant to be so binding as to preclude discretionary actions by the authorities. While inflation control and financial stability have been accorded prime importance, growth and employment are equally matters of policy concern. These issues become even more relevant when authorities have to contend with variable transmission lags in the effects of monetary policy and when conflicting signals emanate from various macroeconomic aggregates and render the inflation outcome uncertain. There may be compelling conditions in the current period to ease the policy stance in the interest of growth. The conflict becomes sharper in countries characterised by large unorganised agricultural sectors, credit-constrained informal sectors and lack of depth in financial markets. The problem gets compounded during periods of domestic or external uncertainties when the trade-off at the margin assumes importance.
Table 9: Monetary Policy Operating Procedures in Selected Emerging Market Economies |
|
|
|||||||||||||||||||
Country |
Target |
Intermediate/ |
Instruments |
Supporting |
|||||||||||||||
Operating Target |
Indicators |
||||||||||||||||||
|
|
|||||||||||||||||||
1 |
2 |
3 |
4 |
5 |
|||||||||||||||
|
|
|||||||||||||||||||
Brazil |
Sustainable |
Money, credit and |
OMO, CRR |
||||||||||||||||
growth and |
interest rates |
and financial |
|||||||||||||||||
price stability |
assistance |
||||||||||||||||||
for liquidity |
|||||||||||||||||||
Indonesia |
Exchange rate |
Monetary base and |
CRR, discount |
Interest rates, |
|||||||||||||||
and price |
real effective |
rate, OMO |
exchange rate |
||||||||||||||||
stability |
exchange rate |
& moral suasion |
|||||||||||||||||
Malaysia |
Inflation and |
Intervention rate, |
Direct borrowing/ |
Real interest rates, |
|||||||||||||||
growth |
inter-bank rates |
lending, selective |
inflation and |
||||||||||||||||
credit and admini- |
inflation indicators, |
||||||||||||||||||
strative measures, |
asset prices, credit |
||||||||||||||||||
CRR, OMO and |
and money |
||||||||||||||||||
moral suasion |
|||||||||||||||||||
Mexico |
Purchasing |
Money and |
Money and |
||||||||||||||||
power of |
foreign exchange |
monetary base, |
|||||||||||||||||
currency |
market operations |
inflation |
|||||||||||||||||
indicators, |
|||||||||||||||||||
employment, |
|||||||||||||||||||
exchange rate and |
|||||||||||||||||||
balance of |
|||||||||||||||||||
payments |
|||||||||||||||||||
|
|
|||||||||||||||||||
Liquidity Management
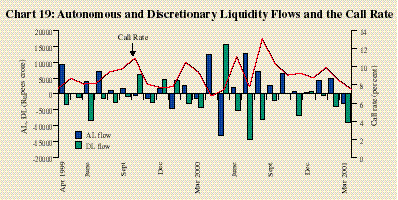
The Reserve Bank strategically offset changes in autonomous liquidity with changes in discretionary liquidity in order to stabilise money market conditions in 2000-01 (Chart 19). The cost of discretionary liquidity influenced the spectrum of short-term market interest rates.
Liquidity Adjustment Facility
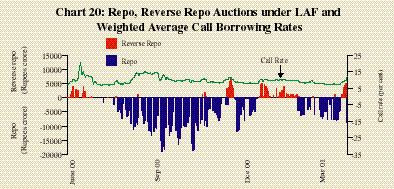
The Liqudity Adjustment Facility (LAF) has provided a mechanism for central banks to modulate liquidity in the system and thereby influence short-term interest rates consistent with monetary policy objectives. Operating procedures under LAF range from exclusive use of market-based instruments like open market operations including repos to the availibility of a discount window facility. In India, the LAF operates through repo and reverse repo auctions, thereby setting a corridor for the short-term interest rates, consistent with the policy objectives. The LAF, which was introduced on June 5, 2000, enabled the Reserve Bank, to modulate short-term liquidity under varied financial market conditions in order to ensure stability in call money rates during 2000-01. The LAF was operated both as a tool for liquidity management and for interest rate signaling depending upon market conditions. During June 2000, the commencement of LAF operations coincided with tight liquidity conditions resulting mainly from foreign currency sales by the Reserve Bank in the wake of currency market uncertainties and advance tax outflows. The reverse repo auctions under LAF were employed to arrest overshooting in the call money rates. Initially, the cut-off reverse repo rate was shifted upwards from 9.0 to 14.0 per cent with a view to ensuring orderly conditions in the foreign exchange market. Subsequently, with restoration of stable conditions in the foreign exchange market and improvement in liquidity, the cut-off repo rate was gradually brought back to 9.0 per cent by mid-July 2000. Thereafter, the LAF was largely employed to supplement direct monetary measures taken by the Reserve Bank on July 21, 2000 in response to uncertainties in financial market conditions. Repo auctions were used for absorption of liquidity and for signaling interest rates. Additional repo auctions with maturity ranging from 3 to 7 days were also undertaken from August 3, 2000. The cut-off rates on daily repo auctions were gradually raised from 8.0 per cent to a peak of 15.0 per cent on August 18, 2000. With the return of stable conditions in financial markets, the cut-off repo rates were gradually brought down to 10.0 per cent on September 30, 2000 and further to 8.5 per cent on October 20, 2000. In contrast to similar situations in the past, no spike in call rates occurred during July-October 2000. Together with open market operations (OMO), repo auctions were effectively used in November-December 2000 to absorb excess liquidity largely emanating from the proceeds of India Millennium Deposits (IMD). The repo rate, at 8.0 per cent, provided a floor to call money rates. Towards the end of December 2000, advance tax payments and increased interest in government paper in the secondary market led to hardening of call rates. Reverse repo operations, injecting liquidity at 10.0 per cent, were used from end-December 2000 to end-January 2001 to ensure stability in the call money rate. Thereafter, liquidity conditions eased with a 50 basis point cut in the CRR. Towards the end of March 2001, balance sheet considerations and bunching of holidays led to hardening of call rates. The Reserve Bank responded by conducting a special auction under LAF on March 31, 2001, apart from the regular auctions (Chart 20).
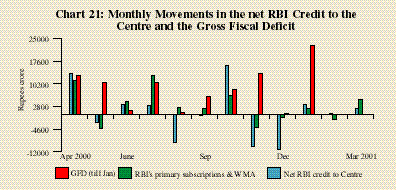
LAF operations were combined with strategic open market operations and devolvement/private placements consistent with market liquidity conditions in the context of the financing of the Centres fiscal deficit (Chart 21).


