III. Monetary and Liquidity Conditions - RBI - Reserve Bank of India
III. Monetary and Liquidity Conditions
Monetary Trends
Credit Behaviour
Reserve Money
Liquidity Management
Liquidity Adjustment Facility
Monetary conditions remained stable during 2002-03. Large and persistent capital inflows were sterilised by timely open market and repo operations. Consequently, base money expansion remained moderate. Money supply, in terms of broad money (M3) excluding the effects of mergers as well as the residency based new monetary aggregate (NM3), remained in alignment with initial expectations. The revival in non-food bank credit, which was evident in the last quarter of 2001-02, firmed up throughout 2002-03 reflecting the improvement in the industrial climate. Nevertheless, liquidity in the financial system was ample. This was reflected in the broader measures of liquidity (L1, L2 and L3) (Table 11). Despite the Centre’s market borrowing moderately exceeding the budgeted level, there was a softening of interest rates with varying sensitivity across the spectrum.
Table 11 : Monetary Indicators |
|||||||||
|
|
|||||||||
Variable |
Outstanding |
(Variation in per cent) |
|||||||
as on |
Point-to-point |
Monthly Average |
|||||||
March 31, 2003 |
Basis |
Basis |
|||||||
|
|
|||||||||
(Rupees crore) |
2001-02 |
2002-03 |
2001-02 |
2002-03 |
|||||
|
|
|||||||||
1 |
2 |
3 |
4 |
5 |
6 |
||||
|
|
|||||||||
I. |
Reserve Money |
3,68,931 |
11.4 |
9.2 |
11.1 |
9.2 |
|||
II. |
NM3* |
15,97,482 |
15.7 |
14.3 |
15.5 |
15.0 |
|||
III. |
a) |
L1* |
16,46,712 |
16.0 |
14.4 |
15.7 |
15.2 |
||
b) |
L2* |
16,52,322 |
15.7 |
14.0 |
15.5 |
14.8 |
|||
c) |
L3** |
16,38,412 |
14.7 |
14.0 |
15.2 |
14.3 |
|||
IV. |
Broad Money (M3) |
16,94,907 |
14.2 |
13.0 |
16.1 |
14.0 |
|||
a) |
Currency with the Public |
2,71,662 |
15.2 |
12.5 |
12.7 |
13.8 |
|||
b) |
Aggregate Deposits |
14,19,971 |
14.2 |
13.1 |
16.8 |
14.1 |
|||
i) |
Demand Deposits |
1,96,473 |
7.2 |
10.2 |
10.3 |
9.7 |
|||
ii) |
Time Deposits |
12,23,498 |
15.4 |
13.6 |
18.0 |
14.8 |
|||
V. |
Major Sources of Broad Money |
||||||||
a) |
Net Bank Credit to the |
||||||||
Government (i+ii) |
6,74,352 |
14.6 |
15.0 |
16.6 |
13.4 |
||||
i) |
Net Reserve Bank Credit to |
||||||||
Government |
1,20,102 |
-1.1 |
-21.1 |
1.5 |
-17.5 |
||||
Of which: to the Centre |
1,16,015 |
-3.5 |
-17.9 |
0.6 |
-17.7 |
||||
ii) |
Other Banks’ Credit to |
||||||||
Government |
5,54,250 |
21.3 |
27.6 |
23.8 |
25.2 |
||||
b) |
Bank Credit to Commercial Sector |
8,59,945 |
11.3 |
13.7 |
12.7 |
12.1 |
|||
Of which: Scheduled Commercial |
|||||||||
Banks’ Non-food Credit |
6,31,344 |
13.6 |
17.8 |
11.8 |
16.3 |
||||
c) |
Net Foreign Exchange Assets of |
||||||||
Banking Sector |
3,99,235 |
26.0 |
26.8 |
24.6 |
31.4 |
||||
|
|
|||||||||
Data provisional. |
|||||||||
* Data pertain to end-February. |
|||||||||
**Data pertain to end-December. |
|||||||||
Note: M3, NM3, L1, L2, L3 and deposits are adjusted for the full impact of mergers while credit is adjusted for the initial impact of mergers since May 3, 2002. |
|||||||||
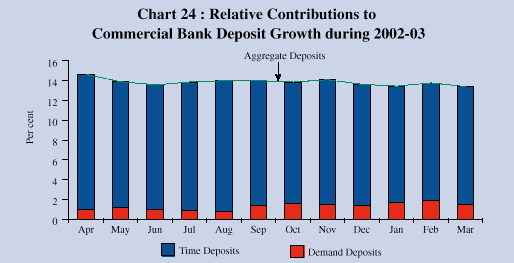
M3 (net of the full impact of mergers) moved in consonance with its projected trajectory of 14.0 per cent during 2002-03. Lower currency expansion relative to trend as well as slower time deposit growth restrained the monetary expansion. On the other hand, the relative contribution of demand deposits to aggregate deposits growth rose, indicating a shortening of time preference at the margin (Chart 24). On a year-on-year basis, M3 expansion was 13.3 per cent as on April 4, 2003 as compared with 14.0 per cent a year ago.
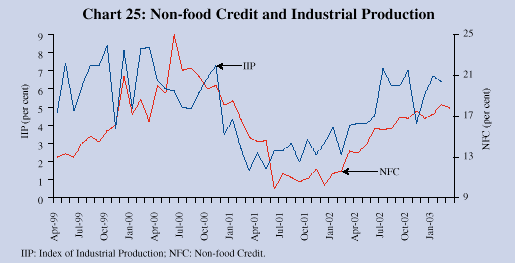
Food credit from commercial banks declined by Rs.4,499 crore in 2002-03 due to a significant fall in procurement operations and increase in off-take. Non-food credit to the commercial sector, inclusive of non-SLR investments by banks but excluding the initial impact of mergers, posted a recovery reflecting the improvement in industrial activity (Chart 25).
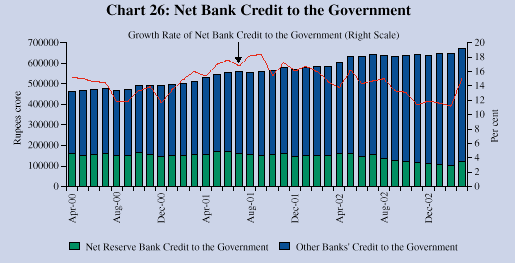
Net bank credit to the Government during 2002-03 increased marginally on a year-on-year basis and was 41.4 per cent of adjusted domestic credit (including commercial banks’ non-SLR investments) at end-March 2003. The share of the Reserve Bank in net bank credit to the Government declined from 25.9 per cent at the end of March 2002 to 17.8 per cent by end-March 2003 on account of the large open market operations conducted during the year.
Commercial banks exhibited a strong appetite for Government paper in primary auctions as well as in secondary operations by the Reserve Bank (Chart 26).
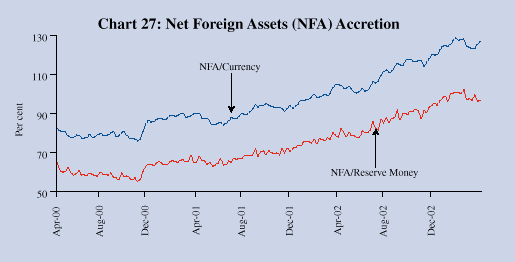
Accretions to the foreign currency assets of the Reserve Bank continued to be the principal component of reserve money as in the previous year. The Reserve Bank’s foreign currency assets (adjusted for revaluation) increased by Rs.82,090 crore during 2002-03 on top of an increase of Rs.55,836 crore in 2001-02. The ratios of net foreign currency assets of the Reserve Bank to currency as well as to reserve money improved steadily during the year reflecting prudent monetary management in the context of capital flows (Chart 27).
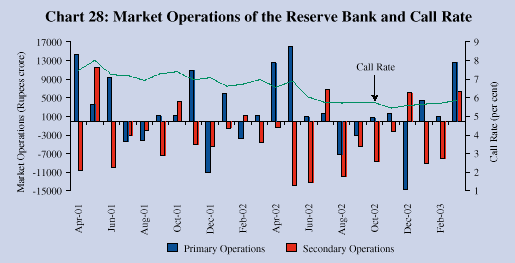
Market liquidity was augmented by the Reserve Bank’s primary subscription to the Central Government’s market borrowing programme (Rs.36,175 crore) and release of resources by way of lowering the cash reserve ratio (CRR) (around Rs.10,000 crore). Primary subscriptions included Rs.13,000 crore towards prepayment of loans drawn from multilateral agencies. This part of the increase in the Reserve Bank’s credit to the Centre is offset by a corresponding decline in NFA; as such, it has no monetary or fiscal impact and is neutral to market liquidity. The Reserve Bank’s secondary operations in the form of cumulative net open market sales and net repos of Rs.54,182 crore substantially offset the injections through primary operations (Chart 28). Accordingly, reserve money expansion at 9.2 per cent (Rs.30,960 crore) during 2002-03 was lower than in the preceding year (11.4 per cent). The year-on-year expansion in reserve money was 10.5 per cent on April 18, 2003 as compared with 13.0 per cent a year ago.
The Reserve Bank’s holding of Government securities came down sharply as a result of open market operations in an environment of ample liquidity and declining interest rates. Net Reserve Bank credit to the Centre declined by 17.9 per cent (Rs.25,369 crore) during 2002-03. The contraction began in the second quarter on the back of large open market sales. Subsequently, net open market sales remained sizeable and, along with retirement of ways and means advances, exerted a contractile effect on net Reserve Bank credit to the Centre (Table 12).
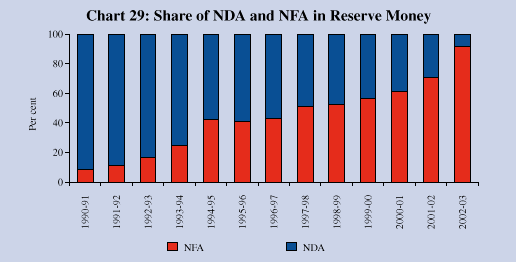
Surges in capital flows have significantly influenced the composition of the Reserve Bank’s balance sheet during the 1990s. Net foreign assets of the Reserve Bank, which formed only 8.5 per cent of the average outstanding reserve money in 1990-91, constituted 91.3 per cent by 2002-03 (Chart 29). This has implications in terms of approaching the limit to sterilisation and the constraints it presages on discretion in the conduct of monetary policy.
Table 12 : Net Reserve Bank Credit to the Centre: Quarterly Variation |
|||||||||
(Rupees crore) |
|||||||||
|
|
|||||||||
Variable |
2001-02 |
2002-03 |
|||||||
|
|
|||||||||
Q1 |
Q2 |
Q3 |
Q4 |
Q1 |
Q2 |
Q3 |
Q4 |
||
|
|
|||||||||
1 |
2 |
3 |
4 |
5 |
6 |
7 |
8 |
9 |
|
|
|
|||||||||
Net Reserve Bank Credit to the |
19,523 |
-20,140 |
-4,770 |
236 |
1,455 |
-19,555 |
-17,882 |
10,612 |
|
Centre (1+2+3+4-5) |
(13.3) |
(-12.1) |
(-3.3) |
(0.2) |
(1.0) |
(-13.7) |
(-14.5) |
(10.1) |
|
1. |
Loans and Advances |
3,619 |
-7,791 |
-1,223 |
5,176 |
2,472 |
-7,648 |
0 |
0 |
2. |
Treasury Bills held by the |
||||||||
Reserve Bank |
-3 |
-480 |
0 |
18 |
-18 |
0 |
0 |
3 |
|
3. |
Reserve Bank’s Holdings of |
||||||||
Dated Securities |
13,150 |
-11,907 |
-3,529 |
63 |
-6,107 |
-11,761 |
-17,979 |
11,116 |
|
4. |
Reserve Bank’s Holdings of |
||||||||
Rupee Coins |
39 |
38 |
-18 |
24 |
64 |
-146 |
97 |
-106 |
|
5. |
Central Government Deposits |
-2,718 |
0 |
-1 |
5,045 |
-5,044 |
0 |
0 |
401 |
Memo Items* |
|||||||||
1. |
Market Borrowings of Dated |
||||||||
Securities by the Centre # |
46,000 |
31,000 |
24,000 |
13,213 |
49,000 |
35,000 |
23,000 |
18,000 |
|
2. |
Reserve Bank’s Primary |
||||||||
Subscription to Dated Securities |
21,000 |
679 |
4,000 |
3,213 |
22,018 |
1,157 |
0 |
13,000 |
|
3. |
Repos (-) / Reverse Repos (+) |
||||||||
(LAF), net position £ |
1,355 |
1,410 |
-1,160 |
-4,605 |
-20,355 |
9,288 |
10,371 |
295 |
|
4. |
Net Open Market Sales # |
10,929 |
13,985 |
5,273 |
148 |
7,020 |
19,918 |
15,693 |
11,150 |
5. |
Primary Operations $ |
27,376 |
-7,273 |
1,178 |
3,368 |
29,598 |
-8,642 |
-12,527 |
18,217 |
|
|
|||||||||
* At face value. # Excludes Treasury Bills. £ At book value |
|||||||||
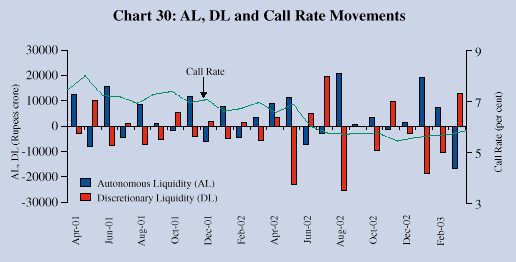
In line with international practices, market liquidity is the operating target for monetary policy in India. The Reserve Bank modulates liquidity in the market through its repo/reverse repo and open market operations, changes in reserve requirements and by direct interest rate signals through the Bank Rate and repo rate. During 2002-03, the strategic counterbalancing of the autonomous liquidity (AL1) flows with changes in both the quantum and the rate of policy or discretionary liquidity (DL) was effective in maintaining orderly conditions in the money market (Chart 30).
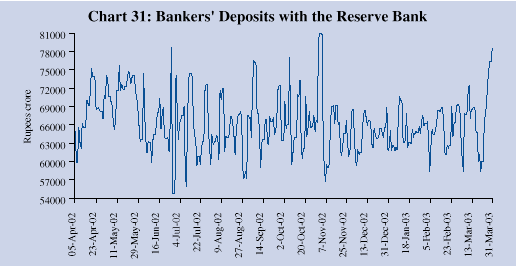
In the recent period, several changes in the operating procedures of monetary policy have enabled improved liquidity management by market participants. Progressive rationalisation of the maintenance requirements, including the withdrawal of all exemptions except on inter-bank liabilities, has been undertaken in consonance with a phased lowering of the height of the CRR towards its statutory minimum in the medium term. This was carried forward in 2002-03 by a cumulative 75 basis points reduction in the CRR, resetting the daily maintenance requirement to a uniform 80 per cent of the required reserves for a fortnight (lowered to 70 per cent since December 28, 2002) from differential intra-fortnight stipulations, phasing out of the collateralised lending facility (CLF) and making remaining standing facilities more market-based by splitting them equally between normal and back-stop facilities as against the earlier ratio of 2:1. Greater transparency of money and gilt market operations of the Reserve Bank also contributed to improved liquidity planning by banks as evident in the dampening of the variability of daily balances maintained by them with the Reserve Bank, especially in the second half of the year (Chart 31).
The Liquidity Adjustment Facility (LAF), operative since June 2000, has been effective in meeting day to day liquidity mismatches in the system, restricting volatility in short-term money market rates and in steering the movements in these rates consistent with monetary policy objectives. The LAF itself is evolving and is being fine-tuned to market conditions.
Conditions of comfortable liquidity in the beginning of the year were modulated through repo operations under the LAF. With the intensification of the Centre’s market borrowing programme, liquidity tightened in May 2002. A combination of partial acceptance of repo bids, undertaking devolvements/private placements of primary issuance of government securities and advancing the date of a pre-announced 50 basis points CRR cut to June 1, 2002 assuaged liquidity pressures. Liquidity conditions eased in June and the weighted average call money borrowing rate fell below the repo rate on June 24, 2002, prompting a reduction of the repo cut-off rate by 25 basis points to 5.75 per cent subsequently (Chart 32). Ample liquidity conditions, however, led to a virtual vacation of recourse to standing facilities ahead of the phasing out of the CLF.
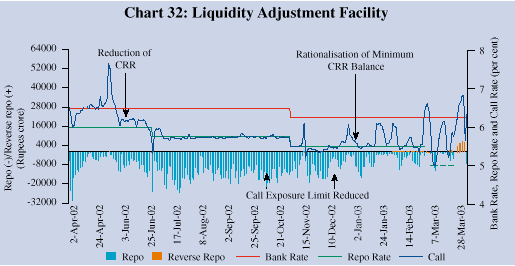
The coordinated reduction in the Bank Rate and the repo rate by 25 basis points each at the end of October 2002, followed by a 25 basis point cut in the CRR and the application of a uniform daily reserve maintenance in November 2002 were undertaken with a view to aligning the call rate with the informal corridor of the LAF. Liquidity conditions balanced as the CRR reduction became effective.
The minimum average daily CRR maintenance was reduced by 10 percentage points (from 80 per cent earlier), with effect from the fortnight beginning December 27, 2002. The liquidity conditions eased thereafter and the repo bid amounts increased. Money market conditions were temporarily strained in the second half of January and February 2003, resulting in low absorption through repos. The repo rate reduction by 50 basis points to 5.0 per cent on March 3, 2003 brought an easing of liquidity. Reverse repos were employed to inject liquidity and assuage the usual tightening at the end of the year. As the liquidity conditions eased, the average daily repo outstanding amount rose from Rs. 6,306 crore during the fortnight ended April 4, 2003 to Rs. 26,260 crore during the fortnight ended April 18, 2003.
1 AL = Reserve Bank’s net claims on the Government (adjusted for net open market (including repo) operations) + Claims on banks (other than credit to scheduled commercial banks) + Credit to the commercial sector (other than credit to PDs) + Net foreign assets – Notes in circulation – ‘Other’ deposits – Net non-monetary liabilities, in flow terms.
DL = Net open market (including repo) operations + Credit to scheduled commercial banks and primary dealers netted for cumulative changes in reserve requirements, in flow terms.


