
III. Monetary and Liquidity Conditions - RBI - Reserve Bank of India


III. Monetary and Liquidity Conditions
| Monetary Trends |
| Credit Behaviour |
| Reserve Money Survey |
| Liquidity Management |
Monetary conditions continued to be driven by large capital inflows in 2004-05 as in the previous year. Expansionary effects on base money and money supply were, however, headed off through operations under the Market Stabilisation Scheme (MSS) and the Liquidity Adjustment Facility (LAF). Consequently money supply (M 3) remained well within the projected trajectory of 14.0 per cent. The moderation in monetary expansion vis-à-vis the preceding year was also reflected in the residency-based new monetary aggregate (NM3), which excludes the impact of foreign currency non-resident deposits, as well as the liquidity aggregates (L 1, L2 a n d L3) (Table 11). A noteworthy feature underlying the evolution of monetary conditions in 2004-05 was the sharp rise in non-food credit which set in from July 2004 onwards in consonance with the buoyancy in industrial activity.
| Table 11 : Monetary Indicators |
||||||||||
| (Amount in Rs. crore) |
||||||||||
| Item |
Outstanding as |
Variation |
||||||||
| on Mar 31, |
2004-05 |
2003-04 |
||||||||
| 2 0 0 5 |
Absolute |
Per |
cent |
Absolute |
Per cent |
|||||
| 1 |
2 |
3 |
4 |
5 |
6 |
|||||
| I. |
Reserve Money |
4,89,128 |
5 2 , 6 1 6 |
1 2 . 1 |
6 7 , 4 5 1 |
1 8 . 3 |
||||
| I I . |
Broad |
Money |
22,65,587 |
2,57,058 |
1 2 . 8 |
2,90,569 |
1 6 . 9 |
|||
| (M 3 ) |
||||||||||
| a ) |
Currency with the Public |
3,57,424 |
4 2 , 0 1 6 |
1 3 . 3 |
4 3 , 8 2 7 |
1 6 . 1 |
||||
| b ) |
Aggregate Deposits |
19,01,680 |
2,13,678 |
1 2 . 7 |
2,44,866 |
1 7 . 0 |
||||
| i ) |
Demand Deposits |
2,97,088 |
3 9 , 0 7 5 |
1 5 . 1 |
5 9 , 2 5 6 |
2 9 . 8 |
||||
| i i ) |
Time Deposits |
16,04,592 |
1,74,603 |
1 2 . 2 |
1,85,610 |
1 4 . 9 |
||||
| of which: Non-Resident |
||||||||||
| Foreign Currency Deposits |
7 6 , 1 3 3 |
7 9 7 |
1 . 1 |
-17,170 |
- 1 8 . 6 |
|||||
| III. |
N M3 |
22,22,190 |
2,58,884 |
1 3 . 2 |
3,21,764 |
1 9 . 6 |
||||
| of |
which: Call Term Funding from |
|||||||||
| Financial Institutions |
3 4 , 1 2 9 |
9 , 4 5 9 |
3 8 . 3 |
1 2 , 0 3 2 |
9 5 . 2 |
|||||
| IV. |
a ) |
L 1 | 23,06,998 |
2,72,304 |
1 3 . 4 |
3,37,877 |
1 9 . 9 |
|||
| of |
which: Postal Deposits |
8 4 , 8 0 8 |
1 3 , 4 2 0 |
1 8 . 8 |
1 6 , 1 1 3 |
2 9 . 2 |
||||
| b ) |
L 2 | 23,08,649 |
2,67,710 |
1 3 . 1 |
3,37,826 |
1 9 . 8 |
||||
| of |
which: FI Deposits |
1 , 6 5 1 |
-4,594 |
- |
7 3 . 6 |
-51 |
- 0 . 8 |
|||
| c) |
L 3 | 23,27,893 |
2,67,232 |
1 3 . 0 |
3,37,642 |
1 9 . 6 |
||||
| of |
which: NBFC Deposits |
1 9 , 2 4 4 |
-478 |
- 2 . 4 |
-184 |
- 0 . 9 |
||||
| V. |
Major |
Sources of Broad Money |
||||||||
| a ) |
Net Bank Credit to the |
|||||||||
| Government (i+ii) |
7,50,303 |
6 , 6 3 8 |
0 . 9 |
6 7 , 1 4 3 |
9 . 9 |
|||||
| i ) |
Net Reserve Bank Credit to |
|||||||||
| Government |
-12,197 |
-57,105 |
- 1 |
2 7 . 2 |
-75,772 |
- 6 2 . 8 |
||||
| of which: to the Centre |
-13,727 |
-50,646 |
- 1 |
3 7 . 2 |
-76,065 |
- 6 7 . 3 |
||||
| i i ) |
Other Banks' Credit to |
|||||||||
| Government |
7,62,501 |
6 3 , 7 4 2 |
9 . 1 |
1,42,915 |
2 5 . 7 |
|||||
| b ) |
Bank Credit to Commercial Sector |
12,42,345 |
2,21,870 |
2 1 . 7 |
1,21,494 |
1 3 . 5 |
||||
| of |
which: Scheduled Commercial |
|||||||||
| Banks' Non-food Credit |
10,18,288 |
2,13,464 |
2 6 . 5 |
1,25,088 |
1 8 . 4 |
|||||
| c) |
Net Foreign Exchange Assets of |
|||||||||
| Banking Sector |
6,51,998 |
1,25,412 |
2 3 . 8 |
1,32,872 |
3 3 . 7 |
|||||
| FIs: Financial Institutions. |
||||||||||
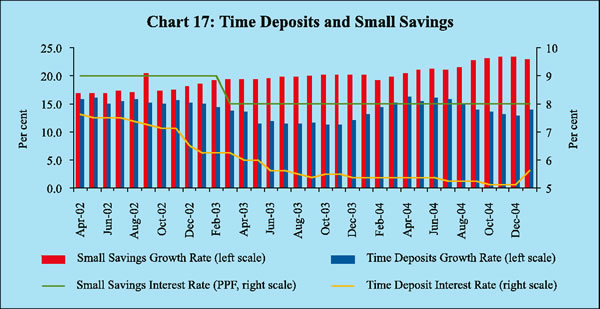
Reflecting the slowdown in agricultural activity, currency demand moderated in relation to the preceding year, barring the usual spurt during the festival season in October-November 2004. The growth in banks' deposits was also a shade lower due to substitution in favour of postal deposits, which continued to grow at a high rate, benefiting from tax incentives and their relatively attractive rate of return in comparison with time deposits (Chart 17). Non-resident foreign currency deposits, which had declined sharply in the previous year on account of redemptions of Resurgent India Bonds (RIBs), registered a moderate increase during 2004-05. Banks increasingly relied on non-deposit sources of funds in 2004-05
The flow of credit to industry from bank and non-bank sources surged during 2004-05 reflecting a broad-based strengthening of the industrial recovery. Food credit also increased during the year due to higher procurement operations, reversing the decline in the previous two years. Among non-bank sources of funds, resources raised by way of external commercial borrowing (ECB) and equity issues increased sharply. Financial assistance extended by financial institutions, however, continued to decline. Retained earnings turned out to be an important source of funds for the industrial sector, reflecting the growing significance of internal generation of funds resulting from improved corporate profitability (Table 12).
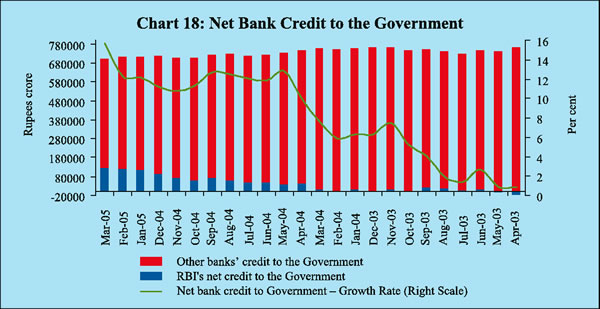
Net bank credit to the Government increased by barely 0.9 per cent during 2004-05 due mainly to a lower than budgeted borrowing programme of the Centre.
| Table 12 : Key Sources of Funds to Industry |
||||
| (Rupees crore) |
||||
| Item |
2004-05 |
2003-04 |
||
| 1 |
2 |
3 |
||
| A. |
Bank Credit to Industry (April-December) |
29,236 |
-877 |
|
| B. |
Flow from Non-banks to Corporates (1 to 5) |
37,332 |
677 |
|
| 1. |
Capital Issues * (i+ii) |
10,337 |
1,929 |
|
| i ) Non-Government Public Ltd. Companies (a+b) |
7,653 |
1,829 |
||
| a) Bonds/Debentures |
0 |
0 |
||
| b ) Shares |
7,653 |
1,829 |
||
| i i ) PSUs and Government Companies |
2,684 |
100 |
||
| 2. |
ADR/GDR Issues + |
2,960 |
3,098 |
|
| 3. |
External Commercial Borrowings (ECBs) (April-December) $ |
28,354 |
-4,580 |
|
| 4. |
Issue of CPs # |
3,852 |
2,304 |
|
| 5. |
Financial assistance extended by FIs (April-September) (net) |
-8,171 |
-2,074 |
|
| C. |
Retained earnings (April-September) @ |
9,698 |
6,462 |
|
| D. |
Depreciation Provision (April-September) |
10,381 |
9,257 |
|
| Total |
Flow of resources to Industry (A+B+C+D) |
86,647 |
15,519 |
|
| *:Gross issuances excluding issues by banks and financial institutions. |
||||
Commercial banks continued to hold government securities of nearly 40 per cent of their net demand and liabilities (NDTL) – far in excess of the prescribed statutory minimum ratio of 25 per cent – despite the fact that incremental investment in government securities during 2004-05 was small (Chart 18).
Reserve money grew by 12.1 per cent during 2004-05 as compared with 18.3 per cent during 2003-04, reflecting mainly the dampened currency growth and the base effect of the excess reserves built up on March 31, 2004. Fluctuations in reserve money growth during the year reflect the impact of capital flows, sterilisation operations, the hike in CRR during September-October 2004 and seasonal fluctuations in currency demand (Chart 19).
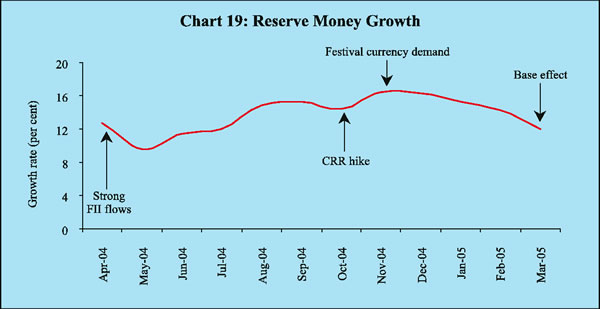
Reserve money declined in the first quarter of the year mainly due to large-scale sterilisation of capital inflows through the MSS and the LAF and the base effect of the excess reserves built up on March 31, 2004. In the second quarter, reserve money declined mainly due to capital outflows, MSS operations and increase in the Government's surplus cash balances with the Reserve Bank (Table 13).
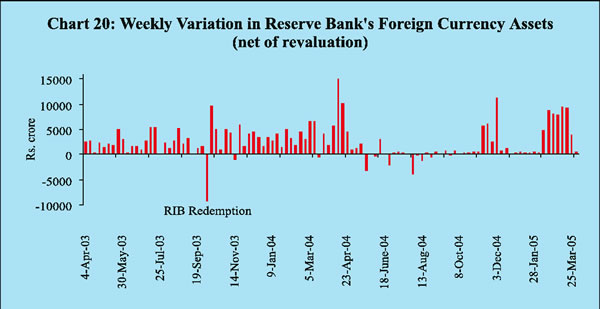
A strong revival of capital inflows in the third quarter led to a sharp increase in reserve money, which helped in meeting the expansion in currency demand on account of the festival season. Net Reserve Bank credit to the Centre remained almost unchanged as the decline in outstanding LAF balances was counterbalanced by increase in the Government's surplus cash balances with the Reserve Bank. Reserve money continued to grow in the fourth quarter as capital inflows continued to be sizeable (Chart 20).
During 2004-05, owing primarily to large balances under the MSS, net Reserve Bank credit to the Central Government declined sharply by Rs.50,646 crore on top of a decline of Rs.76,065 crore in 2003-04. Another contributing factor was the Centre's increased surplus cash balances with the Reserve Bank.
| Table 13 : Variation in Major Components and Sources of Reserve Money |
||||||||||||
| Item |
2003-04 |
2004-05 |
2003-04 |
2004-05 |
||||||||
| Q1 |
Q2 |
Q3 |
Q4 |
Q1 |
Q2 |
Q3 |
Q4 |
|||||
| 1 |
2 |
3 |
4 |
5 |
6 |
7 |
8 |
9 |
1 0 |
1 1 |
||
| Reserve Money |
67,451 |
52,616 |
16,342 |
-18,235 |
23,980 |
45,363 |
-6,812 |
-6,287 |
31,547 |
34,166 |
||
| (18.3) |
(12.1) |
|||||||||||
| Components |
||||||||||||
| 1. |
Currency in circulation |
44,555 |
41,621 |
17,882 |
-5,955 |
17,986 |
14,641 |
14,317 |
-4,166 |
16,467 |
15,003 |
|
| 2. |
Bankers’ Deposits with RBI |
21,019 |
9,631 |
-1,606 |
-12,633 |
5,961 |
29,297 |
-19,665 |
-2,874 |
14,769 |
17,401 |
|
| 3. |
Other Deposits with RBI |
1877 |
1,364 |
6 5 |
3 5 2 |
3 3 |
1426 |
-1,463 |
7 5 5 |
3 1 1 |
1,761 |
|
| Sources |
||||||||||||
| 1. |
RBI’s net credit to Government |
-75,772 |
-57,105 |
-4,451 |
-53,146 |
-12,506 |
-5,669 |
-34,143 |
-6,179 |
1 8 4 |
-16,967 |
|
| of which: to Centre |
-76,065 |
-50,646 |
4 3 4 |
-53,744 |
-15,844 |
-6,911 |
-30,029 |
-4,499 |
2 0 3 |
-16,321 |
||
| 2. |
RBI’s credit to banks and |
|||||||||||
| commercial sector |
-2,728 |
-833 |
-1,564 |
-2,525 |
-796 |
2,156 |
-2,985 |
-740 |
3,726 |
-835 |
||
| 3. |
NFEA of RBI |
1,26,169 |
1,28,377 |
22,710 |
25,720 |
51,931 |
25,808 |
57,525 |
-5,260 |
31,462 |
44,651 |
|
| 4. |
Government’s Currency |
|||||||||||
| Liabilities to the Public |
2 2 5 |
1 4 1 |
8 4 |
7 4 |
4 3 |
2 4 |
3 7 |
9 |
8 9 |
6 |
||
| 5. |
Net Non-Monetary |
|||||||||||
| Liabilities of RBI |
-19,557 |
17,964 |
4 3 7 |
-11,642 |
14,692 |
-23,044 |
27,245 |
-5,885 |
3,915 |
-7,311 |
||
| Memo: |
||||||||||||
| 1. |
Net Domestic Assets |
-58,719 |
-75,761 |
-6,368 |
-43,955 |
-27,951 |
19,555 |
-64,336 |
-1,025 |
8 5 |
-10,485 |
|
| 2. |
FCA, adjusted for revaluation |
1,41,428 |
1,15,044 |
23,943 |
31,832 |
37,560 |
48,093 |
33,160 |
-3,413 |
29,858 |
55,440 |
|
| 3. |
Net Purchases from |
|||||||||||
| Authorised Dealers |
1,40,650 |
91,105 |
22,237 |
29,899 |
40,669 |
47,845 |
30,032 |
-9,789 |
22,771 |
48,091 |
||
| 4. |
NFEA/Reserve Money |
|||||||||||
| (per cent) (end-period) |
111.0 |
125.3 |
98.8 |
110.8 |
117.2 |
111.0 |
126.1 |
126.7 |
124.9 |
125.3 |
||
| 5. |
NFEA/Currency (per cent) |
148.1 |
166.2 |
126.8 |
138.1 |
146.8 |
148.1 |
158.8 |
159.2 |
160.7 |
166.2 |
|
| NFEA: Net Foreign Exchange Assets. |
||||||||||||
Foreign currency assets of the Reserve Bank increased by Rs.1,15,044 crore (adjusted for revaluation) in 2004-05 on top of an accretion of Rs.1,41,428 crore in 2003-04.
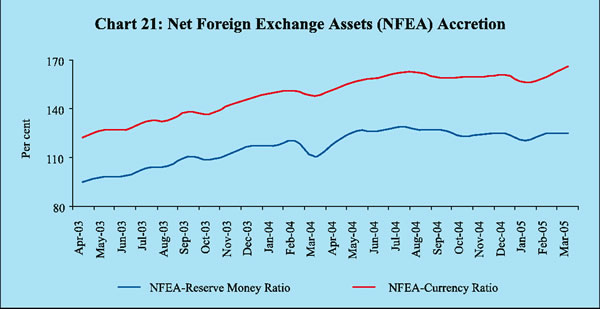
The continued strong inflow of foreign exchange assets was reflected in the high level of NFEA/reserve money (125.3 per cent as at end-March 2005) and NFEA/ currency (166.2 per cent as at end-March 2005) ratios (Chart 21).
The Reserve Bank was not required to support the Government in the primary market during 2004-05 barring in the second quarter when there was a devolvement of Rs.847 crore after a gap of two years (Table 14).
| Table 14 : Net Reserve Bank Credit to the Centre - Variations |
||||||||||||
| Item |
2003-04 |
2004-05 |
2003-04 |
2004-05 |
||||||||
| Q1 |
Q2 |
Q3 |
Q4 |
Q1 |
Q2 |
Q3 |
Q4 |
|||||
| 1 |
2 |
3 |
4 |
5 |
6 |
7 |
8 |
9 |
1 0 |
1 1 |
||
| Net Reserve Bank Credit to |
||||||||||||
| the |
Centre(1+2+3+4-5) |
-76,065 |
-50,646 |
4 3 4 |
-53,744 |
-15,844 |
-6,911 |
-30,029 |
-4,499 |
2 0 3 |
-16,321 |
|
| 1. |
Loans and Advances |
0 |
0 |
8,145 |
-8,145 |
0 |
0 |
3,222 |
-3,222 |
0 |
0 |
|
| 2. |
Treasury Bills held by the |
|||||||||||
| Reserve Bank |
- 3 |
0 |
- 3 |
0 |
0 |
0 |
0 |
0 |
0 |
0 |
||
| 3. |
Reserve Bank's Holdings of |
|||||||||||
| Dated Securities |
-72,227 |
12,323 |
-11,300 |
-45,530 |
-15,795 |
3 9 8 |
-2,901 |
22,176 |
14,095 |
-21,047 |
||
| 4. |
Reserve Bank's Holdings of |
|||||||||||
| Rupee Coins |
20 |
5 8 |
1 6 3 |
-68 |
-51 |
-23 |
1 7 5 |
-11 |
-93 |
-15 |
||
| 5. |
Central Government Deposits |
3,856 |
63,027 |
-3,430 |
0 |
- 1 |
7,287 |
30,525 |
23,443 |
13,799 |
-4,740 |
|
| Memo Items * |
||||||||||||
| 1. |
Market Borrowings of Dated |
|||||||||||
| Securities by the Centre # |
1,21,500 |
80,350 |
44,000 |
36,000 |
15,000 |
26,500 |
28,000 |
26,000 |
14,000 |
12,350 |
||
| 2. |
Reserve Bank's Primary |
|||||||||||
| Subscription to Dated |
||||||||||||
| Securities |
21,500 |
1,197 |
5,000 |
0 |
0 |
16,500 |
0 |
8 4 7 |
0 |
3 5 0 |
||
| 3. |
Repos (+) / Reverse Repos (-) |
|||||||||||
| (LAF), net position £ |
-32,230 |
15,315 |
-19,040 |
-4,455 |
-3,580 |
-5,155 |
-26,720 |
34,205 |
27,600 |
-19,770 |
||
| 4. |
Net Open Market Sales # |
41,850 |
2,899 |
5,620 |
16,671 |
14,225 |
5,332 |
4 2 9 |
4 2 7 |
8 7 1 |
1,172 |
|
| 5. |
Mobilisation under MSS |
0 |
64,211 |
0 |
0 |
0 |
0 |
37,812 |
14,444 |
3 5 3 |
11,602 |
|
| 6. |
Primary Operations $ |
-100 |
-61,305 |
25,643 |
-32,608 |
2,305 |
4,560 |
-459 |
-44,928 |
-39,338 |
23,418 |
|
| * : At face value. |
||||||||||||
The overhang of liquidity in the beginning of the year, combined with large capital inflows, continued to pose challenges for liquidity management and the conduct of monetary policy during 2004-05. The Reserve Bank had to continually absorb liquidity during the year barring some episodic pressures in August, November and December when there were net injections of liquidity through the LAF.
Sterilisation operations were conducted through a new mechanism introduced in April 2004, viz., Market Stabilisation Scheme (MSS). While LAF continues to remain an important instrument for managing day-to-day liquidity, the institution of the MSS has facilitated the management of capital flows.
The liquidity management operations of the Reserve Bank during 2004-05 could be broadly divided into three phases depending upon the movement in capital flows (Table 15). In the first phase (from March 27, 2004 to May 14, 2004), strong capital inflows led to the accretion of foreign currency assets (adjusted for revaluation) to the extent of around Rs.38,000 crore. The decline in the Central Government's surplus cash balances with the Reserve Bank also led to an expansion of liquidity in the system. In this phase, the Reserve Bank managed liquidity primarily through the MSS.
| Table 15 : Phases of Reserve Bank’s Liquidity Management Operations |
|||||||
| (Rupees crore) |
|||||||
| 2003-04 |
2004-05 |
||||||
| Item |
April 1, |
December 27, |
March 27 – |
May 15 – |
October 30, |
||
| 2003 – |
2003 – |
May 14, |
October 29, |
2004 – |
|||
| December |
March 26, |
2004 |
2004 |
March 31, |
|||
| 26, 2003 |
2004 |
2005 |
|||||
| 1 |
2 |
3 |
4 |
5 |
6 |
||
| A. |
Drivers of Liquidity (1+2+3) |
56,248 |
46,646 |
36,218 |
-24,321 |
42,066 |
|
| 1. |
RBI’s Foreign Currency Assets |
||||||
| (adjusted for revaluation) |
93,334 |
46,171 |
37,919 |
-4,614 |
83,662 |
||
| 2. |
Currency with the Public |
-28,981 |
-15,126 |
-20,973 |
6,789 |
-27,552 |
|
| 3. |
Others (residual) |
-8,106 |
15,602 |
19,272 |
-26,496 |
-14,044 |
|
| 3 . 1 Surplus cash balances of the |
|||||||
| Centre with the Reserve Bank |
-13,135 |
6,685 |
15,355 |
-18,481 |
-7,721 |
||
| B. |
Management of Liquidity (4+5+6+7) |
-60,092 |
-37,242 |
-40,148 |
37,960 |
-31,852 |
|
| 4. |
Liquidity impact of LAF Repos (net) |
-27,075 |
-31,910 |
-12,095 |
66,040 |
-11,875 |
|
| 5. |
Liquidity impact of OMO (net) |
-36,517 |
-5,332 |
-277 |
-769 |
-1,853 |
|
| 6. |
Liquidity impact of MSS |
0 |
0 |
-27,776 |
-27,311 |
-9,124 |
|
| 7. |
First round liquidity impact |
||||||
| due to CRR change |
3,500 |
0 |
0 |
0 |
-9,000 |
||
| C. Bank Reserves # (A+B) |
-3,844 |
9 , 4 0 4 |
-3,930 |
13,639 |
10,214 |
||
| +:Indicates injection of liquidity into the banking system. |
|||||||
In the second phase (May 15, 2004 to October 29, 2004), net capital outflows, the increase in the Central Government's surplus cash balances with the Reserve Bank and absorption of liquidity through the MSS impacted liquidity in the system. As a result, the outstanding balances locked under the LAF declined by about Rs.66,000 crore. In fact, the Reserve Bank had injected liquidity (Rs.5,000 crore) through the LAF on August 12 to assuage temporary mismatches arising out of pressures from State Development Loans auctions, redemptions from mutual funds and the need to meet reserve requirements. Liquidity conditions remained comfortable until September 2004 when outflow of funds on account of advance tax payments, substantial rise in surplus cash balances of the Government with the Reserve Bank and the hike in the cash reserve ratio (CRR) exerted some pressure, pushing the call rates slightly above the LAF repo rate.
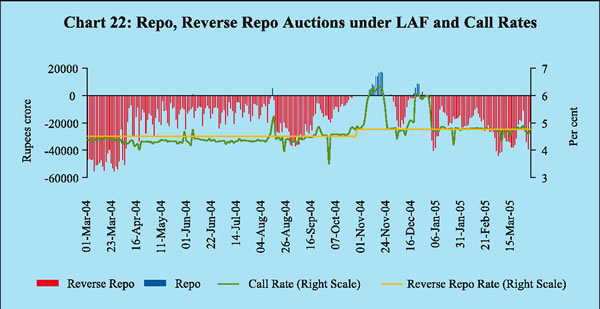
Capital inflows started picking up from end-October 2004, which marked the beginning of the third phase. The robust expansion in non-food credit offtake and a spurt in festival currency demand continued to exert pressure on liquidity, driving the call rates to 6.10 per cent on November 5, 2004 and further to 6.30 per cent as on November 18, 2004. The Reserve Bank injected daily net liquidity of over Rs.10,000 crore, on an average, during the period November 5-22, 2004 through the LAF. The ebbing of currency demand and a pick-up in capital inflows eased liquidity conditions with the call rates sliding to 4.55 per cent by December 10, 2004. The Reserve Bank absorbed excess liquidity resulting from an accretion of nearly Rs.21,000 crore to the net foreign currency assets (net of revaluation) between mid-November 2004 and the second week of December 2004. Liquidity conditions came under pressure briefly during the second half of December 2004 due mainly to moderation of capital inflows, advance tax payments, continued growth in non-food credit and the Central Government maintaining substantial surplus cash with the Reserve Bank. The Reserve Bank again injected daily net liquidity of around Rs.3,500 crore, on an average, from December 20-24, 2004 and did not undertake scheduled issuance of 364-day Treasury Bills under the MSS. Liquidity conditions turned comfortable thereafter facilitated by large capital inflows and decline in Centre's cash balances with the Reserve Bank. Call rates remained anchored to the reverse repo rate through January and the first half of February 2005 (Chart 22).
The liquidity overhang, which declined to around Rs.70,000 crore in January 2005 from over Rs.1,00,000 crore as at mid-April 2004, increased again to over Rs.83,000 crore by March 31, 2005. The total stock of Treasury Bills and dated securities issued under the MSS amounted to Rs.64,211 crore as at end-March 2005 inclusive of Rs.25,000 crore raised through dated securities with a residual maturity of up to 2.5 years. With the introduction of the MSS, liquidity absorption through the LAF declined from an outstanding balance of Rs.75,006 crore in April 2004 to Rs.10,805 crore in October 2004 but finally
rose to Rs.29,809 crore in March 2005. In addition to the MSS, LAF operations and CRR hike, surplus balances of the Centre with the Reserve Bank also helped in impounding liquidity.

Share this page:


Install the RBI mobile application and get quick access to the latest news!


