 IST,
IST,
III. Monetary and Liquidity Conditions
Monetary Survey
Monetary conditions remained easy during Q1, 2005-06 despite doubling of the trade deficit, a marked increase in the demand for bank credit from the commercial sector and the onset of the Government borrowing programme. As sterilisation operations were significantly lower than a year ago, reserve money increased in the first quarter – as against a decline in the first quarter of the previous year – as banks unwound their LAF positions and withdrew liquidity (lodging Government securities with the Reserve Bank) to finance the higher demand for credit. The year-on-year was nonetheless within the indicative trajectory of 14.5 per cent projected growth in M3 in the Annual Policy Statement. Expansion in the residency-based new monetary aggregate (NM3) – which excludes foreign currency non-resident deposits – was marginally higher than on account of net outflows under non-resident foreign M3 currency deposits and continued access of banks to call / term borrowings (Table 12).
|
Table 12: Monetary Indicators |
||||||||
|
(Amount in Rs. crore) |
||||||||
|
Item |
Outstanding |
Variation (year-on-year) |
||||||
|
as on July 8, |
2004 |
2005 |
||||||
|
2005 |
||||||||
|
Amount |
Per cent |
Amount |
Per cent |
|||||
|
1 |
2 |
3 |
4 |
5 |
6 |
|||
|
I. |
Reserve Money* |
5,07,068 |
54,163 |
14.4 |
77,615 |
18.1 |
||
|
II. |
23,71,769 |
2,77,034 |
15.3 |
2,88,579 |
13.9 |
|||
|
Broad Money (M3) |
||||||||
|
a) |
Currency with the Public |
3,76,252 |
40,706 |
14.0 |
44,991 |
13.6 |
||
|
b) |
Demand Deposits |
2,96,860 |
37,812 |
18.8 |
57,456 |
24.0 |
||
|
c) |
Time Deposits |
16,93,301 |
1,97,595 |
15.1 |
1,85,417 |
12.3 |
||
|
of which: Non-Resident Foreign Currency Deposits 75,722 |
-11,988 |
-13.4 |
-1,723 |
-2.2 |
||||
|
III. |
23,29,564 |
3,08,235 |
17.8 |
2,93,789 |
14.4 |
|||
|
NM3 |
||||||||
|
of which: Call Term Funding from |
||||||||
|
Financial Institutions |
36,250 |
14,539 |
95.9 |
6,549 |
22.0 |
|||
|
IV. |
a) |
24,17,515 |
3,25,345 |
18.2 |
3,06,294 |
14.5 |
||
|
L1 |
||||||||
|
of which: Postal Deposits |
87,951 |
17,110 |
29.3 |
12,505 |
16.6 |
|||
|
b) |
24,19,166 |
3,25,184 |
18.1 |
3,01,483 |
14.2 |
|||
|
L2 |
||||||||
|
of which: FI Deposits |
1,651 |
-161 |
-2.4 |
-4,811 |
-74.5 |
|||
|
c) |
24,39,064 |
3,24,454 |
17.9 |
3,02,157 |
14.1 |
|||
|
L3 |
||||||||
|
of which: NBFC Deposits |
19,898 |
-730 |
-3.7 |
674 |
3.5 |
|||
|
V. |
Major Sources of Broad Money |
|||||||
|
a) |
Net Bank Credit to the Government (i+ii) |
7,55,108 |
39,150 |
5.4 |
-4,069 |
-0.5 |
||
|
i) |
Net Reserve Bank Credit to Government |
-5,259 |
-97,151 |
-6,529 |
||||
|
of which: to the Centre |
-5,610 |
-96,238 |
-3,686 |
|||||
|
ii) |
Other Banks’ Credit to Government |
7,72,560 |
1,36,301 |
21.9 |
14,652 |
1.9 |
||
|
b) |
Bank Credit to Commercial Sector |
13,23,612 |
1,58,708 |
17.7 |
2,66,256 |
25.2 |
||
|
of which: Scheduled Commercial |
||||||||
|
Banks’ Non-food Credit |
10,95,722 |
1,57,003 |
23.0 |
2,56,626 |
30.6 |
|||
|
c) |
Net Foreign Exchange Assets of Banking Sector |
6,26,926 |
1,59,704 |
37.9 |
46,341 |
8.0 |
||
|
* : Data pertain to July 15, 2005. FIs: Financial Institutions. |
||||||||
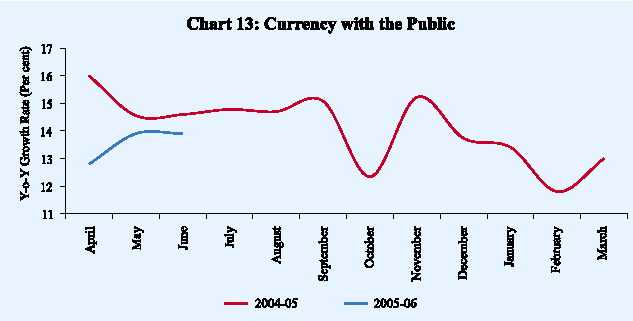
Year-on-year growth in demand for currency was somewhat lower in Q1, 2005-06 than a year ago, reflecting the effect of weak rural activity during 2004-05 (Chart 13).Demand deposits grew in sharp contrast to the sizeable decline during Q1 last year (Table 13). This could be attributed to the sharp pick-up in non-food credit, with funds getting temporarily parked in demand deposits.
|
Table 13: Monetary Aggregates – Variations |
|||||||
|
(Rs. Crore) |
|||||||
|
2004-05 |
2004-05 |
2005-06 |
|||||
|
Item |
Q1 |
Q2 |
Q3 |
Q4 |
Q1 |
||
|
1 |
2 |
3 |
4 |
5 |
6 |
7 |
|
|
(M3=1+2+3 = 4+5+6+7-8) |
2,48,262 |
69,831 |
19,657 |
52,509 |
1,06,266 |
1,05,850 |
|
|
Components |
|||||||
|
1. |
Currency with the Public |
40,797 |
14,540 |
-3,191 |
15,523 |
13,926 |
19,671 |
|
2. |
Aggregate Deposits with Banks |
2,06,106 |
56,754 |
22,094 |
36,675 |
90,584 |
87,737 |
|
2.1 Demand Deposits with Banks |
25,391 |
-14,038 |
1,399 |
15,313 |
22,717 |
11,401 |
|
|
2.2 Time Deposits with Banks |
1,80,716 |
70,792 |
20,694 |
21,362 |
67,867 |
76,337 |
|
|
3. |
‘Other’ Deposits with RBI |
1,359 |
-1,463 |
755 |
311 |
1,756 |
-1,558 |
|
Sources |
|||||||
|
4. |
Net Bank Credit to Government |
15,002 |
12,986 |
-11,011 |
-5,340 |
18,367 |
6,980 |
|
4.1 RBI’s net Credit to Government |
-62,882 |
-34,143 |
-6,179 |
184 |
-22,744 |
9,275 |
|
|
4.1.1 RBI’s net Credit to Centre |
-60,177 |
-30,029 |
-4,499 |
203 |
-25,852 |
14,600 |
|
|
4.2 Other Bank’s Credit to Government |
77,884 |
47,129 |
-4,832 |
-5,524 |
41,111 |
-2,295 |
|
|
5. |
Bank Credit to Commercial Sector |
2,64,389 |
38,057 |
44,893 |
1,05,627 |
75,813 |
64,221 |
|
5.1 SCBs’ Non-food Credit |
2,54,484 |
30,985 |
46,477 |
1,01,812 |
75,210 |
57,275 |
|
|
6. |
Net Foreign Exchange Assets of Banking Sector |
1,22,669 |
49,206 |
-1,335 |
32,891 |
41,907 |
-14,595 |
|
6.1 Net Foreign Exchange Assets of RBI |
1,28,377 |
57,525 |
-5,260 |
31,462 |
44,651 |
-14,595 |
|
|
7. |
Governments’ Currency Liabilities to the Public |
152 |
37 |
9 |
89 |
17 |
47 |
|
8. |
Net Non-Monetary Liabilities of Banking Sector |
1,53,949 |
30,454 |
12,898 |
80,759 |
29,839 |
-49,196 |
|
Memo items |
|||||||
|
1. |
Non-resident Foreign Currency Deposits with SCBs |
802 |
953 |
-189 |
-654 |
692 |
-494 |
|
2. |
Scheduled Commercial Banks’ Call-term |
||||||
|
Borrowing from Financial Institutions |
44,853 |
5,409 |
530 |
35,464 |
3,451 |
643 |
|
|
3. |
Overseas Borrowing by |
||||||
|
Scheduled Commercial Banks |
8,529 |
3,012 |
-658 |
6,267 |
-90 |
1,788 |
|
|
Note : Data include the impact of conversion of a non-banking entity into a banking entity effective October 11, 2004. |
|||||||
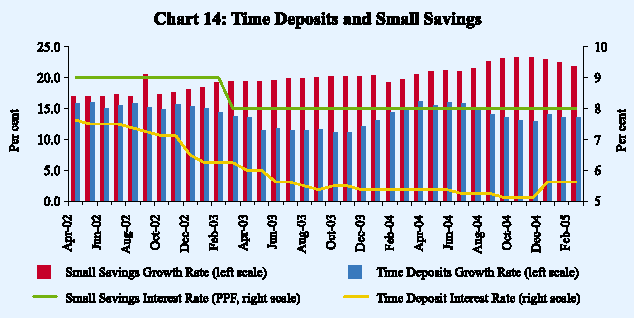
Time deposits decelerated during the quarter, despite marginal increases in deposit rates effective January 2005. The deceleration in time deposits reflected primarily the substitution in favour of postal deposits which provide higher interest rates as well as tax incentives (Chart 14).
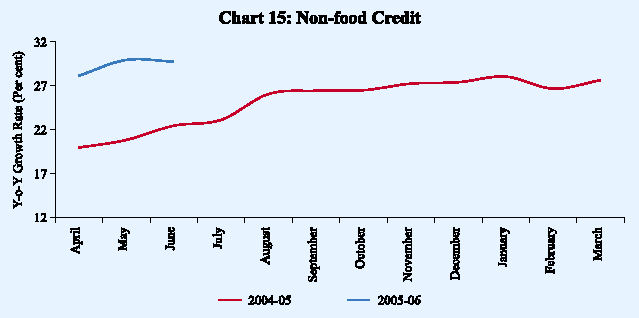
Food credit growth decelerated during the quarter in line with lower procurement of foodgrains. On the other hand, the commercial sector’s demand for bank credit, which had accelerated since July 2004 in tandem with a broad- based strengthening of the industrial recovery, gathered further pace in Q1, 2005-06. Year-on-year non-food credit growth reached 30.6 per cent on July 8, 2005 over and above that of 23.0 per cent a year ago (Chart 15).
During April 2005, credit pick-up was led by medium and large industries, housing and real estate. Amongst industries, credit to iron and steel, sugar, cotton textiles, automobiles, construction and petroleum registered high growth. Among non-bank sources of funds, resources raised by way of equity issues were higher
than that of Q1, 2004-05, benefiting from buoyancy in equity markets. Issuances
of commercial paper remained strong, reflecting the continued demand from leasing and finance companies (Table 14).
|
Table 14: Select Sources of Funds to Industry |
|||||||||
|
(Rupees crore) |
|||||||||
|
Item |
2004-05 |
2004-05 |
2005-06 |
||||||
|
Q1 |
Q2 |
Q3 |
Q4 |
Q1 |
|||||
|
1 |
2 |
3 |
4 |
5 |
6 |
7 |
|||
|
1. |
Bank Credit to Industry |
53,235 |
-267 |
18,089 |
13,733 |
21,680 |
12,065 |
# |
|
|
2. |
Capital Issues * (i+ii) |
10,466 |
228 |
4,529 |
3,214 |
2,495 |
1,254 |
||
|
i) Non-Government Public Ltd. |
|||||||||
|
Companies (a+b) |
7,782 |
228 |
4,529 |
530 |
2,495 |
1,254 |
|||
|
a) Bonds/Debentures |
0 |
0 |
0 |
0 |
0 |
118 |
|||
|
b) Shares |
7,782 |
228 |
4,529 |
530 |
2,495 |
1,136 |
|||
|
ii) PSUs and Government Companies |
2,684 |
0 |
0 |
2,684 |
0 |
0 |
|||
|
3. |
ADR/GDR Issues + |
2,960 |
770 |
597 |
872 |
721 |
789 |
||
|
4. |
External Commercial Borrowings (ECBs) $ |
38,887 |
12,199 |
3,860 |
11,084 |
11,744 |
– |
||
|
5. |
Issue of CPs |
5,104 |
1,819 |
421 |
1,901 |
963 |
3,547 |
||
|
#:Data pertain to April 2005. – : Not Available. Note : Data are provisional. |
|||||||||
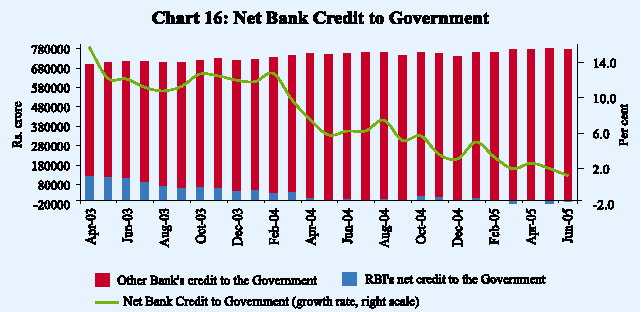
Banks financed the strong demand for credit by the commercial sector by reducing credit to Government by Rs. 2,295 crore during Q1, 2005-06 (Chart 16). As this switch primarily took the form of reversal of reverse repos under the LAF, the consequent lodging of securities with the Reserve Bank was reflected in an increase in net Reserve Bank credit to Government. Although the growth of net bank credit to the Government had been relatively subdued during Q1, 2005-06, commercial banks’ holding of securities eligible for the statutory liquidity ratio (SLR), at nearly 36 per cent of their net demand and time liabilities (NDTL), substantially exceed the statutory minimum requirement of 25 per cent.
Reserve Money Survey
Reserve money expansion was on a more moderate scale in Q1, 2005-06 than in the immediately preceding two quarters. Year-on-year growth, however, remained higher than a year ago (Chart 17).
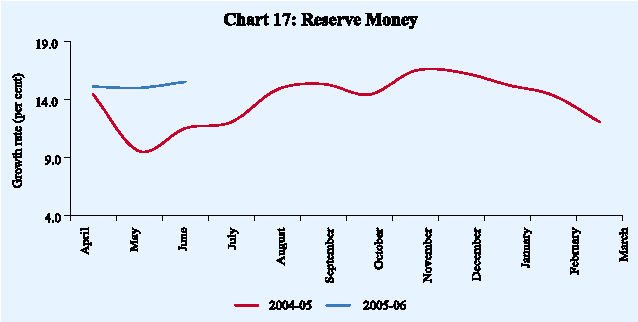
The expansion in reserve money during Q1, 2005-06 was primarily due to an increase in net Reserve Bank credit to the Government (Table 15).
|
Table 15: Variation in Major Components and Sources of Reserve Money |
|||||||
|
(Rs. Crore) |
|||||||
|
Item |
2004-05 |
2004-05 |
2005-06 |
||||
|
Q1 |
Q2 |
Q3 |
Q4 |
Q1 |
|||
|
1 |
2 |
3 |
4 |
5 |
6 |
7 |
|
|
Reserve Money |
52,623 |
-6,812 |
-6,285 |
31,547 |
34,173 |
7,303 |
|
|
Components |
|||||||
|
1. |
Currency in circulation |
41,633 |
14,317 |
-4,166 |
16,467 |
15,015 |
19,541 |
|
2. |
Bankers’ Deposits with RBI |
9,631 |
-19,665 |
-2,874 |
14,769 |
17,401 |
-10,680 |
|
3. |
‘Other’ Deposits with the RBI |
1,359 |
-1,463 |
755 |
311 |
1,756 |
-1,558 |
|
Sources |
|||||||
|
1. |
RBI’s net credit to Government |
-62,882 |
-34,143 |
-6,179 |
184 |
-22,744 |
9,275 |
|
of which: to Central Government |
-60,177 |
-30,029 |
-4,499 |
203 |
-25,852 |
14,600 |
|
|
2. |
RBI’s credit to banks and commercial sector |
-833 |
-2,985 |
-740 |
3,726 |
-835 |
1,155 |
|
3. |
NFEA of RBI |
1,28,377 |
57,525 |
-5,260 |
31,462 |
44,651 |
-14,595 |
|
4. |
Government’s Currency Liabilities to the Public |
152 |
37 |
9 |
89 |
17 |
47 |
|
5. |
Net Non-Monetary Liabilities of RBI |
12,191 |
27,245 |
-5,885 |
3,915 |
-13,084 |
-11,420 |
|
Memo items |
|||||||
|
1. |
Net Domestic Assets |
-75,754 |
-64,336 |
-1,025 |
85 |
-10,478 |
21,898 |
|
2. |
FCA, adjusted for revaluation |
1,15,044 |
33,160 |
-3,413 |
29,858 |
55,440 |
5,034 |
|
3. |
Net Purchases from Authorised Dealers |
91,105 |
30,032 |
-9,789 |
22,771 |
48,091 |
0 |
|
4. |
NFEA/Reserve Money (per cent) (end-period) |
125.3 |
126.1 |
126.7 |
124.9 |
125.3 |
120.5 |
|
5. |
NFEA/Currency (per cent) |
166.2 |
158.8 |
159.2 |
160.7 |
166.2 |
154.1 |
|
FEA :Net Foreign Exchange Assets. Note : Data are based on March 31 for Q4 and last reporting Friday for all other quarters. |
|||||||
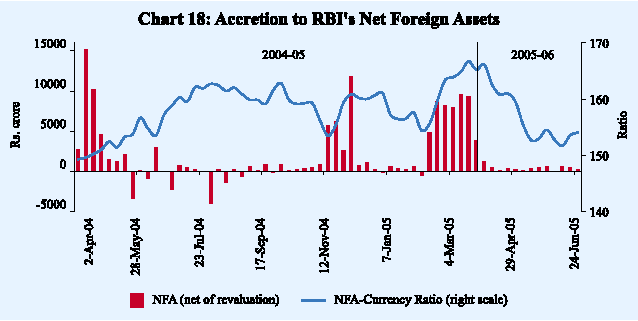
The Reserve Bank's foreign currency assets (net of revaluation) increased by Rs.5,034 crore during Q1, 2005-06 substantially lower than that of Rs. 33,160 crore during the first quarter of the preceding year. There were no net purchases from the authorised dealers during the quarter resulting in a decline of the NFA-currency ratio (Chart 18).
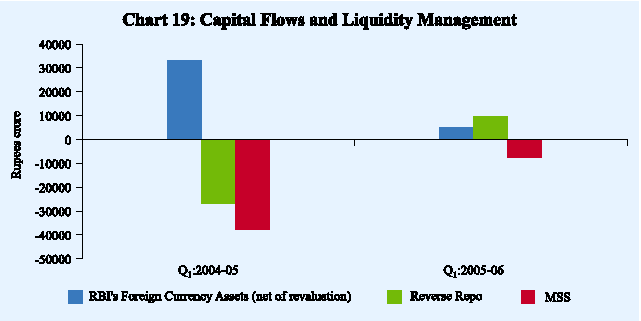
The absence of purchases of foreign currency from authorised dealers was mirrored in incremental absorption through the market stabilisation scheme (MSS) going down to Rs.7,469 crore i.e., one-fifth of the level in the comparable period of 2004 and an unwinding of liquidity under LAF reverse repos of the order of Rs.9,660 crore (Chart 19).
Net purchases of Government dated securities from the market and a reduction in the Centre’s surplus investment resulted in an increase in the Reserve Bank’s net credit to the Government (Table 16).
|
Table 16: Net Reserve Bank Credit to the Centre – Variations |
||||||||||
|
(Rs. Crore) |
||||||||||
|
Items |
2004-05 |
2004-05 |
2005-06 |
|||||||
|
Q1 |
Q2 |
Q3 |
Q4 |
Q1 |
||||||
|
1 |
2 |
3 |
4 |
5 |
6 |
7 |
||||
|
Net Reserve Bank Credit to the Centre (1+2+3+4-5) |
-60,177 |
-30,029 |
-4,499 |
203 |
-25,852 |
14,600 |
||||
|
1. |
Loans and Advances |
0 |
3,222 |
-3,222 |
0 |
0 |
0 |
|||
|
2. |
Treasury Bills held by the Reserve Bank |
0 |
0 |
0 |
0 |
0 |
0 |
|||
|
3. |
Reserve Bank’s Holdings of Dated Securities |
12,323 |
-2,900 |
22,176 |
14,095 |
-21,048 |
8,221 |
|||
|
4. |
Reserve Bank’s Holdings of Rupee Coins |
58 |
175 |
-11 |
-93 |
-15 |
-40 |
|||
|
5. |
Central Government Deposits |
72,558 |
30,525 |
23,443 |
13,799 |
4,791 |
-6,419 |
|||
|
Memo Items* |
||||||||||
|
1. |
Market Borrowings of Dated Securities |
|||||||||
|
by the Centre # |
80,350 |
28,000 |
26,000 |
14,000 |
12,350 |
42,000 |
||||
|
2. |
Reserve Bank’s Primary Subscription |
|||||||||
|
to Dated Securities |
1,197 |
0 |
847 |
0 |
350 |
0 |
||||
|
3. |
Repos (+) / Reverse Repos (-) (LAF), net position £ |
15,315 |
-26,720 |
34,205 |
27,600 |
-19,770 |
9,660 |
|||
|
4. |
Net Open Market Sales # |
2,899 |
429 |
427 |
871 |
1,172 |
1,543 |
|||
|
5. |
Mobilisation under MSS |
64,211 |
37,812 |
14,444 |
353 |
11,602 |
7,469 |
|||
|
6. |
Primary Operations $ |
-6,625 |
37,353 |
-30,484 |
-36,984 |
23,490 |
18,205 |
|||
|
* At face value. # Excluding Treasury Bills. £ Including fortnightly repos. |
||||||||||
Liquidity Management
During
Q1, 2005-06 the Reserve Bank injected primary liquidity into the
system in view of the sustained demand for credit and widening of the merchandise trade deficit partly offset by some drawdown of the Centre’s surplus balances maintained with the Reserve Bank. The absorption of liquidity through increase in balances under the MSS was more than offset by liquidity released through the LAF (Table 17).
|
Table 17: Phases of Reserve Bank’s Liquidity Management Operations |
|||||||
|
(Rupees crore) |
|||||||
|
2003-04 |
2004-05 |
2005-06 |
|||||
|
Item |
April 1, |
December |
March 27- |
May 15- |
October |
April 1- |
|
|
2003- |
27,2003- |
May 14, |
October 29, |
30,2004- |
June 24, |
||
|
December |
March 26, |
2004 |
2004 |
March |
2005 |
||
|
26,2003 |
2004 |
31, 2005 |
|||||
|
1 |
2 |
3 |
4 |
5 |
6 |
7 |
|
|
A. |
Drivers of Liquidity (1+2-+3) |
56,248 |
45,844 |
37,170 |
-24,471 |
43,734 |
-11,458 |
|
1. |
RBI’s Foreign Currency Assets |
||||||
|
(adjusted for revaluation) |
93,334 |
46,171 |
37,919 |
-4,614 |
83,662 |
5,034 |
|
|
2. |
Currency with the Public |
-28,981 |
-15,928 |
-20,021 |
6,639 |
-25,896 |
-19,671 |
|
3. |
Others (residual) |
-8,106 |
15,602 |
19,272 |
-26,496 |
-14,032 |
3,179 |
|
3.1Surplus cash balances of the |
|||||||
|
Centre with the Reserve Bank |
-13,135 |
6,685 |
15,355 |
-18,481 |
-7,721 |
4,357 |
|
|
B. |
Management of Liquidity |
||||||
|
(4+5+6+7) |
-60,092 |
-37,242 |
-40,148 |
37,960 |
-31,852 |
648 |
|
|
4. |
LAF Repos |
-27,075 |
-31,910 |
-12,095 |
66,040 |
-11,875 |
9,660 |
|
5. |
OMO (net) |
-36,517 |
-5,332 |
-277 |
-769 |
-1,853 |
-1,543 |
|
6. |
MSS |
0 |
0 |
-27,776 |
-27,311 |
-9,124 |
-7,469 |
|
7. |
First round impact of CRR change |
3,500 |
0 |
0 |
0 |
-9,000 |
0 |
|
C. |
Bank Reserves # (A+B) |
-3,844 |
8,602 |
-2,978 |
13,489 |
11,882 |
-10,810 |
|
+: Indicates injection of liquidity into the banking system. -: Indicates absorption/ leakage of liquidity from the banking system. #: Includes vault cash with banks and adjusted for first round liquidity impact due to CRR |
|||||||
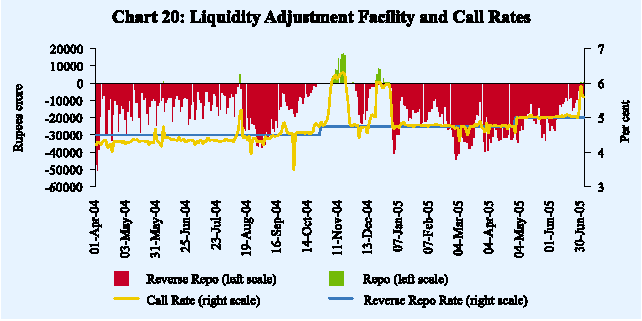
Easy liquidity conditions kept the call money rates close to the level of the reverse repo rate. With the increase in the fixed reverse repo rate from 4.75 per cent to 5.00 per cent, effective April, 2005 call rates also edged up in the subsequent period (Chart 20). In view of comfortable liquidity conditions during the quarter, the Reserve Bank conducted LAF repos only on two days (June 28, 2005 and June 30, 2005) of Rs.210 crore and Rs.575 crores, respectively. On a net basis, however, the Reserve Bank absorbed liquidity on both these days. The outstanding amount under reverse repo increased from Rs.6,470 crore at end-June 2005 to Rs.18,470 crore as on July 20, 2005.
Page Last Updated on:


