|
Growth in bank credit moderated during the first quarter of 2007-08 from the strong pace of the preceding three years. Accretion to banks’ deposits remained buoyant, led by time deposits. Year-on-year growth of broad money (M3) on July 6, 2007 was marginally higher than that at end-March 2007, and also remained above the indicative trajectory of 17.0-17.5 per cent for 2007-08 set out in the Annual Policy Statement (April 2007). Banks’ investments in SLR securities, as a proportion of their net demand and time liabilities (NDTL), rose during the quarter. Liquidity conditions continued to be dominated by movements in cash balances of the Governments and capital flows. The Reserve Bank modulated market liquidity with the help of issuances of securities under the Market Stabilisation Scheme (MSS), operations under the liquidity adjustment facility (LAF) and increase in the cash reserve ratio (CRR).
Monetary Survey
Growth in broad money (M3), year-on-year (y-o-y), was 21.6 per cent on July 6, 2007 as compared with 21.3 per cent at end-March 2007 and 19.0 per cent a year ago. Expansion in the residency-based new monetary aggregate (NM3) – which does not directly reckon non-resident foreign currency deposits such as FCNR(B) deposits –also accelerated to 21.3 per cent on July 6, 2007 from 20.0 per cent a year ago. Growth in liquidity aggregate, L1, at 20.7 per cent at end-June 2007 was higher than that of 20.4 per cent at end-March 2007 and 19.0 per cent a year ago (Chart 8 and Table 20).
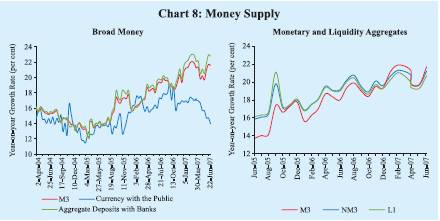
Table 20: Monetary Indicators |
(Amount in Rupees crore) |
Item |
Outstanding
as on |
Variation (year-on-year) |
|
July 6, |
July 7, 2006 |
|
March 31, 2007 |
July 6, 2007 |
|
2007 |
Absolute |
Per cent |
Absolute |
Per cent |
Absolute |
Per cent |
1 |
2 |
3 |
4 |
5 |
6 |
7 |
8 |
I. |
Reserve Money* |
7,52,675 |
85,647 |
17.2 |
1,35,961 |
23.7 |
1,69,551 |
29.1 |
II. |
Narrow Money (M1) |
9,55,793 |
1,39,774 |
20.6 |
1,38,820 |
16.8 |
1,38,933 |
17.0 |
III. |
Broad Money (M3) |
34,34,643 |
4,51,636 |
19.0 |
5,80,733 |
21.3 |
6,09,610 |
21.6 |
|
a) |
Currency with the Public |
4,97,817 |
60,216 |
16.0 |
70,352 |
17.0 |
60,960 |
14.0 |
|
b) |
Aggregate Deposits |
29,25,038 |
3,90,409 |
19.6 |
5,09,754 |
22.1 |
5,42,766 |
22.8 |
|
|
i) |
Demand Deposits |
4,46,188 |
78,547 |
26.6 |
67,841 |
16.7 |
72,089 |
19.3 |
|
|
ii) |
Time Deposits |
24,78,850 |
3,11,862 |
18.4 |
4,41,913 |
23.2 |
4,70,677 |
23.4 |
|
|
|
of which: Non-Resident |
|
|
|
|
|
|
|
|
|
|
Foreign Currency Deposits |
62,506 |
-13,174 |
-17.1 |
7,833 |
13.2 |
-1,185 |
-1.9 |
IV. |
NM3 |
|
|
34,41,815 |
4,73,728 |
20.0 |
5,70,274 |
20.8 |
6,03,306 |
21.3 |
|
of which: Call Term Funding from FIs |
82,240 |
13,398 |
18.9 |
2,692 |
3.2 |
-2140 |
-2.5 |
V. |
a) |
L1 |
|
35,11,133 |
4,64,458 |
19.0 |
5,82,836 |
20.4 |
6,02,011 |
20.7 |
|
|
of which: Postal Deposits |
1,15,204 |
14,301 |
15.4 |
11,286 |
10.9 |
– |
– |
|
b) |
L2 |
|
35,14,065 |
4,64,164 |
19.0 |
5,82,836 |
20.4 |
6,02,011 |
20.7 |
|
|
|
|
|
|
|
|
|
|
|
|
c) |
L3 |
|
35,40,129 |
4,67,208 |
18.9 |
5,85,059 |
20.3 |
6,04,234 |
20.6 |
VI. |
Major Sources of Broad Money |
|
|
|
|
|
|
|
|
a) |
Net Bank Credit to the Government (i+ii) |
9,13,087 |
37,748 |
4.9 |
71,582 |
9.3 |
1,04,372 |
12.9 |
|
|
i) |
Net Reserve Bank Credit to Government |
28,167 |
3,068 |
– |
-2,384 |
-29.3 |
30,358 |
– |
|
|
|
of which: to the Centre |
27,847 |
3,265 |
– |
-3,024 |
-58.6 |
30,191 |
– |
|
|
ii) |
Other Banks’ Credit to Government |
8,84,920 |
34,680 |
4.5 |
73,967 |
9.8 |
74,014 |
9.1 |
|
b) |
Bank Credit to Commercial Sector |
21,15,497 |
3,71,050 |
27.3 |
4,30,358 |
25.4 |
3,87,136 |
22.4 |
|
c) |
Net Foreign Exchange Assets |
9,14,552 |
1,60,694 |
25.6 |
1,86,985 |
25.7 |
1,25,715 |
15.9 |
|
d) |
Government’s Currency Liability to Public |
8,457 |
2 |
0.0 |
-467 |
-5.3 |
624 |
8.0 |
|
e) |
Net Non-Monetary Liabilities of the |
|
|
|
|
|
|
|
|
|
Banking Sector |
5,16,951 |
1,17,857 |
30.2 |
1,07,725 |
23.2 |
8,237 |
1.6 |
Memo: |
|
Aggregate Deposits of SCBs |
27,13,843 |
3,77,392 |
20.9 |
4,99,260 |
23.7 |
5,31,881 |
24.4 |
|
Non-food Credit of SCBs |
18,70,299 |
3,70,899 |
32.8 |
4,16,006 |
28.4 |
3,67,258 |
24.4 |
* : Data pertain to July 20, 2007.
SCBs : Scheduled Commercial Banks. FIs : Financial Institutions. NBFCs : Non-Banking Financial Companies.
NM3 is the residency-based broad money aggregate and L1, L2 and L3 are liquidity aggregates compiled on the recommendations of the Working Group on Money Supply (Chairman: Dr. Y.V. Reddy, 1998).
L1 = NM3 + Select deposits with the post office saving banks.
L2 = L1 +Term deposits with term lending institutions and refinancing institutions (FIs) + Term borrowing by
FIs + Certificates of deposits issued by FIs.
L3 = L2 + Public deposits of non-banking financial companies.
Note :
1. Data are provisional.
2. Postal deposits data pertain to end-March 2007.
3. Data reflect redemption of India Millennium Deposits (IMDs) on December 29, 2005. |
Consistent with the projections of money supply, the Annual Policy Statement for 2007-08 placed growth in aggregate deposits in 2007-08 at around Rs.4,90,000 crore. Based on an overall assessment of the sources of funding, the Statement noted that a graduated deceleration of non-food credit including investments in bonds/debentures/ shares of public sector undertakings and private corporate sector and commercial paper (CP) to 24.0-25.0 per cent in 2007-08 from the average of 29.8 per cent over 2004-07 would be consistent with the monetary projections.
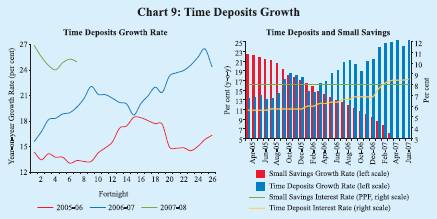
Growth of currency with the public on July 6, 2007 decelerated from end-March 2007 and also from the position a year ago. Growth in demand deposits, though higher than that at end-March 2007, was lower than a year ago. Consequently, growth in narrow money (M1), y-o-y, slowed down from 20.6 per cent on July 7, 2006 to 17.0 per cent on July 6, 2007, albeit marginally higher than 16.8 per cent at end-March 2007. On the other hand, growth in time deposits accelerated from 18.4 per cent on July 7, 2006 and 23.2 per cent at end-March 2007 to 23.4 per cent on July 6, 2007 (see Table 20). Concomitantly, the accretion to postal deposits decelerated to 10.9 per cent in March 2007 from 17.2 per cent a year ago. The higher order of increase in time deposits can be attributed, inter alia, to higher economic activity, increase in interest rates on bank deposits, unchanged interest rates on postal deposits and extension of tax benefits under Section 80C for bank deposits (Chart 9).
On a financial year basis, growth in during 2007-08 (up to July 6, M3 2007) was 3.8 per cent as compared with 3.5 per cent during the comparable period of the previous year (Table 21).
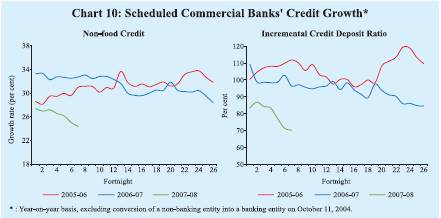
Bank credit to the commercial sector exhibited some moderation during the first quarter of 2007-08 from the strong pace of the previous three years. Scheduled commercial banks’ (SCBs’) non-food credit expanded by 24.4 per cent, y-o-y, on July 6, 2007 as compared with 28.4 per cent at end-March 2007 and 32.8 per cent a year ago. Non-food credit of SCBs including their non-SLR investments (shares, bonds/debentures and CPs) increased by 23.1 per cent (Rs.3,66,450 crore), y-o-y, on July 6, 2007 as compared with 29.5 per cent (Rs.3,60,938 crore) on July 7, 2006. Banks’ investments in instruments issued by mutual funds increased by Rs.30,381 crore, y-o-y, on July 6, 2007 as compared with Rs. 15,331 crore on July 7, 2006. The deceleration in credit growth coupled with the acceleration in deposits
Table 21: Monetary Aggregates – Variations |
(Rupees crore) |
Item |
2006-07 |
2007-08 |
|
2006-07 |
|
|
2007-08 |
|
(up to |
(up to |
|
|
|
|
|
|
July 7) |
July 6) |
Q1 |
Q2 |
Q3 |
Q4 |
Q1 |
1 |
2 |
3 |
4 |
5 |
6 |
7 |
8 |
M3 (1+2+3 = 4+5+6+7-8) |
95,488 (3.5) |
1,24,365 (3.8) |
55,411 |
1,68,401 |
62,951 |
2,93,970 |
78,638 |
Components |
1. |
Currency with the Public |
|
23,738 (5.7) |
14,346 (3.0) |
23,797 |
-2,878 |
27,587 |
21,847 |
17,752 |
2. |
Aggregate Deposits with Banks |
72,715 (3.1) |
1,05,727 (3.8) |
33,227 |
1,70,827 |
35,866 |
2,69,833 |
60,567 |
|
2.1 Demand Deposits with Banks |
-32,289 (-7.9) |
-28,040
(-5.9) |
-42,399 |
43,794 |
-8,252 |
74,697 |
-42,300 |
|
2.2 Time Deposits with Banks |
1,05,004 (5.5) |
1,33,767 (5.7) |
75,626 |
1,27,033 |
44,118 |
1,95,136 |
1,02,866 |
3. |
‘Other’ Deposits with Banks |
-964 |
4,292 |
-1,613 |
452 |
-502 |
2,291 |
319 |
Sources |
4. |
Net Bank Credit to Government |
42,120 (5.5) |
74,910 (8.9) |
23,431 |
14,175 |
-13,204 |
47,180 |
18,976 |
|
4.1 |
RBI’s Net Credit to Government |
-10,328 |
22,415 |
53 |
2,826 |
-12,754 |
7,490 |
-25,483 |
|
|
4.1.1 RBI’s Net credit to Centre |
-7,504 |
25,711 |
3,071 |
2,584 |
-12,568 |
3,889 |
-21,825 |
|
4.2 |
Other Banks’ Credit to Government |
52,448 |
52,495 |
23,378 |
11,349 |
-451 |
39,690 |
44,459 |
5. |
Bank Credit to Commercial Sector |
35,357 (2.1) |
-7,865
(-0.4) |
14,930 |
1,44,204 |
78,099 |
1,93,125 |
-25,063 |
6. |
NFEA of Banking Sector |
62,643 |
1,373 |
58,087 |
20,197 |
43,160 |
65,542 |
-2,745 |
|
6.1 |
NFEA of RBI |
|
76,402 |
1,373 |
71,845 |
11,392 |
27,250 |
82,682 |
-2,745 |
7. |
Government’s Currency
Liabilities to the Public |
-920 |
171 |
-920 |
155 |
166 |
132 |
171 |
8. |
Net Non-Monetary liabilities
of the Banking Sector |
43,712 |
-55,776 |
40,117 |
10,330 |
45,269 |
12,009 |
-87,299 |
Memo: |
1. |
Non-resident Foreign Currency
Deposits with SCBs |
4,416 |
-4,602 |
3,917 |
1,671 |
1,233 |
1,011 |
-4,527 |
2. |
SCBs’ Call-term Borrowing
from Financial Institutions |
1,236 |
-3,596 |
3,118 |
-1,576 |
-4,468 |
5,618 |
-2,916 |
3. |
Overseas Borrowing by SCBs |
1,265 |
-6,850 |
3,301 |
-3,685 |
-2,774 |
5,229 |
-6,666 |
SCBs : Scheduled Commercial Banks. NFEA : Net Foreign Exchange Assets.
Note : Figures in parentheses are percentage variations. |
growth led to a reduction in the incremental credit-deposit ratio (y-o-y) of SCBs to 70.2 per cent on July 6, 2007 from 96.4 per cent a year ago and 110.0 per cent at March 31, 2006 (Chart 10).
Disaggregated sectoral data available up to May 2007 show that about 39 per cent of incremental non-food credit (y-o-y) was absorbed by industry, led by infrastructure (power, port, telecommunication, etc.), textiles, iron and steel, engineering, petroleum, chemicals, construction and food processing industries. The infrastructure sector alone accounted for around 25 per cent of the incremental credit to the industry. The agricultural sector absorbed around 15 per cent of the incremental non-food credit expansion. Personal loans accounted for around 24 per cent of the incremental non-food credit; within personal loans, the share of incremental housing loans was around 11 per cent. Growth in loans to commercial real estate remained high (Table 22).
Table 22: Deployment of Non-food Bank Credit |
(Amount in Rupees crore) |
Sector/Industry |
Outstanding
as on May |
Year-on-Year Variation |
|
|
|
May 26, 2006 |
May 25, 2007 |
|
|
25, 2007 |
Absolute |
Per cent |
Absolute |
Per cent |
1 |
|
2 |
3 |
4 |
5 |
6 |
Non-food Gross Bank Credit (1 to 4) |
17,52,349 |
3,10,316 |
32.2 |
3,65,814 |
26.4 |
1. |
Agriculture and Allied Activities |
2,22,042 |
42,122 |
35.0 |
54,038 |
32.2 |
2. |
Industry (Small, Medium and Large) |
6,76,440 |
98,947 |
26.4 |
1,41,280 |
26.4 |
|
Small Scale Industries |
1,15,884 |
14,863 |
20.3 |
26,387 |
29.5 |
3. |
Personal Loans |
4,55,439 |
– |
– |
87,944 |
23.9 |
|
Housing |
2,30,751 |
– |
– |
41,066 |
21.6 |
|
Advances against Fixed Deposits |
39,092 |
6,076 |
22.9 |
6,237 |
19.0 |
|
Credit Cards |
14,221 |
– |
– |
4,411 |
45.0 |
|
Education |
15,438 |
– |
– |
4,903 |
46.5 |
|
Consumer Durables |
8,831 |
-1,103 |
-13.3 |
1,661 |
23.2 |
4. |
Services |
3,98,428 |
– |
– |
82,551 |
26.1 |
|
Transport Operators |
25,321 |
– |
– |
7,922 |
45.5 |
|
Professional and other Services |
24,834 |
– |
– |
8,999 |
56.8 |
|
Trade |
1,05,536 |
– |
– |
23,319 |
28.4 |
|
Real Estate Loans |
46,295 |
– |
– |
19,010 |
69.7 |
|
Non-Banking Financial Companies |
44,425 |
11,564 |
64.0 |
12,401 |
38.7 |
|
|
|
|
|
|
|
Memo: |
|
|
|
|
|
|
|
|
|
|
|
|
Priority Sector |
6,25,298 |
1,22,394 |
33.7 |
1,20,463 |
23.9 |
Industry (Small, Medium and Large) |
6,76,440 |
98,947 |
26.4 |
1,41,280 |
26.4 |
Food Processing |
37,367 |
4,545 |
19.9 |
6,758 |
22.1 |
Textiles |
77,657 |
14,704 |
37.8 |
19,223 |
32.9 |
Paper & Paper Products |
11,391 |
2,093 |
35.1 |
2,243 |
24.5 |
Petroleum, Coal Products & Nuclear Fuels |
29,039 |
2,135 |
14.5 |
9,884 |
51.6 |
Chemical and Chemical Products |
52,415 |
6,800 |
22.2 |
6,511 |
14.2 |
Rubber, Plastic and their Products |
8,855 |
2,291 |
56.3 |
1,938 |
28.0 |
Iron and Steel |
63,374 |
13,031 |
42.5 |
13,554 |
27.2 |
Other Metal & Metal Products |
20,454 |
2,769 |
26.7 |
5,447 |
36.3 |
Engineering |
42,592 |
5,683 |
22.3 |
8,553 |
25.1 |
Vehicles, Vehicle Parts and Transport Equipments |
23,691 |
5,045 |
58.3 |
5,267 |
28.6 |
Gems and Jewellery |
23,423 |
5,623 |
45.9 |
2,572 |
12.3 |
Construction |
20,123 |
4,192 |
50.6 |
6,632 |
49.2 |
Infrastructure |
1,43,520 |
25,557 |
35.0 |
35,292 |
32.6 |
– : Not available.
Note : 1. Data are provisional and relate to select scheduled commercial banks.
2. Owing to change in classification of sectors/industries and coverage of banks, data for 2006
onwards are not comparable with the earlier periods. |
Apart from bank credit, the corporates continued to fund their requirements through non-bank sources of funds such as capital markets, external commercial borrowings (ECBs) and internal funds. Resources raised through domestic equity issuances remained strong at Rs.13,261 crore during 2007-08 (April-June) (Table 23). Resources raised from international markets through American depository receipts (ADRs) and global depository receipts (GDRs) were Rs.1,251 crore during 2007-08 (April-June) as compared with Rs.4,965 crore a year ago. Net mobilisation under ECBs almost doubled to Rs.88,472 crore during 2006-07 (April-March). Internal generation of funds continued to provide strong support to the funding requirements as profits after tax of sample non-financial non-government companies during 2006-07 were around 45 per cent higher than that in the previous year.
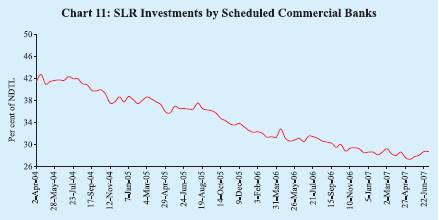
Investments by scheduled commercial banks in Government and other approved securities increased by 10.5 per cent, y-o-y, on July 6, 2007 as compared with 4.1 per cent a year ago (Table 24). Commercial banks’ holdings of Government securities at 28.7 per cent of their net demand and time liabilities (NDTL) on
Table 23: Select Sources of Funds to Industry |
(Rupees crore) |
Item |
|
2005-06 |
2006-07 |
|
2006-07 |
|
2007-08 |
|
|
|
|
|
Q1 |
Q2 |
Q3 |
Q4 |
Q1 |
1 |
|
|
2 |
3 |
4 |
5 |
6 |
7 |
8 |
A. |
Bank Credit to Industry # |
1,26,804 |
1,41,543 |
-2,336 |
49,290 |
28,415 |
66,174 |
-20,894 * |
B. |
Flow from Non-banks to Corporates |
|
|
|
|
|
|
|
|
1. |
Capital Issues (i+ii) |
13,781 |
29,180 |
10,627 |
1,882 |
10,840 |
5,831 |
13,788 |
|
|
i) Non-Government Public Ltd. |
|
|
|
|
|
|
|
|
|
Companies (a+b) |
13,408 |
29,180 |
10,627 |
1,882 |
10,840 |
5,831 |
13,261 |
|
|
a) Bonds/Debentures |
245 |
585 |
0 |
0 |
491 |
94 |
0 |
|
|
b) Shares |
13,163 |
28,595 |
10,627 |
1,882 |
10,349 |
5,737 |
13,261 |
|
|
ii) PSUs and Government Companies |
373 |
0 |
0 |
0 |
0 |
0 |
527 |
|
2. |
ADR/GDR Issues |
7,263 |
16,184 |
4,965 |
2,130 |
924 |
8,165 |
1,251 |
|
3. |
External Commercial Borrowings (ECBs) |
45,078 |
88,472 |
20,498 |
14,232 |
16,077 |
37,665 |
N.A. |
|
4. |
Issue of CPs |
|
-1,517 |
4,970 |
6,931 |
4,795 |
-908 |
-5,848 |
7,661 |
C. |
Depreciation Provision + |
|
28,883 |
37,095 |
8,449 |
8,892 |
9,172 |
10,338 |
N.A. |
D. |
Profit after Tax + |
|
67,506 |
1,11,107 |
24,845 |
27,710 |
28,698 |
31,251 |
N.A. |
N.A. : Not available.
* : April-May 2007.
# : Data pertain to select scheduled commercial banks. Data for 2005-06 are not comparable with those of later period due to increase in number of banks selected in the sample.
+ : Data are based on audited/ unaudited abridged results of select non-financial non-Government companies.
Data for the full year may not add to the quarterly totals due to difference in the number of companies covered in each period (see Chapter I).
Note :
1. Data are provisional.
2. Data on capital issues pertain to gross issuances excluding issues by banks and financial institutions.
Figures are not adjusted for banks’ investments in capital issues.
3. Data on ADR/GDR issues exclude issuances by banks and financial institutions.
4. Data on external commercial borrowings include short-term credit.
Data for 2005-06 are exclusive of the IMD redemption. |
Table 24: Scheduled Commercial Bank Survey |
(Amount in Rupees crore) |
Item |
Outstanding
as on July |
Variation (year-on-year) |
|
|
6, 2007 |
As on July 7, 2006 |
As on July 6, 2007 |
|
|
|
Amount |
Per cent |
Amount |
Percent |
1 |
|
2 |
3 |
4 |
5 |
6 |
Sources of Funds |
|
|
|
|
|
1. |
Aggregate Deposits |
27,13,843 |
377,392 |
20.9 |
5,31,881 |
24.4 |
2. |
Call/Term Funding from Financial Institutions |
82,240 |
13,398 |
18.9 |
-2,140 |
-2.5 |
3. |
Overseas Foreign Currency Borrowings |
25,055 |
3,190 |
11.4 |
-6,045 |
-19.4 |
4. |
Capital |
36,748 |
987 |
3.5 |
7,792 |
26.9 |
5. |
Reserves |
2,10,763 |
31,950 |
24.5 |
48,518 |
29.9 |
Uses of Funds |
|
|
|
|
|
1. |
Bank Credit |
19,14,527 |
363,936 |
30.9 |
3,73,632 |
24.2 |
|
of which: Non-food Credit |
18,70,299 |
3,70,899 |
32.8 |
3,67,258 |
24.4 |
2. |
Investments in Government and Other |
|
|
|
|
|
|
Approved Securities |
8,49,946 |
30,101 |
4.1 |
80,715 |
10.5 |
|
a) Government Securities |
8,29,251 |
33,351 |
4.6 |
76,409 |
10.1 |
|
b) Other Approved Securities |
20,695 |
-3,250 |
-16.5 |
4,306 |
26.3 |
3. |
Investments in Non-SLR Securities |
1,78,371 |
9,842 |
7.0 |
27,716 |
18.4 |
4. |
Foreign Currency Assets |
62,065 |
4,202 |
14.8 |
29,420 |
90.1 |
5. |
Balances with the RBI |
1,99,592 |
19,542 |
20.3 |
83,877 |
72.5 |
Note : Data are provisional. |
July 6, 2007 were somewhat higher than 28.0 per cent at end-March 2007 but lower than that of 31.5 per cent a year ago (Chart 11). Excess SLR investments of SCBs increased to Rs.1,10,207 crore on July 6, 2007 from Rs.84,223 crore at end-March 2007 but were lower than Rs.1,59,029 crore a year ago. Banks’ balances with the Reserve Bank expanded, reflecting the impact of the increase in their NDTL as well as the increase in the CRR. Investments by SCBs in non-SLR securities (such as shares/bonds/commercial papers) were also higher than a year ago. Banks’ holdings of foreign currency assets abroad were higher than that in the previous year; their overseas borrowings contracted. Funds raised through capital issues as well as internal accruals were higher than in the previous year.
Reserve Money Survey
Reserve money expanded by 29.1 per cent, y-o-y, as on July 20, 2007 (21.7 per cent adjusted for the first round effects of the hikes in the CRR1) as compared with 17.2 per cent a year ago (Chart 12).
During the financial year 2007-08 (up to July 20, 2007), reserve money expanded by 6.2 per cent (4.0 per cent adjusted for the first round effects of the hikes in the CRR) as compared with 1.8 per cent in the corresponding period of 2006-07. Growth in bankers’ deposits with the Reserve Bank increased by 14.0 per cent during 2007-08 (up to July 20, 2007) as against a decline of 6.2 per cent during the corresponding period of 2006-07. Currency in circulation expanded by 2.1 per cent as compared with 4.6 per cent during the corresponding period of the previous year (Table 25).
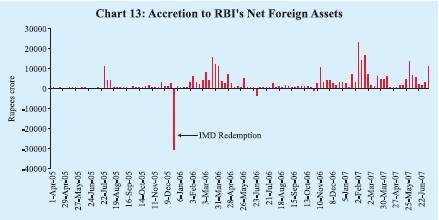
On the sources side, reserve money continued to be driven by net foreign currency assets (adjusted for revaluation), which rose by Rs.72,947 crore in 2007-
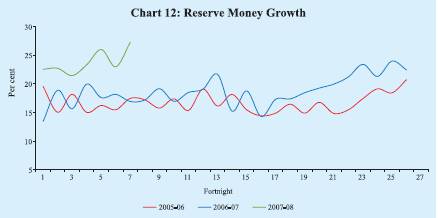
Table 25: Reserve Money |
(Amount in Rupees crore) |
Item |
Outstanding
as on July |
Variation |
|
20, 2007 |
2006-07 |
2006-07 |
2007-08 |
|
2006-07 |
2007-08 |
|
|
(April |
(Up to |
(Up to |
|
|
|
|
|
|
|
March) |
July 21) |
July 20) |
Q1 |
Q2 |
Q3 |
Q4 |
Q1 |
1 |
2 |
3 |
4 |
5 |
6 |
7 |
8 |
9 |
10 |
Reserve Money |
7,52,675 |
1,35,961 |
10,069 |
43,659 |
13,466 |
18,665 |
14,204 |
89,626 |
12,390 |
|
|
|
(23.7) |
(1.8) |
(6.2) |
|
|
|
|
|
Components (1+2+3) |
|
|
|
|
|
|
|
|
|
|
|
|
|
|
|
|
|
|
|
|
1. |
Currency in Circulation |
5,14,605 |
73,549 |
19,630 |
10,380 |
22,283 |
-2,011 |
26,871 |
26,405 |
16,870 |
|
|
|
(17.1) |
(4.6) |
(2.1) |
|
|
|
|
|
|
|
|
|
|
|
|
|
|
|
|
2. |
Bankers’ Deposits with RBI |
2,24,980 |
61,784 |
-8,453 |
27,685 |
-7,204 |
20,224 |
-12,165 |
60,929 |
-4,800 |
|
|
|
(45.6) |
(-6.2) |
(14.0) |
|
|
|
|
|
|
|
|
|
|
|
|
|
|
|
|
3. |
‘Other’ Deposits with the RBI |
13,090 |
628 |
-1,108 |
5,594 |
-1,613 |
452 |
-502 |
2,291 |
319 |
|
|
|
(9.1) |
(-16.1) |
(74.6) |
|
|
|
|
|
Sources (1+2+3+4-5) |
|
|
|
|
|
|
|
|
|
1. |
RBI’s Net Credit to Government |
21,884 |
-2,384 |
-9,374 |
16,132 |
53 |
2,826 |
-12,754 |
7,490 |
-25,483 |
|
of which: to Centre (i+ii+iii+iv-v) |
21,011 |
-3,024 |
-6,356 |
18,875 |
3,071 |
2,584 |
-12,568 |
3,889 |
-21,825 |
|
i. Loans and Advances |
30,058 |
0 |
0 |
30,058 |
0 |
0 |
0 |
0 |
0 |
|
ii. Treasury Bills held by the RBI |
0 |
0 |
0 |
0 |
0 |
0 |
0 |
0 |
0 |
|
iii. RBI’s Holdings of Dated Securities |
75,990 |
26,763 |
-33,913 |
-21,182 |
-27,610 |
24,944 |
22,733 |
6,696 |
-34,284 |
|
iv. RBI’s Holdings of Rupee coins |
91 |
-143 |
-20 |
79 |
9 |
-107 |
97 |
-142 |
128 |
|
v. Central Government Deposits |
85,127 |
29,644 |
-27,577 |
-9,921 |
-30,672 |
22,253 |
35,398 |
2,665 |
-12,330 |
|
|
|
|
|
|
|
|
|
|
|
2. |
RBI’s Credit to Banks and |
|
|
|
|
|
|
|
|
|
|
Commercial Sector |
1,394 |
1990 |
-3,094 |
-7,778 |
-3,135 |
3,107 |
2,065 |
-47 |
-6,450 |
|
|
|
|
|
|
|
|
|
|
|
3. |
NFEA of RBI |
8,93,888 |
1,93,170 |
87,888 |
27,735 |
71,845 |
11,392 |
27,250 |
82,682 |
-2,745 |
|
|
|
(28.7) |
(13.1) |
(3.2) |
|
|
|
|
|
|
of which :FCA, adjusted for revaluation |
|
1,64,601 |
30,663 |
72,947 |
28,107 |
10,948 |
31,634 |
93,913 |
47,728 |
|
|
|
|
|
|
|
|
|
|
|
4. |
Government’s Currency Liabilities |
|
|
|
|
|
|
|
|
|
|
to the Public |
8,457 |
-467 |
-868 |
171 |
-920 |
155 |
166 |
132 |
171 |
|
|
|
|
|
|
|
|
|
|
|
5. Net Non-Monetary liabilities of RBI |
1,72,948 |
56,347 |
64,483 |
-7,400 |
54,376 |
-1,184 |
2,524 |
632 |
-46,897 |
|
|
|
|
|
|
|
|
|
|
|
Memo: |
|
|
|
|
|
|
|
|
|
|
|
|
|
|
|
|
|
|
|
|
LAF, Repos (+) / Reverse Repos (-) |
-3,000 |
36,435 |
-38,820 |
-32,185 |
-23,060 |
28,395 |
22,195 |
8,905 |
-32,182 |
Net Open Market Sales # * |
|
5,125 |
2,503 |
1,910 |
1,536 |
1,176 |
389 |
2,024 |
1,246 |
Centre’s Surplus ** |
0 |
1,164 |
-42,699 |
-49,992 |
-27,321 |
13,313 |
38,713 |
-23,542 |
-34,597 |
Mobilisation under MSS * |
85,027 |
33,912 |
8,664 |
22,053 |
4,062 |
8,940 |
-3,315 |
24,225 |
19,643 |
Net Purchases(+)/Sales(-) |
|
|
|
|
|
|
|
|
|
from Authorised Dealers |
|
1,18,994 |
21,545 |
14,614 + |
21,545 |
0 |
19,776 |
77,673 |
14,614 + |
NFEA/Reserve Money @ |
118.8 |
122.2 |
130.5 |
118.8 |
127.0 |
125.0 |
126.5 |
122.2 |
119.7 |
NFEA/Currency @ |
173.7 |
171.8 |
169.0 |
173.7 |
164.4 |
167.7 |
164.0 |
171.8 |
165.7 |
NFEA : Net Foreign Exchange Assets.
FCA : Foreign Currency Assets.
LAF : Liquidity Adjustment Facility.
* : At face value. + : Up to May 25, 2007.
# : Excludes Treasury Bills.
@ : per cent, end of period.
** : Excludes minimum cash balances with the Reserve Bank in case of surplus.
Note :
1. Data are based on March 31 for Q4 and last reporting Friday for all other quarters.
2. Figures in parentheses are percentage variations during the fiscal year. |
08 (up to July 20, 2007) as compared with Rs.30,663 crore during the corresponding period of the previous year (Chart 13). Movements in the Reserve Bank’s net credit to the Centre largely reflected liquidity management operations by the Reserve Bank and trends in Government deposits. During 2007-08 (up to July 20, 2007), the Reserve Bank’s holdings of Central Government’s dated securities declined by Rs.21,182 crore, partly on account of absorption of liquidity under the liquidity adjustment facility (LAF). On the other hand, there was an increase of Rs.30,058 crore in ways and means advances/overdraft from the Reserve Bank. Central Government deposits declined reflecting a reduction in the Government’s cash surplus (Rs.49,992 crore), partly offset by an increase in balances under the MSS (Rs.22,053 crore). Reflecting these developments, net Reserve Bank credit to the Centre increased by Rs.18,875 crore during 2007-08 (up to July 20, 2007) as against a decline of Rs.6,356 crore during the corresponding period of the previous year.
Liquidity Management
During 2007-08, the Reserve Bank continued with its policy of active management of liquidity, using all the policy instruments at its disposal flexibly. Variations in cash balances of the Government and capital flows remained the key drivers of liquidity conditions.
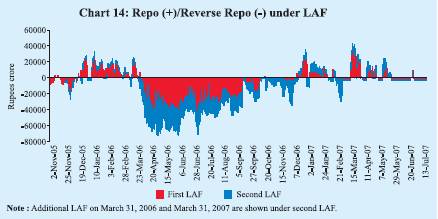
Liquidity pressures eased gradually from April 4, 2007 onwards, partly on account of reduction in the Centre’s cash balance from Rs.50,092 crore at end-March 2007 to Rs.32,023 crore by mid-April 2007. Consequently, the amount injected through LAF repos fell from Rs.29,185 crore at end-March 2007 to Rs.1,455 crore by April 5, 2007 and subsequently, liquidity was absorbed under the LAF reverse repos during April 9-15, 2007. The amount absorbed was capped at Rs.3,000 crore as per the modified arrangements effective March 5, 2007. Accordingly, amounts absorbed under LAF reverse repos since March 5, 2007 onwards are not comparable with previous data (Table 26 and Chart 14).
Although the Centre’s cash balance declined further from mid-April 2007 onwards, liquidity conditions tightened; this could be partly attributed to the hikes of 25 basis points each in the CRR coming into effect from the fortnights beginning April 14, 2007 and April 28, 2007. The LAF window witnessed injection of liquidity during most part of April 16-May 27, 2007 with the daily net injection of liquidity averaging Rs.9,629 crore. Liquidity pressures eased from May 28,
Table 26: Reserve Bank's Liquidity Management Operations |
(Rupees crore) |
Item |
2006-07 |
|
2006-07 |
|
|
2007-08 |
|
|
(April- |
Q1 |
Q2 |
Q3 |
Q4 |
April |
May |
June |
|
March) |
|
|
|
|
|
|
|
1 |
2 |
3 |
4 |
5 |
6 |
7 |
8 |
9 |
A. |
Drivers of Liquidity (1 to 5) |
61,739 |
36,247 |
-16,896 |
-25,641 |
68,028 |
34,179 |
12,797 |
N.A. |
|
1. |
RBI’s net Purchases from |
|
|
|
|
|
|
|
|
|
|
Authorised Dealers |
1,18,994 |
21,545 |
0 |
22,461 |
74,988 |
8,835 |
5,779 |
N.A. |
|
2. |
Currency with the Public |
-70,352 |
-19,648 |
-1,270 |
-27,033 |
-22,400 |
-19,953 |
-1,007 |
8,498 |
|
3. |
Surplus Cash Balances of the |
|
|
|
|
|
|
|
|
|
|
Centre with the Reserve Bank* |
-1,164 |
40,207 |
-26,199 |
-30,761 |
15,590 |
49,992 |
0 |
0 |
|
4. |
WMA/Overdraft to the Centre |
0 |
0 |
0 |
0 |
0 |
980 |
6,773 |
7,406 |
|
5. |
Others (residual) |
14,260 |
-5,856 |
10,574 |
9,693 |
-150 |
-5,676 |
1,252 |
N.A. |
B. |
Management of Liquidity (6 to 9) |
-24,257 |
-39,003 |
32,026 |
31,625 |
-48,905 |
-39,879 |
-24,451 |
10,387 |
|
6. |
Liquidity Impact of LAF Repos |
36,435 |
-35,315 |
40,650 |
33,600 |
-2,500 |
-19,189 |
-5,306 |
4,205 |
|
7. |
Liquidity Impact of OMO (Net)@ |
720 |
545 |
145 |
25 |
5 |
10 |
0 |
0 |
|
8. |
Liquidity Impact of MSS |
-33,912 |
-4,233 |
-8,769 |
4,750 |
-25,660 |
-12,950 |
-11,395 |
6,182 |
|
9. |
First Round Liquidity Impact |
|
|
|
|
|
|
|
|
|
|
due to CRR change |
-27,500 |
0 |
0 |
-6,750 |
-20,750 |
-7,750 |
-7,750 |
0 |
C. |
Bank Reserves (A+B) # |
37,482 |
-2,756 |
15,130 |
5,984 |
19,123 |
-5,700 |
-11,654 |
15,047 |
N.A. : Not available.
(+) : Indicates injection of liquidity into the banking system.
(-) : Indicates absorption of liquidity from the banking system.
* : Excludes minimum cash balances with the Reserve Bank in case of surplus.
# : Includes vault cash with banks and adjusted for first round liquidity impact due to CRR change.
@ : Adjusted for Consolidated Sinking Funds (CSF) and including private placement.
Note : For end-March, data pertain to March 31; for all other months data pertain to last Friday. |
2007 onwards, reflecting increase in Government expenditure and net purchase of foreign exchange from authorised dealers by the Reserve Bank. The Centre’s WMA/overdraft rose from Rs.7,753 crore on May 25, 2007 to Rs.26,707 crore by June 1, 2007 before falling to Rs.8,248 crore by June 15, 2007. The cash balance of the Government again turned into deficit on June 29, 2007 reflecting the transfer of the Reserve Bank’s stake in the State Bank of India (SBI) to the Government. The LAF window turned into an absorption mode on May 28, 2007 and remained so up to July 24, 2007 (except during June 28-July 2, 2007 when liquidity was injected through repo operations to the tune of Rs.9,009 crore daily on an average). The amount of liquidity absorbed through the reverse repo operations remained limited to a maximum of Rs.3,000 crore in terms of the modified arrangements. Outstanding balances under the MSS rose from Rs.62,974 crore at end-March 2007 to Rs.85,027 core by July 20, 2007 reflecting the enhanced MSS programme that was put in place in March/April 2007 to restore LAF as a facility for equilibrating very short-term mismatches (Table 27). Towards this objective, a mix of Treasury Bills and dated securities for MSS issuances is used in a more flexible manner keeping in view the capital flows, the assessment of volatility and durability of capital flows.
Table 27: Liquidity Management |
(Rupees crore) |
Outstanding as on
last Friday of |
LAF |
MSS |
Centre's Surplus
with the RBI @ |
Total (2 to 4) |
1 |
2 |
3 |
4 |
5 |
2006 |
January |
-20,555 |
37,280 |
39,080 |
55,805 |
February |
-12,715 |
31,958 |
37,013 |
56,256 |
March* |
7,250 |
29,062 |
48,828 |
85,140 |
April |
47,805 |
24,276 |
5,611 |
77,692 |
May |
57,245 |
27,817 |
-1,203 |
83,859 |
June |
42,565 |
33,295 |
8,621 |
84,481 |
July |
44,155 |
38,995 |
8,770 |
91,920 |
August |
23,985 |
42,364 |
26,791 |
93,140 |
September |
1,915 |
42,064 |
34,821 |
78,800 |
October |
12,270 |
40,091 |
25,868 |
78,229 |
November |
15,995 |
37,917 |
31,305 |
85,217 |
December |
-31,685 |
37,314 |
65,582 |
71,211 |
2007 |
January |
-11,445 |
39,375 |
42,494 |
70,424 |
February |
6,940 |
42,807 |
53,115 |
1,02,862 |
March * |
-29,185 |
62,974 |
49,992 |
83,781 |
April |
-9,996 |
75,924 |
-980 |
64,948 |
May |
-4,690 |
87,319 |
-7,753 |
74,876 |
June |
-8,895 |
81,137 |
-15,159 |
57,083 |
July (as on 20 July) |
3,000 |
85,027 |
-30,058 |
57,969 |
@ : Excludes minimum cash balances with the Reserve Bank in case of surplus.
* : Data pertain to March 31.
Note :
1. Negative sign in column 2 indicates injection of liquidity through LAF repo.
2. Negative sign in column 4 indicates WMA/overdraft.
3. Beginning March 5, 2007, daily reverse repo absorptions under LAF have been restricted to a maximum of Rs.3,000 crore comprising Rs.2,000 crore in the First LAF and Rs.1,000 crore in the Second LAF. |
In the recent period, there have been sharp variations in domestic liquidity conditions and overnight interest rates on the back of large movements in Government cash balances and capital flows. Reduction in Government cash balances and increase in capital inflows lead to an increase in market liquidity and downward pressures on overnight interest rates and vice versa. As noted earlier, modified liquidity management arrangements were put in place effective March 5, 2007. An enhanced MSS programme along with a cap of Rs.3,000 crore on absorption of liquidity under LAF reverse repos was put in place to restore LAF as a facility for equilibrating very short-term mismatches. However, in view of relatively large build-up of Government cash balances, the call rate reached a high of 54 per cent by end-March 2007. More recently, reduction in Government cash balances and large capital inflows have led to a sharp reduction in the call rate to below one per cent.
|
 IST,
IST,


