Growth in monetary and liquidity aggregates remained strong during 2007-08 so far. Accretion to bank deposits remained buoyant, led by time deposits. Year- on-year (y-o-y) growth of broad money (M3) on October 12, 2007 was higher than that at end-March 2007, hovering above the indicative trajectory of 17.0-17.5 per cent for 2007-08 set out in the Annual Policy Statement (April 2007). Growth in bank credit moderated during 2007-08 so far from the strong pace of the preceding three years. Banks’ investments in SLR securities, as a proportion of their net demand and time liabilities (NDTL), were somewhat higher than the end-March level. Liquidity conditions during the second quarter of 2007-08 were influenced largely by movements in cash balances of the Governments and capital inflows. The Reserve Bank continued with the policy of according high priority to active management of liquidity and thereby modulated liquidity through issuances of securities under the market stabilisation scheme (MSS), operations under the liquidity adjustment facility (LAF) and changing the cash reserve ratio (CRR) as and when warranted.
Monetary Survey
For the purpose of monetary policy formulation, the Annual Policy Statement of April 2007 projected the rate of broad money (M3) growth at around 17.0-17.5 per cent for 2007-08 in consonance with the outlook on economic growth and inflation. Consistent with the projections of money supply, the growth in aggregate deposits in 2007-08 was placed at around Rs.4,90,000 crore, while that of non-food credit including investments in bonds/debentures/shares of public sector undertakings and private corporate sector and commercial paper (CP) was projected at 24.0-25.0 per cent. Growth in M3, year-on-year (y-o-y), was 21.8 per cent on October 12, 2007 as compared with 21.3 per cent at end-March 2007 and 18.9 per cent a year ago. Expansion in the residency-based new monetary aggregate (NM3) – which does not directly reckon non-resident foreign currency deposits such as FCNR(B) deposits – also accelerated to 21.5 per cent on October 12, 2007 from 19.5 per cent a year ago. Growth in liquidity aggregate, L1, at 20.3 per cent at end-September 2007, was also higher than 19.3 per cent a year ago (Table 19 and Chart 8).
Growth of currency with the public decelerated during 2007-08. Growth in demand deposits was lower than that at a year ago and also lower than that at end-March 2007. Consequently, growth in narrow money (M1), y-o-y, slowed down to 14.6 per cent on October 12, 2007 from 19.1 per cent a year ago and 16.8 per cent
Table 19: Monetary Indicators |
(Amount in Rupees crore) |
Item |
Outstanding as onOctober12, 2007 |
Variation (year-on-year) |
|
|
October 13, 2006 |
March 31,
2007 |
October 12,
2007 |
|
|
Absolute |
Percent |
Absolute |
Per cent |
Absolute |
Per cent |
1 |
2 |
3 |
4 |
5 |
6 |
7 |
8 |
I. |
Reserve Money* |
7,66,077 |
1,03,533 |
20.2 |
1,35,961 |
23.7 |
1,50,089 |
24.4 |
II. |
Narrow Money (M1) |
9,65,335 |
1,35,118 |
19.1 |
1,38,820 |
16.8 |
1,22,995 |
14.6 |
III. |
Broad Money (M3) |
35,82,288 |
4,66,603 |
18.9 |
5,80,733 |
21.3 |
6,41,464 |
21.8 |
|
a) |
Currency with the Public |
5,01,934 |
64,539 |
17.0 |
70,352 |
17.0 |
58,738 |
13.3 |
|
b) |
Aggregate Deposits |
30,75,386 |
4,01,717 |
19.2 |
5,09,754 |
22.1 |
5,83,198 |
23.4 |
|
|
i) |
Demand Deposits |
4,58,433 |
70,232 |
21.7 |
67,841 |
16.7 |
64,729 |
16.4 |
|
|
ii) |
Time Deposits |
26,16,953 |
3,31,485 |
18.8 |
4,41,913 |
23.2 |
5,18,469 |
24.7 |
|
|
|
of which: Non-Resident |
|
|
|
|
|
|
|
|
|
|
Foreign Currency Deposits |
60,702 |
-13,518 |
-17.3 |
7,833 |
13.2 |
-3,817 |
-5.9 |
IV. |
NM3 |
35,89,296 |
4,82,094 |
19.5 |
5,71,550 |
20.8 |
6,36,279 |
21.5 |
|
of which: Call Term Funding |
|
|
|
|
|
|
|
|
|
from Financial Institutions |
86,143 |
5,914 |
7.5 |
2,692 |
3.2 |
1,417 |
1.7 |
V. |
a) |
L1 |
36,99,875 |
4,98,517 |
19.3 |
5,83,181 |
20.5 |
6,23,759 |
20.3 |
|
|
of which: Postal Deposits |
1,16,886 |
13,775 |
14.2 |
11,631 |
11.2 |
5,863 |
5.3 |
|
b) |
L2 |
37,02,807 |
4,98,528 |
19.3 |
5,83,181 |
20.4 |
6,23,759 |
20.3 |
|
c) |
L3 |
37,28,871 |
5,02,412 |
19.3 |
5,85,404 |
20.3 |
6,24,245 |
20.1 |
VI. |
Major Sources of Broad Money |
|
|
|
|
|
|
|
|
a) |
Net Bank Credit to the Government (i+ii) |
8,46,054 |
39,879 |
5.2 |
71,582 |
9.3 |
35,336 |
4.4 |
|
|
i) |
Net Reserve Bank Credit to Government |
-1,36,711 |
14,109 |
– |
-2,384 |
-29.3 |
-1,39,487 |
– |
|
|
|
of which: to the Centre |
-1,36,812 |
13,928 |
– |
-3,024 |
-58.6 |
-1,39,378 |
– |
|
|
ii) |
Other Banks’ Credit to Government |
9,82,765 |
25,769 |
3.3 |
73,967 |
9.8 |
1,74,823 |
21.6 |
|
b) |
Bank Credit to Commercial Sector |
22,25,003 |
3,77,232 |
26.0 |
4,30,358 |
25.4 |
3,94,626 |
21.6 |
|
c) |
Net Foreign Exchange Assets |
10,39,928 |
1,21,983 |
18.1 |
1,86,985 |
25.7 |
2,43,963 |
30.6 |
|
d) |
Government Currency Liability to Public |
8,694 |
-753 |
-8.6 |
-467 |
-5.3 |
705 |
8.8 |
|
e) |
Net Non-Monetary Liabilities of the |
|
|
|
|
|
|
|
|
|
Banking Sector |
5,37,392 |
71,737 |
16.6 |
1,07,725 |
23.2 |
33,165 |
6.6 |
|
Memo: |
|
Aggregate Deposits of SCBs |
28,58,033 |
3,88,528 |
20.4 |
4,99,260 |
23.7 |
5,69,061 |
24.9 |
|
Non-food Credit of SCBs |
19,82,156 |
3,70,226 |
30.0 |
4,16,006 |
28.4 |
3,77,759 |
23.5 |
* : Data pertain to October 19, 2007.
SCBs : Scheduled Commercial Banks. FIs : Financial Institutions. NBFCs : Non-Banking Financial Companies.
NM3 is the residency-based broad money aggregate and L1, L2 and L3 are liquidity aggregates compiled on
the recommendations of the Working Group on Money Supply (Chairman: Dr. Y.V. Reddy, 1998).
L1= NM3 + Select deposits with the post office saving banks.
L2 = L1 +Term deposits with term lending institutions and refinancing institutions (FIs) + Term borrowing by
FIs + Certificates of deposit issued by FIs.
L3 = L2 + Public deposits of non-banking financial companies.
Note :
1. Data are provisional.
2. Data reflect redemption of India Millennium Deposits (IMDs) on December 29, 2005.
3. Data for postal deposits pertain to August 2007, while liquidity aggregates pertain to September 2007. |
at end-March 2007. On the other hand, growth in time deposits accelerated from 18.8 per cent on October 13, 2006 to 23.2 per cent at end-March 2007 and further to 24.7 per cent on October 12, 2007. Concomitantly, the accretion to postal deposits decelerated significantly during the year (Chart 9). The higher order of increase in time deposits can be attributed, inter alia, to higher economic activity, increase in interest rates on bank deposits, unchanged interest rates on postal deposits and extension of tax benefits under Section 80C for bank deposits. 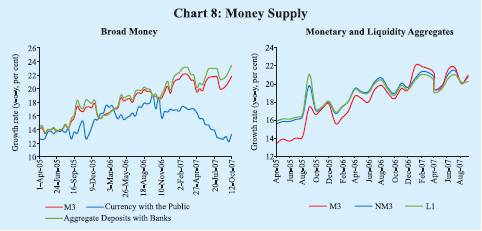
On a financial year basis, growth in M3 during 2007-08 (up to October 12, 2007) was 8.2 per cent as compared with 7.7 per cent during the comparable period of the previous year (Table 20). Bank credit to the commercial sector exhibited some moderation during 2007-08 so far from the strong pace of the previous three years. Scheduled commercial banks’ (SCBs’) non-food credit expanded by 23.5 per cent, y-o-y, as on October 12, 2007 as compared with 28.4 per cent at end-March 2007 and 30.0 per cent a year ago1. The deceleration in credit growth coupled with the
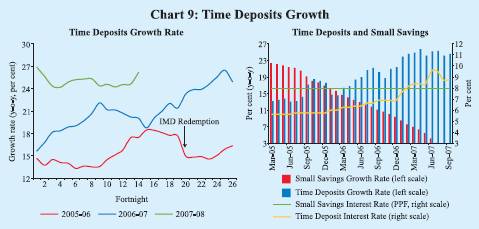
Table 20: Monetary Aggregates – Variations |
(Rupees crore) |
Item |
2006-07 |
2007-08 |
2006-07 |
2007-08 |
|
(up to |
(up to |
|
|
|
|
|
|
|
Oct. 13) |
Oct. 12) |
Q1 |
Q2 |
Q3 |
Q4 |
Q1 |
Q2 |
1 |
2 |
3 |
4 |
5 |
6 |
7 |
8 |
9 |
M3 (1+2+3 = 4+5+6+7-8) |
2,11,279 |
2,72,010 |
55,411 |
1,68,401 |
62,951 |
2,93,970 |
76,194 |
1,87,954 |
|
(7.7) |
(8.2) |
|
|
|
|
|
|
Components |
|
|
|
|
|
|
|
|
1. |
Currency with the Public |
30,077 |
18,464 |
23,797 |
-2,878 |
27,587 |
21,847 |
17,526 |
-13,937 |
|
(7.3) |
(3.8) |
|
|
|
|
|
|
2. |
Aggregates Deposits with Banks |
1,82,630 |
2,56,075 |
33,227 |
1,70,827 |
35,866 |
2,69,833 |
59,104 |
2,03,387 |
|
(7.9) |
(9.1) |
|
|
|
|
|
|
|
2.1 |
Demand Deposits with Banks |
-12,684 |
-15,796 |
-42,399 |
43,794 |
-8,252 |
74,697 |
-42,542 |
52,573 |
|
(-3.1) |
(-3.3) |
|
|
|
|
|
|
|
2.2 |
Time Deposits with Banks |
1,95,315 |
2,71,870 |
75,626 |
1,27,033 |
44,118 |
1,95,136 |
1,01,646 |
1,50,814 |
|
(10.3) |
(11.6) |
|
|
|
|
|
|
3. |
‘Other’ Deposits with Banks |
-1,429 |
-2,528 |
-1,613 |
452 |
-502 |
2,291 |
-435 |
-1,496 |
Sources |
|
|
|
|
|
|
|
|
4. |
Net |
Bank Credit to Government |
44,124 |
7,877 |
23,431 |
14,175 |
-13,204 |
47,180 |
24,833 |
9,669 |
|
(5.8) |
(0.9) |
|
|
|
|
|
|
|
4.1 |
RBI’s Net Credit to Government |
-5,361 |
-1,42,463 |
53 |
2,826 |
-12,754 |
7,490 |
-25,483 |
-54,695 |
|
|
4.1.1 RBI’s Net credit to Centre |
-2,593 |
-1,38,948 |
3,071 |
2,584 |
-12,568 |
3,889 |
-21,825 |
-55,588 |
|
4.2 |
Other Banks’ Credit to Government 49,484 |
1,50,340 |
23,378 |
11,349 |
-451 |
39,690 |
50,315 |
64,364 |
5. |
Bank Credit to Commercial Sector |
1,37,374 |
1,01,642 |
14,930 |
1,44,204 |
78,099 |
1,93,125 |
-31,873 |
1,40,392 |
|
(8.1) |
(4.8) |
|
|
|
|
|
|
6. |
NFEA of Banking Sector |
69,771 |
1,26,749 |
58,087 |
20,197 |
43,160 |
65,542 |
-17,945 |
1,19,430 |
|
6.1 |
NFEA of RBI |
74,726 |
1,41,949 |
71,845 |
11,392 |
27,250 |
82,682 |
-2,745 |
1,19,430 |
7. |
Government’s Currency Liabilities |
|
|
|
|
|
|
|
|
|
to the Public |
-766 |
407 |
-920 |
155 |
166 |
132 |
244 |
164 |
8. |
Net Non-Monetary liabilities of the |
|
|
|
|
|
|
|
|
|
Banking Sector |
39,225 |
-35,335 |
40,117 |
10,330 |
45,269 |
12,009 |
-1,00,937 |
81,700 |
Memo: |
1. |
Non-resident Foreign Currency |
|
|
|
|
|
|
|
|
|
Deposits with SCBs |
5,243 |
-6,407 |
3,917 |
1,671 |
1,233 |
1,011 |
-3,849 |
-2,110 |
2. |
SCB’ Call-term Borrowing from |
|
|
|
|
|
|
|
|
|
Financial Institutions |
1,582 |
307 |
3,118 |
-1,576 |
-4,468 |
5,618 |
-2,984 |
5,609 |
3. |
Overseas Borrowing by SCBs |
431 |
-112 |
3,301 |
-3,685 |
-2,774 |
5,229 |
-6,928 |
7,443 |
SCBs : Scheduled Commercial Banks.
NFEA : Net Foreign Exchange Assets.
Note : Figures in parentheses are percentage variations. |
acceleration in deposits growth led to a reduction in the incremental credit-deposit ratio (y-o-y) of SCBs to 67.0 per cent as on October 12, 2007 from 94.3 per cent a year ago and 110.0 per cent at end-March 2006 (Chart 10).
Disaggregated sectoral data available up to August 17, 2007 show that about 41 per cent of incremental non-food credit (y-o-y) was absorbed by industry, compared to 33 per cent in the corresponding period of the previous year. The expansion of incremental non-food credit to industry during this period was led by infrastructure (power, port, telecommunication), textiles, iron and steel, engineering, petroleum, food processing, chemicals, vehicles and construction 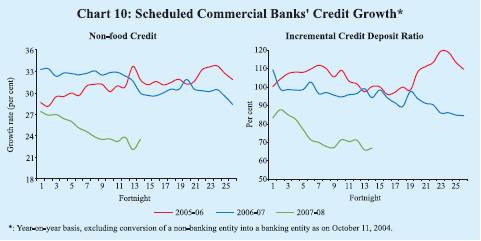
industries. The infrastructure sector alone accounted for around 27 per cent of the incremental credit to the industry as compared with 21 per cent in the corresponding period of the previous year. The agricultural sector absorbed around 13 per cent of the incremental non-food gross bank credit expansion. Personal loans accounted for nearly 22 per cent of the incremental non-food credit; within personal loans, the share of incremental housing loans stood at 44 per cent. Growth in loans to commercial real estate remained high (Table 21).
Apart from bank credit, the corporate sector continued to fund their requirements through non-bank sources such as from capital markets, external commercial borrowings (ECBs) and internal funds. Resources raised through domestic equity issuances during second quarter of 2007-08 were higher than that during the corresponding period of the previous year. Resources raised from international markets through American depository receipts (ADRs) and global depository receipts (GDRs) during the second quarter of 2007-08 were also significantly higher than that during the corresponding period of the previous year. Net mobilisation under ECBs almost doubled during 2006-07 (April-March) and the data for the first quarter of 2007-08 show that the momentum is maintained. Internal generation of funds continued to provide a strong support to the funding requirements as profits after tax of select non-financial non-government companies during the first quarter of 2007-08 were more than 30 per cent higher than the corresponding period of the previous year (Table 22).
Commercial banks have mobilised large amounts of deposits during 2007-08 so far. Issuances of fresh capital and internal generation of funds by banks were also higher than a year ago. Strong expansion in the sources of funds along with the moderation in credit growth enabled banks to deploy their funds in
Table 21: Deployment of Non-food Gross Bank Credit |
(Amount in Rupees crore) |
Sector/Industry |
Outstanding as
on August17, 2007 |
Year-on-Year Variation |
|
|
August 18, 2006 |
August 17, 2007 |
|
|
Absolute |
Per cent |
Absolute |
Per cent |
1 |
2 |
3 |
4 |
5 |
6 |
Non-food Gross Bank Credit (1 to 4) |
18,09,338 |
3,48,501 |
34.8 |
3,41,920 |
23.3 |
1. Agriculture and Allied Activities |
2,20,534 |
44,630 |
35.0 |
43,326 |
24.4 |
2. Industry (Small, Medium and Large) |
7,10,984 |
1,13,606 |
29.0 |
1,40,531 |
24.6 |
Small Scale Industries |
1,19,379 |
15,926 |
21.6 |
28,510 |
31.4 |
3. Personal Loans |
4,64,057 |
– |
– |
76,649 |
19.8 |
Housing |
2,35,168 |
– |
– |
33,489 |
16.6 |
Advances against Fixed Deposits |
40,272 |
7,238 |
28.1 |
7,071 |
21.3 |
Credit Cards |
15,220 |
– |
– |
4,786 |
45.9 |
Education |
16,926 |
– |
– |
5,145 |
43.7 |
Consumer Durables |
8,515 |
630 |
8.3 |
334 |
4.1 |
4. Services |
4,13,763 |
– |
– |
81,416 |
24.5 |
Transport Operators |
27,655 |
– |
– |
8,117 |
41.5 |
Professional & Other Services |
25,619 |
– |
– |
9,131 |
55.4 |
Trade |
1,04,932 |
– |
– |
19,563 |
22.9 |
Real Estate Loans |
46,665 |
13,262 |
80.1 |
16,145 |
52.9 |
Non-Banking Financial Companies |
45,326 |
9,656 |
49.6 |
13,673 |
43.2 |
Memo: |
Priority Sector |
6,31,221 |
1,23,756 |
32.4 |
1,06,015 |
20.2 |
Industry (Small, Medium and Large) |
7,10,984 |
1,13,606 |
29.0 |
1,40,531 |
24.6 |
Food Processing |
39,524 |
5,887 |
26.8 |
8,391 |
27.0 |
Textiles |
79,362 |
16,117 |
39.1 |
17,378 |
28.0 |
Paper & Paper Products |
11,499 |
1,666 |
24.6 |
1,813 |
18.7 |
Petroleum, Coal Products & Nuclear Fuels |
33,252 |
5,563 |
34.2 |
8,752 |
35.7 |
Chemical and Chemical Products |
55,360 |
8,750 |
28.5 |
7,672 |
16.1 |
Rubber, Plastic & their Products |
9,247 |
2,668 |
64.4 |
1,913 |
26.1 |
Iron and Steel |
65,643 |
15,040 |
45.4 |
11,335 |
20.9 |
Other Metal & Metal Products |
20,423 |
4,801 |
44.0 |
2,756 |
15.6 |
Engineering |
45,179 |
5,615 |
20.3 |
8,759 |
24.0 |
Vehicles, Vehicle Parts and Transport Equipments |
24,923 |
5,163 |
52.8 |
5,532 |
28.5 |
Gems & Jewellery |
23,417 |
5,516 |
41.0 |
1,657 |
7.6 |
Construction |
19,877 |
4,302 |
45.7 |
5,237 |
35.8 |
Infrastructure |
1,54,300 |
24,222 |
29.4 |
37,509 |
32.1 |
– : Not available.
Note :
1. Data are provisional and relate to select scheduled commercial banks.
2. Owing to change in classification of sectors/industries and coverage of banks, data for 2006 are not
comparable with earlier data. |
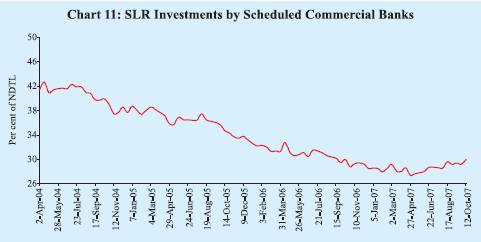
Government and other approved securities, which increased by 22.9 per cent, y-o-y, on October 12, 2007 as compared with 3.2 per cent a year ago (Table 23). Commercial bank’s holdings of such securities as on October 12, 2007, at 30.0 per cent of their NDTL were the same as that of a year ago and somewhat higher than 28.0 per cent at end-March 2007 (Chart 11). Excess SLR investments of SCBs, which increased to Rs.1,56,851 crore on October 12, 2007 from Rs.1,27,842 crore a year ago and Rs.84,223 crore at end-March 2007. Banks’ balances with the Reserve Bank expanded, reflecting the impact of the increase in their NDTL as well as the increase in the CRR. Banks’ holdings of foreign currency assets declined, while their overseas borrowings expanded.
Table 22: Select Sources of Funds to Industry |
(Rupees crore) |
Item |
2005-06 |
2006-07 |
2006-07 |
2007-08 |
|
|
|
Q1 |
Q2 |
Q3 |
Q4 |
Q1 |
Q2 |
1 |
2 |
3 |
4 |
5 |
6 |
7 |
8 |
9 |
A. |
Bank Credit to Industry # |
1,26,804 |
1,41,543 |
-2,336 |
49,290 |
28,415 |
66,174 |
-15,603 |
29,253* |
B. |
Flow from Non-banks to Corporates |
|
|
|
|
|
|
|
|
|
1. |
Capital Issues (i+ii) |
13,781 |
29,180 |
10,627 |
1,882 |
10,840 |
5,831 |
13,788 |
6,228 |
|
|
i) Non-Government Public Ltd. |
|
|
|
|
|
|
|
|
|
|
Companies (a+b) |
13,408 |
29,180 |
10,627 |
1,882 |
10,840 |
5,831 |
13,261 |
4,238 |
|
|
a) Bonds/Debentures |
245 |
585 |
0 |
0 |
491 |
94 |
0 |
0 |
|
|
b) Shares |
13,163 |
28,595 |
10,627 |
1,882 |
10,349 |
5,737 |
13,261 |
4,238 |
|
|
ii) PSUs and Government Companies |
373 |
0 |
0 |
0 |
0 |
0 |
527 |
1,990 |
|
2. |
ADR/GDR Issues |
7,263 |
16,184 |
4,965 |
2,130 |
924 |
8,165 |
1,251 |
9,899 |
|
3. |
External Commercial Borrowings (ECBs) |
45,078 |
88,472 |
20,498 |
14,232 |
16,077 |
37,665 |
33,115 |
– |
|
4. |
Issue of CPs |
-1,517 |
4,970 |
6,931 |
4,795 |
-908 |
-5,848 |
8,568 |
6,971^ |
C. |
Depreciation Provision + |
28,883 |
37,095 |
8,449 |
8,892 |
9,172 |
10,338 |
10,173 |
– |
D. |
Profit after Tax + |
67,506 |
1,11,107 |
24,845 |
27,710 |
28,698 |
31,251 |
32,699 |
– |
– : Not Available. ^ : Up to September 15, 2007.
* : Up to August 17, 2007.
# : Data pertain to select scheduled commercial banks. Figures for 2005-06 are not comparable with
those for the later period due to increase in number of banks selected in the sample.
+ : Data are based on abridged results of select non-financial non-Government companies.
Data for the full year may not add up to the quarterly totals due to difference in the composition and number of
companies covered in each period (see Chapter 1).
Note :
1. Data are provisional.
2. Data on capital issues pertain to gross issuances excluding issues by banks and financial institutions.
Figures are not adjusted for banks’ investments in capital issues, which are not expected to be significant.
3. Data on ADR/GDR issues exclude issuances by banks and financial institutions.
4. Data on external commercial borrowings include short-term credit. Data for 2005-06 are exclusive of the IMD redemption. |
Table 23: Scheduled Commercial Bank Survey |
(Amount in Rupees crore) |
Item |
Outstanding
|
Variation (year-on-year) |
|
as on
Oct.12, 2007 |
As on
Oct. 13, 2006 |
As on
Oct. 12, 2007 |
|
|
Amount |
Per cent |
Amount |
Per cent |
1 |
2 |
3 |
4 |
5 |
6 |
Sources of Funds |
|
|
|
|
|
1. |
Aggregate Deposits |
28,58,033 |
3,88,528 |
20.4 |
5,69,061 |
24.9 |
2. |
Call/Term Funding from Financial Institutions |
86,143 |
5,914 |
7.5 |
1,417 |
1.7 |
3. |
Overseas Foreign Currency Borrowings |
31,793 |
-2,097 |
-6.5 |
1,528 |
5.0 |
4. |
Capital |
36,392 |
2,049 |
6.9 |
4,845 |
15.4 |
5. |
Reserves |
2,14,549 |
33,184 |
25.2 |
49,511 |
30.0 |
Uses of Funds |
|
|
|
|
|
1. |
Bank Credit |
20,19,175 |
3,66,463 |
28.8 |
3,81,334 |
23.3 |
|
of which: Non-food Credit |
19,82,156 |
3,70,226 |
30.0 |
3,77,759 |
23.5 |
2. |
Investments in Government and Other Approved Securities |
9,42,920 |
23,508 |
3.2 |
1,75,748 |
22.9 |
|
a) Investments in Government Securities |
9,23,532 |
25,608 |
3.5 |
1,73,765 |
23.2 |
|
b) Investments in Other Approved Securities |
19,388 |
-2,100 |
-10.8 |
1,983 |
11.4 |
3. |
Investments in Non-SLR Securities |
1,78,920 |
10,850 |
7.8 |
28,935 |
19.3 |
4. |
Foreign Currency Assets |
29,669 |
13,803 |
51.7 |
-10,852 |
-26.8 |
5. |
Balances with the RBI |
2,18,684 |
11,151 |
9.8 |
93,605 |
74.8 |
Note: Data are provisional. |
Reserve Money Survey
Reserve money expanded by 24.4 per cent, y-o-y, as on October 19, 2007 (14.9 per cent adjusted for the first round effects of the hikes in the CRR2) as compared with 20.2 per cent a year ago (Chart 12).
During the financial year 2007-08 (up to October 19, 2007), reserve money expanded by 8.0 per cent (3.7 per cent adjusted for the first round effect of the hikes in the CRR) as compared with 7.5 per cent in the corresponding period of 2006-07. Growth in bankers’ deposits with the Reserve Bank increased by 18.7 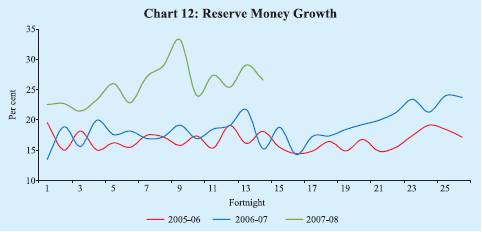
Table 24: Reserve Money |
(Amount in Rupees crore) |
Item |
2006-07 |
2006-07 |
2007-08 |
Variation |
|
(April |
(Up to |
(Up to |
2006-07 |
2007-08 |
|
March) |
Oct. 20) |
Oct. 19) |
Q1 |
Q2 |
Q3 |
Q4 |
Q1 |
Q2 |
1 |
2 |
3 |
4 |
5 |
6 |
7 |
8 |
9 |
10 |
Reserve Money |
1,35,961 |
42,932 |
57,060 |
13,466 |
18,665 |
14,204 |
89,626 |
11,708 |
60,480 |
|
(23.7) |
(7.5) |
(8.0) |
|
|
|
|
|
|
Components (1+2+3) |
|
|
|
|
|
|
|
|
|
1. |
Currency in Circulation |
73,549 |
37,319 |
22,589 |
22,283 |
-2,011 |
26,871 |
26,405 |
16,943 |
-13,487 |
|
(17.1) |
(8.7) |
(4.5) |
|
|
|
|
|
|
2. |
Bankers’ Deposits with RBI |
61,784 |
7,047 |
36,984 |
-7,204 |
20,224 |
-12,165 |
60,929 |
-4,800 |
75,464 |
|
(45.6) |
(5.2) |
(18.7) |
|
|
|
|
|
|
3. |
‘Other’ Deposits with the RBI |
628 |
-1,434 |
-2,513 |
-1,613 |
452 |
-502 |
2,291 |
-435 |
-1,496 |
|
(9.1) |
(-20.9) |
(-33.5) |
|
|
|
|
|
|
Sources (1+2+3+4-5) |
|
|
|
|
|
|
|
|
|
1. |
RBI’s net credit to Government |
-2,384 |
11,988 |
-1,46,754 |
53 |
2,826 |
-12,754 |
7,490 |
-25,483 |
-54,695 |
|
of which: to Centre (i+ii+iii+iv-v) |
-3,024 |
15,029 |
-1,43,116 |
3,071 |
2,584 |
-12,568 |
3,889 |
-21,825 |
-55,588 |
|
i. Loans and Advances |
0 |
0 |
0 |
0 |
0 |
0 |
0 |
0 |
0 |
|
ii. Treasury Bills held by the RBI |
0 |
0 |
0 |
0 |
0 |
0 |
0 |
0 |
0 |
|
iii. RBI’s Holdings of Dated Securities |
26,763 |
491 |
-51,024 |
-27,610 |
24,944 |
22,733 |
6,696 |
-34,284 |
4,019 |
|
iv. RBI’s Holdings of Rupee coins |
-143 |
-132 |
96 |
9 |
-107 |
97 |
-142 |
128 |
20 |
|
v. Central Government Deposits |
29,644 |
-14,670 |
92,189 |
-30,672 |
22,253 |
35,398 |
2,665 |
-12,330 |
59,627 |
2. |
RBI’s credit to banks and |
|
|
|
|
|
|
|
|
|
|
commercial sector |
1,990 |
-377 |
-7,770 |
-3,135 |
3,107 |
2,065 |
-47 |
-6,450 |
-1,256 |
3. |
NFEA of RBI |
1,93,170 |
77,310 |
1,71,080 |
71,845 |
11,392 |
27,250 |
82,682 |
-2,745 |
1,19,430 |
|
|
(28.7) |
(11.5) |
(19.8) |
|
|
|
|
|
|
|
of which : |
|
|
|
|
|
|
|
|
|
|
FCA, adjusted for revaluation |
1,64,601 |
42,544 |
2,17,201 |
28,107 |
10,948 |
31,634 |
93,913 |
47,728 |
1,18,074 |
4. |
Governments’ Currency Liabilities |
|
|
|
|
|
|
|
|
|
|
to the Public |
-467 |
-766 |
407 |
-920 |
155 |
166 |
132 |
244 |
164 |
5. |
Net Non-Monetary liabilities of RBI |
56,347 |
45,224 |
-40,098 |
54,376 |
-1,184 |
2,524 |
632 |
-46,142 |
3,162 |
Memo: |
LAF, Repos (+) / Reverse Repos (-) |
36,435 |
8,730 |
-61,135 |
-23,060 |
28,395 |
22,195 |
8,905 |
-32,182 |
9,067 |
Net Open Market Sales # * |
5,125 |
2,945 |
3,338 |
1,536 |
1,176 |
389 |
2,024 |
1,246 |
1,560 |
Centre’s Surplus ** |
1,164 |
-19,117 |
-28,071 |
-27,320 |
13,313 |
38,713 |
-23,542 |
-34,597 |
15,376 |
Mobilisation under MSS |
33,912 |
11,860 |
1,02,241 |
4,062 |
8,940 |
-3,315 |
24,225 |
19,643 |
48,856 |
Net Purchases(+)/Sales(-) from |
|
|
|
|
|
|
|
|
|
Authorised Dealers |
1,18,994 |
21,545 |
93,268 + |
21,545 |
0 |
19,776 |
77,673 |
38,873 |
54,395 + |
NFEA/Reserve Money @ |
122.2 |
121.8 |
135.4 |
127.0 |
125.0 |
126.5 |
122.2 |
119.8 |
125.8 |
NFEA/Currency @ |
171.8 |
160.3 |
196.9 |
164.4 |
167.7 |
164.0 |
171.8 |
165.7 |
193.6 |
NFEA : Net Foreign Exchange Assets. FCA : Foreign Currency Assets. LAF : Liquidity Adjustment Facility.
* : At face value. + : Up to August 31, 2007. # : Excludes Treasury Bills. @ : per cent, end of period.
** : Excludes minimum cash balances with the Reserve Bank in case of surplus.
Note :
1. Data are based on March 31 for Q4 and last reporting Friday for all other quarters.
2. Figures in parentheses are percentage variations during the fiscal year. |
per cent during 2007-08 (up to October 19, 2007) as compared with an increase of 5.2 per cent during the corresponding period of 2006-07. Currency in circulation expanded by 4.5 per cent as compared with 8.7 per cent during the corresponding period of the previous year (Table 24).
On the sources side, reserve money continued to be driven by the Reserve Bank’s foreign currency assets (adjusted for revaluation), which rose by Rs.2,17,201 crore in 2007-08 (up to October 19, 2007) as compared with Rs.42,544 crore during the corresponding period of the previous year (Chart 13). 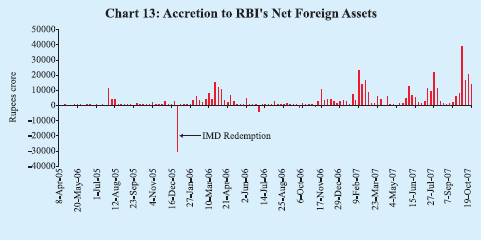
Movements in the Reserve Bank’s net credit to the Central Government largely reflected liquidity management operations by the Reserve Bank and movements in Government deposits. During 2007-08 (up to October 19, 2007), the Reserve Bank’s holdings of Central Government’s dated securities declined largely on account of increased absorption of liquidity under the LAF reverse repo. On the other hand, the sterilisation operations of the Reserve Bank under the MSS led to an increase in Central Government deposits with the Reserve Bank. Reflecting these developments, the Reserve Bank’s net credit to the Centre declined by Rs.1,43,116 crore during 2007-08 (up to October 19) as against an increase of Rs.15,029 crore during the corresponding period of the previous year.
Liquidity Management
The Reserve Bank continued with its policy of active management of liquidity flexibly using various policy instruments at its disposal such as CRR, LAF and MSS. In the second quarter of 2007-08, variation in Government balances and capital inflows remained the key drivers of liquidity conditions. The Reserve Bank withdrew the ceiling of Rs.3,000 crore on daily reverse repo under LAF effective from August 6, 2007, while retaining the discretion to re-impose a ceiling as appropriate. The second LAF, which was introduced from November 2005 and had been conducted between 3:00 pm and 3:45 pm on a daily basis, was also withdrawn with effect from August 6, 2007. The Government, in consultation with the Reserve Bank, revised the ceiling for the outstanding under the MSS for the year 2007-08 to Rs.1,50,000 crore on August 8, 2007 from Rs.1,10,000 crore with Rs.1,35,000 crore set as the threshold of future revision of the ceiling. In view of the continuing large capital flows, the ceiling for the outstanding under 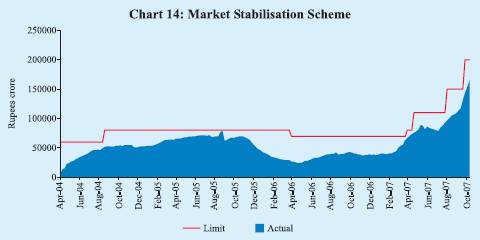
the MSS for the year 2007-08 was further increased to Rs.2,00,000 crore on October 4, 2007, with the threshold limit for revision set at Rs.1,85,000 crore (Chart 14). This was in consonance with the modified arrangement of the Reserve Bank’s liquidity management to enhance the MSS programme and to use it more flexibly keeping in view the capital flows in the recent periods, the assessment of volatility and durability of the flows, and to restore LAF as a facility for equilibrating very short-term mismatches.
During the first quarter of 2007-08, liquidity pressures eased gradually from April 4, 2007 onwards partly on account of reduction in the Centre’s cash balances from Rs.50,092 crore at end-March 2007 to Rs.32,023 crore by mid-April 2007. Consequently, the amount injected through LAF repos declined and liquidity was absorbed under the LAF reverse repos during April 9-15, 2007. The absorption under reverse repos, however, remained limited within the ceiling of Rs.3,000 crore as per the modified arrangements put in place on March 5, 2007. From mid-April 2007 onwards, liquidity conditions tightened, partly due to the hikes of 25 basis points each in the CRR effective from the fortnights beginning April 14, 2007 and April 28, 2007, leading to daily net injection of liquidity averaging Rs.9,629 crore during April 16-May 27, 2007. Liquidity pressures again started easing from May 28, 2007 onwards, reflecting increase in Government expenditure and the Reserve Bank’s operations in the foreign exchange market. The LAF window shifted to an absorption mode from May 28, 2007 and remained so throughout the quarter except during June 28-July 2, 2007, when liquidity was injected through net repo operations to the tune of Rs.9,009 crore daily on an average (Chart 15). Outstanding balances under the MSS rose from Rs.62,974 crore at end-March 2007 to Rs.81,137 core by June 29, 2007 (Table 25). 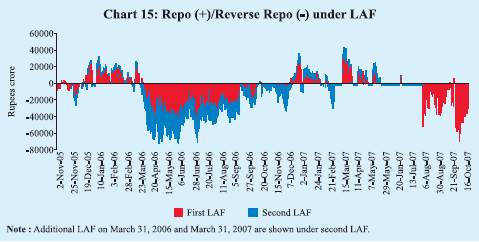
During the second quarter of 2007-08, the Reserve Bank continued to absorb liquidity using the reverse repo window under the LAF. The sustained capital inflows and the decline in Government balances were reflected in the large
Table 25: Reserve Bank's Liquidity Management Operations |
(Rupees crore) |
Item |
Variations |
|
2006-07
(April-March) |
2006-07 |
2007-08 |
|
|
Q1 |
Q2 |
Q3 |
Q4 |
Q1 |
July |
August |
September |
1 |
2 |
3 |
4 |
5 |
6 |
7 |
8 |
9 |
10 |
A. Drivers of Liquidity (1+2+3+4+5) |
61,739 |
36,247 |
-16,896 |
-25,641 |
68,028 |
51,935 |
51,012 |
22,854 |
– |
1. |
RBI’s net Purchases from |
|
|
|
|
|
|
|
|
|
|
Authorised Dealers |
1,18,994 |
21,545 |
0 |
22,461 |
74,988 |
39,791 |
41,562 |
11,915 |
– |
2. |
Currency with the Public |
-70,352 |
-19,648 |
-1,270 |
-27,033 |
-22,400 |
-12,235 |
4,954 |
3,836 |
-144 |
3. |
Surplus Cash balances of the |
|
|
|
|
|
|
|
|
|
|
Centre with the Reserve Bank@ |
-1,164 |
40,207 |
-26,199 |
-30,761 |
15,590 |
49,992 |
0 |
-20,807 |
-9,964 |
4. WMA and OD |
0 |
0 |
0 |
0 |
0 |
15,159 |
5,040 |
-20,199 |
0 |
5.Others (residual) |
14,260 |
-5,856 |
10,574 |
9,693 |
-150 |
-40,772 |
-544 |
48,109 |
– |
B. Management of Liquidity |
|
|
|
|
|
|
|
|
|
(6+7+8+9) |
-24,257 |
-39,003 |
32,026 |
31,625 |
-48,905 |
-53,943 |
-18,735 |
-47,787 |
-2,099 |
6. |
Liquidity impact of LAF Repos |
36,435 |
-35,315 |
40,650 |
33,600 |
-2,500 |
-20,290 |
-11,887 |
-13,863 |
22,925 |
7. |
Liquidity impact of OMO (Net) * |
720 |
545 |
145 |
25 |
5 |
10 |
25 |
0 |
15 |
8. |
Liquidity impact of MSS |
-33,912 |
-4,233 |
-8,769 |
4,750 |
-25,660 |
-18,163 |
-6,873 |
-18,424 |
-25,039 |
9. |
First round liquidity impact |
|
|
|
|
|
|
|
|
|
|
due to CRR change |
-27,500 |
0 |
0 |
-6,750 |
-20,750 |
-15,500 |
0 |
-15,500 |
0 |
C. Bank Reserves (A+B) # |
37,482 |
-2,756 |
15,130 |
5,984 |
19,123 |
-2,008 |
32,277 |
-24,933 |
34,195 |
– : Not Available.
(+) : Indicates injection of liquidity into the banking system.
(-) : Indicates absorption of liquidity from the banking system.
# : Includes vault cash with banks and adjusted for first round liquidity impact due to CRR change.
* : Adjusted for Consolidated Sinking Funds (CSF) and including private placement.
@ : Excludes minimum cash balances with the Reserve Bank in case of surplus.
Note : For end-March, data pertain to March 31; for all other months data pertain to last Friday. |
absorption of liquidity of Rs.52,070 crore on August 6, 2007 through reverse repo after the withdrawal of the ceiling for reverse repo3. The large reverse repo absorption declined gradually with the increase in Government cash balances from the second week of August and the impact of increase in CRR by 50 basis points to 7.0 per cent effective the fortnight beginning August 4, 2007. The amount of liquidity impounded due to the first round impact of the hike of the CRR was Rs.15,500 crore. Liquidity was further absorbed following the auction of dated securities and through MSS operations in August 2007. The outstanding amount of MSS reached Rs.1,06,434 crore on August 31, 2007 from Rs.92,954 crore on August 3, 2007 (Table 26).
Table 26: Liquidity Management |
(Rupees crore) |
Outstanding as on
last Friday of |
LAF |
MSS |
Centre's Surplus
with the RBI @ |
Total
(2 to 4) |
1 |
2 |
3 |
4 |
5 |
2006 |
|
|
|
|
January |
-20,555 |
37,280 |
39,080 |
55,805 |
February |
-12,715 |
31,958 |
37,013 |
56,256 |
March* |
7,250 |
29,062 |
48,828 |
85,140 |
April |
47,805 |
24,276 |
5,611 |
77,692 |
May |
57,245 |
27,817 |
-1,203 |
83,859 |
June |
42,565 |
33,295 |
8,621 |
84,481 |
July |
44,155 |
38,995 |
8,770 |
91,920 |
August |
23,985 |
42,364 |
26,791 |
93,140 |
September |
1,915 |
42,064 |
34,821 |
78,800 |
October |
12,270 |
40,091 |
25,868 |
78,229 |
November |
15,995 |
37,917 |
31,305 |
85,217 |
December |
-31,685 |
37,314 |
65,582 |
71,211 |
2007 |
|
|
|
|
January |
-11,445 |
39,375 |
42,494 |
70,424 |
February |
6,940 |
42,807 |
53,115 |
1,02,862 |
March* |
-29,185 |
62,974 |
49,992 |
83,781 |
April |
-9,996 |
75,924 |
-980 |
64,948 |
May |
-4,690 |
87,319 |
-7,753 |
74,876 |
June |
-8,895 |
81,137 |
-15,159 |
57,083 |
July |
2,992 |
88,010 |
-20,199 |
70,803 |
August |
16,855 |
1,06,434 |
20,807 |
1,44,096 |
September |
-6,070 |
1,31,473 |
30,771 |
1,56,174 |
October (as on Oct. 19) |
31,950 |
1,65,215 |
21,921 |
2,19,086 |
@ : Excludes minimum cash balances with the Reserve Bank in case of surplus.
* : Data pertain to March 31.
Note :
1. Negative sign in column 2 indicates injection of liquidity through LAF repo.
2. Negative sign in column 4 indicates injection of liquidity through WMA/overdraft.
3. Between March 5 and August 5, 2007, daily reverse repo absorptions were restricted to a
maximum of Rs.3,000 crore comprising Rs.2,000 crore in the First LAF and Rs.1,000 crore in the
Second LAF. |
The average daily absorption of liquidity under the LAF declined gradually from Rs.42,059 crore during August 6-9, 2007 to Rs.25,553 during August 10-August 17, 2007 and further to Rs.12,126 during August 21-27, 2007. The absorption of liquidity under the LAF increased again during August 28-September 13, 2007 mainly resulting from a decline in Government cash balances. Liquidity was further absorbed during August 27-September 10, 2007 through auction of dated securities (Rs.14,000 crore), which was reflected in the moderation of the amount absorbed under LAF in the second week of September. Advance tax outflows from the banking system to the Government in mid-September resulted in a decline in absorptions under LAF reverse repos. The Central Government’s cash balances with the Reserve Bank also increased to Rs.38,453 crore by September 19, 2007 from Rs.13,258 crore on September 14, 2007 and averaged Rs.38,202 crore during September 23-28, 2007. The Reserve Bank injected liquidity through repo operations on September 21, 2007 (Rs.1,200 crore), for the first time in this quarter, and subsequently once more on September 28, 2007 (Rs.6,070 crore). Towards end-September, however, liquidity conditions generally remained easy following large inflow of foreign capital and the Reserve Bank broadly continued with net absorption of liquidity except on those two occasions. During October 2007, reflecting some decline in Government surplus and large capital inflows, liquidity in the system eased further, leading to average daily absorption of Rs.43,077 crore under reverse repo during October 1-23, 2007.
1 The growth in adjusted non-food credit, that also includes investments in bonds/debentures/shares and commercial paper (CP), was 22.1 per cent, y-o-y, on October 12, 2007 as compared with 28.0 per cent a year ago. 2 The CRR was increased by 200 basis points in stages between December 2006 and August 2007. Such increase in CRR in the first round, is estimated to have impounded banks' resources of Rs.58,500 crore. 3 The ceiling of Rs.3,000 crore for reverse repo, which was prevalent effective March 5, 2007, was removed effective August 6, 2007.
|


