III. THE EXTERNAL ECONOMY
III.1 India’s balance of payments position during the first half of 2008-09 (April-September) reflected a widening of trade deficit resulting in large current account deficit, and moderation in capital flows. Merchandise trade deficit recorded a sharp increase during April-November 2008 on account of higher crude oil prices for most of the period and loss of momentum in exports since September 2008. Net surplus under invisibles remained buoyant, led by increase in software exports and private transfers. Net capital inflows reduced sharply and have remained volatile during 2008-09 so far. While foreign direct investment into India increased during April-November 2008, foreign portfolio investments showed substantial outflows. As on January 16, 2009, foreign exchange reserves at US $ 252.2 billion declined by US $ 57.5 billion over the level at end-March 2008 (including changes due to valuation losses).
International Developments
III.2 Global growth prospects have deteriorated significantly, aggravated by the financial crisis and the severe strains on banking systems and credit conditions worldwide. Financial sector deleveraging has continued and the frozen credit markets have raised the spectre of a major recession in the global economy. The impact is visible not only in the financial markets but also in the real economy across the globe. Significant falls in asset prices, the end of a housing construction boom in a number of countries and fall in consumer and business sentiment are weighing on economic activity. Further deceleration in GDP growth was witnessed across both the advanced as well as the emerging market economies (EMEs) in the third quarter of 2008. While a substantial deceleration was witnessed in all major advanced economies including the US, Euro area and the UK in the third quarter as compared with the second quarter, the growth in EMEs also showed some moderation (Table 15). Uncertainty surrounding the global economic outlook remains high mainly stemming from a scenario of ongoing financial market tensions affecting the real economy more adversely than previously anticipated. Since the official recognition of recession in the US, the UK, the Euro area and Japan, the downside risks to the global economy have increased. According to the IMF, world growth is projected to slow from 5.0 per cent in 2007 to 3.7 per cent in 2008 and further to 2.2 per cent in 2009, with the downturn led by advanced economies (Table 16).
III.3 According to the IMF, the US economy is projected to contract by 0.7 per cent in 2009 (as against an increase of 1.4 per cent in 2008) as households respond to depreciating real and financial assets and tightening financial conditions. Similarly, real GDP in the Euro area is also projected to decline by 0.5 per cent in 2009 (as against an increase of 1.2 per cent in 2008) due to tightening financial conditions and falling confidence. The Japanese GDP has already shown a contraction by 0.5 per cent in the third quarter of 2008 reflecting sluggish domestic demand and slowdown in exports. Real GDP in Japan is projected to record a
Table 15: Growth Rates – Global Scenario |
(Per cent) |
Region/Country |
2007 |
2008P |
2009P |
2008 |
|
|
|
|
Q1 |
Q2 |
Q3 |
1 |
2 |
3 |
4 |
5 |
6 |
7 |
Advanced Economies |
Euro area |
2.6 |
1.2 |
-0.5 |
2.1 |
1.4 |
0.6 |
Japan |
2.1 |
0.5 |
-0.2 |
1.4 |
0.7 |
-0.5 |
Korea |
5.0 |
4.1 |
3.5 |
5.8 |
4.8 |
3.8 |
UK |
3.0 |
0.8 |
-1.3 |
2.4 |
1.5 |
0.3 |
US |
2.0 |
1.4 |
-0.7 |
2.5 |
2.1 |
0.7 |
OECD Countries |
2.6 |
1.4 |
-0.4 |
2.6 |
1.9 |
0.8 |
Emerging Economies |
Argentina |
8.7 |
6.5 |
3.6 |
8.3 |
7.6 |
6.2 |
Brazil |
5.4 |
5.2 |
3.0 |
6.1 |
6.2 |
6.8 |
China |
11.9 |
9.7 |
8.5 |
10.6 |
10.1 |
9.0 |
India |
9.0 |
7.8 |
6.3 |
8.8 |
7.9 |
7.6 |
Indonesia |
6.3 |
6.1 |
5.5 |
6.3 |
6.4 |
6.1 |
Malaysia |
6.3 |
5.8 |
4.8 |
7.4 |
6.7 |
4.7 |
Thailand |
4.8 |
4.7 |
4.5 |
6.0 |
5.3 |
4.0 |
P : IMF Projections.
Note : Data for India in column 2 pertains to fiscal year 2007-08.
Source : International Monetary Fund; The Economist; and the OECD. |
decline of 0.2 per cent in 2009 as the support to growth from net exports is expected to decline further. Financial conditions continue to present significant downside risks. Significant uncertainty still remains about the extent and duration of the economic downturn in affected economies stemming from the crisis.
III.4 The growth in the EMEs, which were earlier considered to be resilient to the global financial disruptions, is also projected to slow appreciably to 5.1 per cent in 2009. Among the most affected EMEs are commodity exporters, given that commodity price projections have been marked down substantially, and countries facing external financing and liquidity constraints. The IMF projects that developing Asia will grow by 7.1 per cent in 2009 (8.3 per cent in 2008). While China’s growth is projected to moderate from 9.7 per cent in 2008 to 8.5 per cent in 2009, growth for India is placed at 6.3 per cent for 2009 (7.8 per cent in 2008) by the IMF. Nevertheless, the economic outlook for the EMEs still remains relatively positive when compared to advanced economies, but uncertainties about their resilience to the global shocks have considerably increased. The impact of financial crisis is already in evidence in the currency and equity markets and the phase of capital outflows that have occurred from the EMEs. However, the macro impact on the EMEs including India has so far been contained by the strength of domestic demand.
III.5 Subsequent to the IMF’s forecast released in November 2008, forecasts released by other international organisations in December 2008, reflect further economic
Table 16: Select Economic Indicators – World |
Item |
2006 |
2007 |
2008P |
2009P |
1 |
2 |
3 |
4 |
5 |
I. |
|
World Output (Per cent change) # |
5.1 |
5.0 |
3.7 |
2.2 |
|
|
|
|
(3.9) |
(3.7) |
(2.6) |
(1.1) |
|
|
i) |
Advanced Economies |
3.0 |
2.6 |
1.4 |
-0.3 |
|
|
ii) |
Other Emerging Market and Developing Countries |
7.9 |
8.0 |
6.6 |
5.1 |
|
|
|
of which: Developing Asia |
9.8 |
10.0 |
8.3 |
7.1 |
II. |
|
Consumer Price Inflation (Per cent) |
|
|
|
|
|
|
i) |
Advanced Economies |
2.4 |
2.2 |
3.6 |
1.4 |
|
|
ii) |
Other Emerging Market and Developing Countries |
5.4 |
6.4 |
9.2 |
7.1 |
|
|
|
of which: Developing Asia |
4.2 |
5.4 |
7.8 |
6.2 |
III. |
Net Capital Flows* (US $ billion) |
|
|
|
|
|
|
i) |
Net Private Capital Flows (a+b+c)** |
223.0 |
632.8 |
528.6 |
286.6 |
|
|
|
a) Net Private Direct Investment |
246.0 |
379.0 |
443.6 |
414.6 |
|
|
|
b Net Private Portfolio Investment |
-107.3 |
54.5 |
-6.6 |
-89.1 |
|
|
|
c) Net Other Private Capital Flows |
84.4 |
199.5 |
91.8 |
-38.7 |
|
|
ii) |
Net Official Flows |
-158.0 |
-140.7 |
-158.6 |
-135.4 |
IV. |
|
World Trade @ |
|
|
|
|
|
|
i) |
Volume |
9.4 |
7.2 |
4.6 |
2.1 |
|
|
ii) |
Price Deflator |
5.0 |
8.1 |
15.3 |
0.2 |
V. |
|
Current Account Balance (Per cent to GDP) |
|
|
|
|
|
|
i) |
US |
-6.0 |
-5.3 |
-4.6 |
-3.3 |
|
|
ii) |
China |
9.4 |
11.3 |
9.5 |
9.2 |
|
|
iii) |
Middle East |
21.1 |
18.4 |
22.9 |
17.1 |
P : IMF Projections.
# : Growth rates are based on exchange rates at purchasing power parities. Figures in parentheses are growth rates at market exchange rates as given in World Economic Outlook October 2008 and WEO Update of November 6, 2008
* : Net capital flows to emerging market and developing countries.
** : On account of data limitations, flows listed under ‘Net private capital flows’ may include some official flows.
@ : Average of annual percentage change for world exports and imports of goods and services.
Source : World Economic Outlook (October 2008), WEO Update (November 6, 2008), International Monetary Fund. |
downturn. According to World Bank projections, world real GDP (measured at market exchange rates) may slow down even deeper to 2.5 per cent in 2008 and further to 0.9 per cent in 2009. Growth prospects for both high-income and developing countries have deteriorated substantially, and the possibility of a serious global recession cannot be ruled out. The pronounced recession that began in mid-2008 in Europe, Japan, and most recently, the United States is projected to extend into 2009, resulting in a decline in GDP of high-income countries of 0.1 per cent that year. In developing countries, growth is projected to slow to 4.5 per cent in 2009, down from 7.9 and 6.3 per cent in 2007 and 2008, respectively. As per the projections of the Organization for Economic Cooperation and Development (OECD), GDP is likely to decline by 0.3 per cent in 2009 for its 30 member countries. The Asian Development Bank (ADB) projects that economic growth in developing Asia will decline to 5.8 per cent in 2009, down from 6.9 per cent in 2008 and 9.0 per cent in 2007.
III.6 According to projections updated by the IMF in November 2008, growth in world trade is expected to moderate in volume terms in 2008 and exports growth of emerging and developing economies is projected to slow.
Table 17: Growth in Exports - |
Global Scenario |
(Per cent) |
Region/Country |
2007 |
2007 |
2008 |
|
|
January-September |
1 |
2 |
3 |
4 |
World |
14.0 |
14.0 |
12.1 |
Advanced Economies |
13.4 |
12.8 |
18.7 |
Emerging and |
|
|
|
Developing Economies |
15.1 |
16.3 |
0.2 |
China |
25.6 |
27.1 |
22.3 |
France |
12.3 |
11.0 |
18.9 |
Germany |
18.4 |
19.4 |
19.8 |
India |
21.5 |
21.6 * |
23.7 * |
Indonesia |
14.7 |
14.0 |
27.1 |
Japan |
7.8 |
8.1 |
18.9 |
Korea |
14.1 |
12.7 |
22.7 |
Malaysia |
9.6 |
7.4 |
19.8 |
Singapore |
10.1 |
8.5 |
22.9 |
Thailand |
17.0 |
14.6 |
22.7 |
US |
12.0 |
11.4 |
17.6 |
* : January-November.
Source : International Financial Statistics, International
Monetary Fund; DGCI&S for India. |
III.7 According to the IMF’s International Financial Statistics, growth in world merchandise exports during January-September 2008, in US dollar terms, decelerated to 12.1 per cent from 14.0 per cent in the previous year. While exports from the advanced economies showed higher growth, those from emerging and developing economies recorded only marginal growth (Table 17).
Merchandise Trade
III.8 India’s merchandise exports, which remained resilient till August 2008 (35.3 per cent growth during April-August 2008) decelerated in September 2008 (10.4 per cent) and recorded negative growth during October and November 2008 (-12.1 per cent and -9.9 per cent, respectively), reflecting the global economic slowdown (Chart 5). According to the provisional data released by DGCI&S, India’s merchandise exports during April-November 2008 increased by 18.7 per cent while imports recorded a higher growth of 32.5 per cent, largely due to the
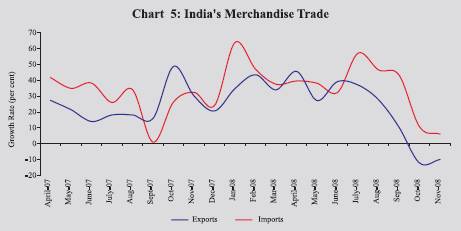
rise in petroleum, oil and lubricants (POL) imports. During April-November 2008, POL imports grew at an accelerated pace, reflecting the elevated international crude oil prices. Non-oil imports exhibited a deceleration in growth during April-November 2008 (Table 21).
III.9 Commodity-wise data available for the period April-September 2008 reveal that all major commodity groups except textiles and textile products, and gems and jewellery showed accelerated growth in exports. Engineering goods, agriculture & allied products and petroleum products were the main contributors of exports growth during April-September 2008, together constituting 55.9 per cent of the total exports and contributing 75.6 per cent to export growth. Primary products exports recorded an accelerated growth of 39.8 per cent, while manufactured goods exports registered a growth of 23.5 per cent during April-September 2008 (Table 18).
Table 18: Exports of Principal Commodities |
Commodity Group |
US $ billion |
Variation (per cent) |
|
|
2007-08 |
2007-08R |
2008-09P |
2007-08 |
2007-08 |
2008-09 |
|
|
|
April-September |
|
April-September |
1 |
|
2 |
3 |
4 |
5 |
6 |
7 |
1. |
Primary Products |
27.5 |
10.3 |
14.5 |
39.8 |
21.7 |
39.8 |
|
of which: |
|
|
|
|
|
|
|
a) Agriculture and Allied Products |
18.4 |
6.9 |
10.0 |
45.1 |
22.7 |
46.5 |
|
b) Ores and Minerals |
9.1 |
3.5 |
4.4 |
30.2 |
19.7 |
26.6 |
2. |
Manufactured Goods |
102.9 |
48.2 |
59.5 |
21.2 |
17.8 |
23.5 |
|
of which: |
|
|
|
|
|
|
|
a) Chemicals and Related Products |
21.2 |
9.5 |
12.1 |
22.2 |
15.4 |
26.4 |
|
b) Engineering Goods |
37.4 |
17.2 |
24.5 |
26.3 |
22.5 |
43.0 |
|
c) Textiles and Textile Products |
19.4 |
9.3 |
10.0 |
11.8 |
7.7 |
7.2 |
|
d) Gems and Jewellery |
19.7 |
9.6 |
10.0 |
23.2 |
23.9 |
4.7 |
3. |
Petroleum Products |
28.4 |
12.7 |
18.5 |
51.8 |
27.6 |
45.6 |
4. |
Total Exports |
162.9 |
73.3 |
94.9 |
28.9 |
19.8 |
29.5 |
|
Memo: |
|
|
|
|
|
|
|
Non-oil Exports |
134.5 |
60.6 |
76.4 |
24.9 |
18.3 |
26.2 |
R : Revised. P : Provisional. Source : DGCI&S. |
III.10 Destination-wise, developing countries remained the major markets for India’s exports during April-September 2008. Exports to the European Union, OPEC, North America, Eastern Europe, and Asian and Latin American developing countries accelerated while those to African developing countries decelerated. The US continued to be the single largest export destination of India followed by the UAE, Singapore, China and the Netherlands (Table 19).
III.11 Commodity-wise data on imports available for April-September 2008 show that while oil imports continued to register a sharp increase, non-oil imports witnessed a moderation in growth. The rise in oil imports was primarily due to high international crude oil prices, while the volume of oil imports moderated. The moderation in the growth of non-oil imports was mainly due to decline/deceleration in the import of pearls, precious and semi-
Table 19: Direction of India’s Exports |
Group/Country |
US $ billion |
Variation (per cent) |
|
2007-08 |
2007-08R |
2008-09P |
2007-08 |
2007-08 |
2008-09 |
|
|
April-September |
|
April-September |
1 |
2 |
3 |
4 |
5 |
6 |
7 |
1. OECD Countries |
62.6 |
29.8 |
35.6 |
20.4 |
17.1 |
19.3 |
|
of which: |
|
|
|
|
|
|
|
a) EU |
32.9 |
15.9 |
20.2 |
27.6 |
26.0 |
27.1 |
|
b) North America |
22.0 |
10.5 |
11.4 |
10.0 |
5.7 |
8.6 |
|
US |
20.7 |
9.9 |
10.7 |
9.8 |
5.8 |
8.3 |
2. |
OPEC |
26.7 |
12.9 |
18.8 |
28.8 |
22.5 |
46.1 |
|
of which: |
|
|
|
|
|
|
|
UAE |
15.6 |
7.5 |
10.4 |
29.9 |
21.4 |
37.9 |
3. |
Developing Countries |
69.6 |
29.5 |
38.9 |
37.1 |
21.1 |
31.8 |
|
of which: |
|
|
|
|
|
|
|
Asia |
51.5 |
21.3 |
28.5 |
36.9 |
17.3 |
33.5 |
|
People’s Republic of China |
10.8 |
3.9 |
4.5 |
30.6 |
12.7 |
16.6 |
|
Singapore |
7.4 |
3.1 |
5.2 |
21.4 |
-12.5 |
71.1 |
4. |
Total Exports |
162.9 |
73.3 |
94.9 |
28.9 |
19.8 |
29.5 |
R : Revised. P : Provisional. Source : DGCI&S. |
precious stones, gold and silver, iron and steel and electronics goods, though chemicals and fertilisers recorded higher growth (Table 20).
Table 20: Imports of Principal Commodities |
Commodity Group |
US $ billion |
Variation (per cent) |
|
2007-08 |
2007-08R |
2008-09P |
2007-08 |
2007-08 |
2008-09 |
|
|
April-September |
|
April-September |
1 |
2 |
3 |
4 |
5 |
6 |
7 |
Petroleum, Petroleum Products and |
|
|
|
|
|
|
Related Material |
79.6 |
34.6 |
62.2 |
39.4 |
17.1 |
79.6 |
Edible Oil |
2.6 |
1.4 |
1.4 |
21.4 |
33.3 |
4.0 |
Iron and Steel |
8.7 |
4.5 |
5.0 |
35.3 |
53.9 |
11.1 |
Capital Goods |
70.8 |
25.4 |
32.2 |
50.5 |
28.1 |
27.1 |
Pearls, Precious and Semi-Precious Stones |
8.0 |
4.7 |
4.0 |
6.5 |
30.4 |
-15.2 |
Chemicals |
9.9 |
4.7 |
7.5 |
26.5 |
21.9 |
57.4 |
Gold and Silver |
17.9 |
11.7 |
11.1 |
22.0 |
73.1 |
-4.9 |
Total Imports |
251.4 |
112.1 |
162.4 |
35.4 |
28.3 |
44.9 |
Memo: |
|
|
|
|
|
|
Non-oil Imports |
171.8 |
77.4 |
100.2 |
33.6 |
33.9 |
29.4 |
Non-oil Imports excluding Gold and Silver |
153.9 |
65.8 |
89.1 |
35.1 |
28.8 |
35.4 |
Mainly Industrial Inputs* |
141.7 |
60.3 |
78.2 |
35.4 |
27.8 |
29.6 |
R : Revised. P : Provisional.
* : Non-oil imports net of gold and silver, bulk consumption goods, manufactured fertilisers and professional instruments.
Source : DGCI&S. |
III.12 Source-wise, China was the single largest source of imports accounting for 10.3 per cent of the total imports followed by Saudi Arabia, UAE, the US, Iran and Switzerland.
Table 21: India’s Merchandise Trade |
(US $ billion) |
Item |
2007-08R |
2007-08R |
2008-09P |
|
|
April-November |
1 |
2 |
3 |
4 |
Exports |
162.9 |
99.8 |
118.4 |
Oil |
28.4 |
17.2 |
18.5 * |
Non-oil |
134.5 |
82.5 |
76.4 * |
Imports |
251.4 |
153.0 |
202.8 |
Oil |
79.6 |
47.6 |
73.7 |
Non-oil |
171.8 |
105.4 |
129.1 |
Trade Balance |
-88.5 |
-53.2 |
-84.4 |
Non-Oil Trade Balance - |
37.3 |
-22.8 |
-23.7 * |
|
|
Variation (per cent) |
Exports |
28.9 |
23.6 |
18.7 |
Oil |
51.8 |
34.4 |
45.6 * |
Non-oil |
24.9 |
21.5 |
26.2 * |
Imports |
35.4 |
28.0 |
32.5 |
Oil |
39.4 |
20.8 |
54.7 |
Non-oil |
33.6 |
31.6 |
22.5 |
R : Revised. P : Provisional. * : April-September. Source : DGCI&S. |
III.13 Merchandise trade deficit during April-November 2008 widened to US $ 84.4 billion from US $ 53.2 billion a year ago (Table 21).
Balance of Payments
Current Account
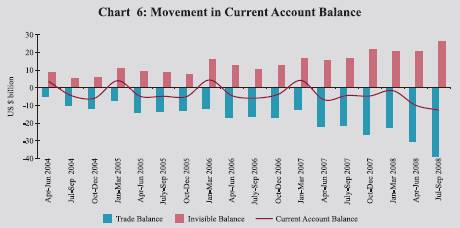
III.14 India’s current account deficit increased to US $ 22.3 billion during April-September 2008 (US $ 11.0 billion during April-September 2007) mainly due to widened trade deficit (Table 22 and Chart 6).
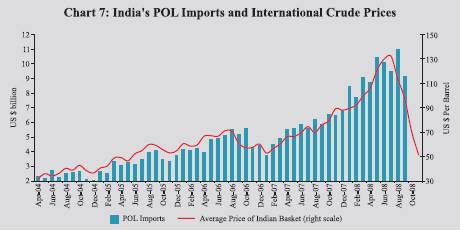
III.15 The widening of trade deficit during April-September 2008 could be attributed to higher import payments reflecting high international commodity prices, particularly crude oil prices (Chart 7).
Invisibles
III.16 Gross invisibles receipts rose by 29.8 per cent during April-September 2008 (28.3 per cent during the corresponding period of the previous year) mainly due to increase in receipts under private transfers
Table 22: India’s Balance of Payments |
(US $ billion) |
Item |
2007-08 PR |
2007-08 PR |
2008-09 |
|
April-
March |
April-
June |
Jul-
Sept. |
April-
Sept. |
April-
June PR |
July-
Sept. P |
April-
Sept. P |
1 |
2 |
3 |
4 |
5 |
6 |
7 |
8 |
Export |
166.2 |
34.4 |
38.3 |
72.6 |
49.1 |
47.7 |
96.7 |
Import |
257.8 |
56.3 |
59.5 |
115.9 |
79.6 |
86.3 |
165.9 |
Trade Balance |
-91.6 |
-22.0 |
-21.2 |
-43.2 |
-30.6 |
-38.6 |
-69.2 |
Net Invisibles |
74.6 |
15.3 |
16.9 |
32.3 |
20.8 |
26.1 |
46.8 |
Current Account Balance |
-17.0 |
-6.7 |
-4.3 |
-11.0 |
-9.8 |
-12.5 |
-22.3 |
Net Capital Account |
108.0 |
17.8 |
33.2 |
50.9 |
11.8 |
8.2 |
19.9 |
Overall Balance* |
92.2 |
11.2 |
29.2 |
40.4 |
2.2 |
-4.7 |
-2.5 |
Memo: |
|
|
|
|
|
Growth Rate (Per cent) |
Exports |
28.9 |
15.8 |
17.0 |
16.5 |
42.8 |
24.6 |
33.2 |
Imports |
35.2 |
20.9 |
22.2 |
21.5 |
41.3 |
45.0 |
43.2 |
Invisible receipts |
29.7 |
19.8 |
36.8 |
28.3 |
25.1 |
33.9 |
29.8 |
Invisibles payments |
18.7 |
17.3 |
17.0 |
17.1 |
14.0 |
13.9 |
14.0 |
PR : Partially Revised.
P : Preliminary.
* : Overall balance includes errors and omissions. |
along with the steady growth in software services exports, business services, travel and transportation. The invisible payments recorded a lower growth of 14.0 per cent during April-September 2008 (17.1 per cent during April-September 2007) mainly due to lower payments relating to a number of business and professional services. Net invisibles (invisibles receipts minus invisibles payments) increased by 45.3 per cent during April-September 2008 mainly
led by higher growth in private transfers and software exports (Table 23). At this level, the invisibles surplus financed about 67.7 per cent of trade deficit during April-September 2008 (74.6 per cent during April-September 2007).
Capital Account
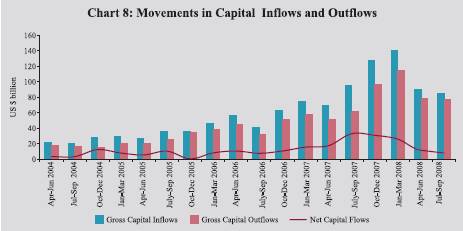
III.17 The surplus in the capital account moderated during April-September 2008 reflecting increased gross capital outflows following the global financial turmoil (Chart 8). The gross capital inflows were higher on account of higher FDI inflows and NRI deposits during the period.
Table 23: Invisibles Account (Net) |
(US $ million) |
Item |
2007-08 PR |
2007-08 PR |
2008-09 |
|
April- March |
April- June |
July- Sept. |
April- Sept. |
April- June PR |
July- Sept. P |
April- Sept. P |
1 |
2 |
3 |
4 |
5 |
6 |
7 |
8 |
Services |
37,565 |
8,974 |
8,998 |
17,972 |
10,175 |
12,701 |
22,876 |
Travel |
2,095 |
182 |
201 |
383 |
340 |
117 |
457 |
Transportation |
-1,500 |
-573 |
-468 |
-1,041 |
-798 |
-703 |
-1,501 |
Insurance |
595 |
188 |
57 |
245 |
122 |
64 |
186 |
Government not included elsewhere |
-46 |
-16 |
-60 |
-76 |
20 |
-14 |
6 |
Software |
37,242 |
8,157 |
8,249 |
16,406 |
9,799 |
10,296 |
20,095 |
Other Services |
-821 |
1,036 |
1,019 |
2,055 |
692 |
2,941 |
3,633 |
Transfers |
41,944 |
8,196 |
9,300 |
17,496 |
11,511 |
14,232 |
25,743 |
Investment Income |
-4,281 |
-1,745 |
-1,170 |
-2,915 |
-739 |
-829 |
-1,568 |
Compensation of Employees |
-636 |
-115 |
-188 |
-303 |
-175 |
-27 |
-202 |
Total |
74,592 |
15,310 |
16,940 |
32,250 |
20,772 |
26,077 |
46,849 |
PR : Partially Revised.
P : Preliminary. |
III.18 FDI broadly comprising equity, reinvested earnings and inter-corporate
loans was the major contributor to the capital inflows to India in net terms (Table 24). While the net inward FDI (net direct investment by foreign investors) remained buoyant reflecting relatively strong fundamentals of the Indian economy and continuing liberalisation measures to attract FDI, net outward FDI (net direct investment by Indian investors abroad) also remained high during April-September 2008.
Table 24: Net Capital Flows |
(US $ million) |
Item |
April-March |
April-September |
|
2006-07R |
2007-08PR |
2007-08PR |
2008-09P |
1 |
2 |
3 |
4 |
5 |
1. |
Foreign Direct Investment |
7,693 |
15,401 |
4,864 |
14,557 |
2. |
Portfolio Investment |
7,060 |
29,556 |
18,441 |
-5,521 |
|
of which: |
|
|
|
|
|
FIIs |
3,225 |
20,328 |
15,508 |
-6,615 |
|
ADR/GDRs |
3,776 |
8,769 |
2,793 |
1,135 |
3. |
External Assistance |
1,775 |
2,114 |
709 |
869 |
4. |
External Commercial Borrowings |
16,103 |
22,633 |
11,163 |
3,341 |
5. |
NRI Deposits |
4,321 |
179 |
-78 |
1,073 |
6. |
Banking Capital excluding NRI Deposits |
-2,408 |
11,578 |
5,802 |
3,754 |
7. |
Short-term Trade Credit |
6,612 |
17,183 |
6,589 |
3,173 |
8. |
Rupee Debt Service |
-162 |
-121 |
-45 |
-33 |
9. |
Other Capital |
4,209 |
9,470 |
3,502 |
-1,275 |
|
Total (1 to 9) |
45,203 |
107,993 |
50,947 |
19,938 |
R : Revised.
PR : Partially Revised.
P : Preliminary. |
III.19 Portfolio investment primarily comprising foreign institutional investors’ (FIIs) investments and American Depository Receipts (ADRs)/Global Depository Receipts (GDRs) witnessed net outflows during April-September 2008 as against net inflows in the corresponding period of the previous year. Outflows under portfolio investment were led by large sales of equities by FIIs in the Indian stock market and slowdown in net inflows under ADRs/GDRs due to drying-up of liquidity in the overseas market. During the current financial year so far (up to January 9, 2009), FIIs registered a net outflow of US $ 11.9 billion (as against net inflows of US $ 26.8 billion a year ago).
III.20 Net inflows under NRI deposits, a major constituent of ‘banking capital’, were positive during April-September 2008. Despite higher outflows recorded during the period, there was an increase in net accretion under NRI flows at US $ 1.1 billion during April-September 2008 as against a net decline of US $ 78.0 million during April-September 2007 (Table 24). In order to facilitate inflows under NRI deposits and to revive confidence in the foreign exchange market in the aftermath of the ongoing global financial market turmoil, the Reserve Bank increased the interest rate ceiling on NRI deposits in stages to 175 basis points above LIBOR/SWAP rate in case of NRE deposits and 100 basis points above LIBOR/SWAP rate in case of FCNR(B) deposits. As a result of these policy measures, there was a turnaround in the flows since September 2008, as reflected in the increase in net inflows under the NRI deposits to US $ 1.8 billion during April-November 2008 as against a decline of US $ 0.4 billion a year ago (Table 25).
Table 25: Capital Flows to India |
(US $ billion) |
Component |
Period |
2007-08 |
2008-09 |
1 |
2 |
3 |
4 |
FDI to India |
April-November |
16.1 |
23.3 |
FIIs (net) |
April-January |
#
26.8 |
-11.9 |
ADRs/GDRs |
April-November |
5.7 |
1.1 |
ECB Approvals* |
April-November |
21.5 |
13.8 |
NRI Deposits (net) |
April-November |
-0.4 |
1.8 |
# : Up to January 9, 2009.
* : ECB approvals are on gross basis. |
III.21 The gross disbursements under external commercial borrowings (ECBs) to India remained low during April-September 2008 reflecting tightening of overseas credit market conditions following the US sub-prime crisis. The gross ECB repayments by Indian companies increased to some extent during April-September 2008, especially in the second quarter of 2008-09. As a result, the net inflows under ECBs (including the net ECBs raised by foreigners from the Indian market) at US $ 3.3 billion during April-September 2008 was lower than the net inflows of US $ 11.2 billion during April-September 2007. According to the latest available information, approvals under ECBs during the current year so far (April-November) amounted to US $ 13.8 billion as compared with US $ 21.5 billion a year ago.
III.22 In order to increase capital inflows and to enable Indian companies to access overseas market for their funding needs in view of deepening of credit crunch since September 2008 in major advanced economies, the Government and the Reserve Bank modified various ECB norms in phases. The main policy measures included: (i) raising the ECB borrowing limit for infrastructure sector to US $ 500 million per financial year from the earlier limit of US $ 100 million for rupee expenditure for permissible end-uses under the approval route; (ii) the requirement of all-in-cost ceiling for ECBs over average maturity of 3-5 years and more than 5 years, which was increased to 300 basis points and 500 basis points, respectively, over 6-month LIBOR, was removed until June 30, 2009; (iii) the definition of infrastructure sector for availing ECB was expanded to include mining, exploration and refinery sectors; (iv) ECBs up to US $ 500 million per borrower per financial year were permitted for rupee expenditure and/or foreign currency expenditure for permissible end-uses under the automatic route; and (v) entities in the services sector, viz., hotels, hospitals and software companies were permitted to avail ECBs up to US $ 100 million in a financial year under the approval route for the purpose of import of capital goods.
III.23 Short-term trade credit in terms of gross disbursements was higher than the repayments during the second quarter of 2008-09 reflecting rising imports. Accordingly, the buyers’ credit recorded a net inflow of US $ 3.3 billion, while suppliers’ credit up to 180 days recorded negligible outflow of US $ 147 million, leading to net inflows of US $ 3.2 billion during April-September 2008 (US $ 6.6 billion during April-September 2007).
Foreign Exchange Reserves
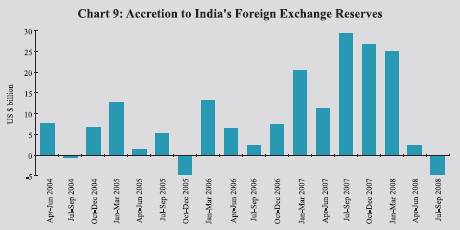
III.24 On balance, the higher current account deficit coupled with lower capital inflows led to a decline in foreign exchange reserves on BoP basis (i.e., excluding valuation) of US $ 2.5 billion during April-September 2008, as against an accretion of reserves of US $ 40.4 billion during the corresponding period of 2007-08 (Chart 9).
III.25 India’s foreign exchange reserves were US $ 252.2 billion as on January 16, 2009 showing a decrease of US $ 57.5 billion over end-March 2008 (including valuation losses) (Table 26).
Table 26: Foreign Exchange Reserves |
(US $ million) |
Month |
Gold |
SDR |
Foreign
Currency
Assets |
Reserve
Position
in the IMF |
Total
(2+3+4+5) |
Memo:
Outstanding
Net Forward Sales
(-) / Purchases (+)
of US dollar by the
Reserve Bank at the
end of the month |
1 |
2 |
3 |
4 |
5 |
6 |
7 |
March 2008 |
10,039 |
18 |
299,230 |
436 |
309,723 |
(+) 14,735 |
April 2008 |
9,427 |
18 |
304,225 |
485 |
314,155 |
(+) 17,095 |
May 2008 |
9,202 |
11 |
304,875 |
526 |
314,614 |
(+) 15,470 |
June 2008 |
9,208 |
11 |
302,340 |
528 |
312,087 |
(+) 13,700 |
July 2008 |
9,735 |
11 |
295,918 |
512 |
306,176 |
(+) 11,910 |
August 2008 |
8,692 |
4 |
286,117 |
496 |
295,309 |
(+) 9,925 |
September 2008 |
8,565 |
4 |
277,300 |
467 |
286,336 |
(+) 2,300 |
October 2008 |
8,382 |
9 |
244,045 |
447 |
252,883 |
(+) 90 |
November 2008 |
7,861 |
3 |
238,968 |
854 |
247,686 |
(-) 487 |
December 2008 |
8,485 |
3 |
246,603 |
877 |
255,968 |
.. |
January 2009* |
8,485 |
3 |
242,847 |
843 |
252,178 |
.. |
* : As on January 16, 2009. |
III.26 The overall approach to the management of India’s foreign exchange reserves in recent years reflects the changing composition of the balance of payments and the ‘liquidity risks’ associated with different types of flows and other requirements. Taking these factors into account, India’s foreign exchange reserves continued to be at a comfortable level and consistent with the rate of growth, the size of external sector in the economy and the size of risk-adjusted capital flow.
External Debt
III.27 India’s total external debt was placed at US $ 222.6 billion at end-September 2008, recording a marginal decline of around US $ 1 billion (0.5 per cent) over end-June 2008 (Table 27). The decline in external debt stock was essentially due to reduction in long-term debt outstanding by US $ 2.7 billion during the second quarter of 2008-09. Short-term
Table 27: India’s External Debt |
(US $ million) |
Item |
End-March
2007 |
End-March
2008 |
End-June
2008 |
End-Sept.
2008 |
1 |
2 |
3 |
4 |
5 |
1. |
Multilateral |
35,337 |
39,490 |
39,644 |
38,902 |
2. |
Bilateral |
16,065 |
19,702 |
18,729 |
18,782 |
3. |
Trade Credit (above 1 year) |
7,163 |
10,391 |
11,074 |
12,153 |
4. |
External Commercial Borrowings |
41,466 |
62,531 |
61,268 |
60,342 |
5. |
NRI Deposit |
41,240 |
43,672 |
42,612 |
40,622 |
6. |
Rupee Debt |
1,951 |
2,016 |
1,866 |
1,707 |
7. |
Long-term (1 to 6) |
143,222 |
177,802 |
175,193 |
172,508 |
8. |
Short-term |
28,130 |
46,999 |
48,619 |
50,104 |
Total (7+8) |
171,352 |
224,801 |
223,812 |
222,612 |
Memo: |
|
|
|
(Per cent) |
Total debt/GDP |
18.0 |
19.1 |
.. |
.. |
Short-term debt/Total debt |
15.6 |
20.9 |
21.7 |
22.5 |
Short-term debt/Reserves |
14.1 |
15.2 |
15.6 |
17.5 |
Concessional debt/Total debt |
23.1 |
19.6 |
19.1 |
18.7 |
Reserves/Total debt |
116.2 |
137.8 |
139.4 |
128.6 |
Debt Service Ratio |
4.7 |
4.8 |
3.7 |
4.3 |
.. : Not available. |
|
|
|
|
debt, however, increased mainly because of increase in short-term trade credit above 180 days of maturity, FII investments in government securities and corporate debt instruments. The Government of India and Securities Exchange Board of India (SEBI) enhanced the cumulative debt investment limit from US $ 3.0 billion to US $ 6.0 billion for FII investments in corporate debt in October 2008 and further to US $ 15 billion in January 2009. The US dollar continued to be the leading currency in which India’s external debt was denominated, accounting for 56.9 per cent of total debt.
III.28 Debt sustainability indicators remained at comfortable levels at end-September 2008. The debt service ratio was placed at 4.3 per cent during the second quarter of 2008-09. The ratio of short-term to total debt and short-term debt to reserves increased from that at end-June 2008. India’s foreign exchange reserves exceeded the external debt by US $ 63.7 billion providing a cover of 128.6 per cent to the external debt stock at the end of September 2008.
III.29 In terms of residual maturity, as at end-March 2008, the revised short-term debt (below one year) was estimated at around US $ 85 billion, which would mature during the financial year 2008-09. This short-term debt comprises sovereign debt, commercial borrowings, NRI deposits, short-term trade credit and others maturing up to end-March 2009. It is expected that sovereign debt, NRI deposits and commercial borrowings maturing during 2008-09 would not only get rolled over, but there could also be net additional inflows. Net ECB inflows have been positive during the current year so far. Given the current trend and policy measures undertaken by the Government of India, it is expected that the ECB repayments may not pose any problem during the current year. While short-term NRI deposits by residual maturity amounted to US $ 28.8 billion at end-March 2008, bulk of these are denominated in rupees (around 64 per cent) and are expected to be rolled over by the depositors following the increase in ceiling rate of interest in these deposits. The impact of the increase in interest rates on such deposits is already visible in terms of increased inflows during April-November 2008.
III.30 Some apprehension was expressed with respect to financing of the short-term trade credit of US $ 43.2 billion during 2008-09. In this regard, it may be mentioned that in normal times, the short-term credit gets rolled over. Besides, there are net additions. According to available data for the first half of 2008-09, already US $ 21.8 billion have been disbursed. Moreover, there are reports of inflows in the pipeline on account of commitments of buyers’ credit by the importers and oil companies. The issue was not about the availability of the financing but that of price at which such finances could be negotiated. In view of this, the Reserve Bank raised the all-in-cost ceiling for trade credits of maturities of ‘up to one year’ and ‘above one year up to three years’ from 75 and 125 basis points, respectively, to LIBOR plus 200 basis points each in October 2008. Given the trend observed in the disbursement of short-term trade credit so far and the commitments underway, it is expected that the financing of short-term trade credit may not pose much problem.
International Investment Position
III.31 India’s net international liabilities declined by US $ 3.4 billion between end-March 2008 and end-June 2008, as the decline in international liabilities (US $ 7.2 billion) exceeded that in international assets (US $ 3.8 billion) (Table 28). The decline in international assets was mainly on account of decrease in external loan extended through nostro accounts by the banking sector. However, direct investment and reserve asset position increased between end-March 2008 and end-June 2008. On the other hand, the decline in international liabilities was mainly attributed to outflow by FIIs from portfolio equity investment during April-June 2008 and also the effect of valuation changes.
Table 28: International Investment Position of India |
(US $ billion) |
Item |
March 2007 PR |
March 2008 PR |
June 2008 P |
1 |
2 |
3 |
4 |
A. |
Assets |
246.0 |
381.4 |
377.6 |
|
|
|
(25.9) |
(32.4) |
.. |
1. |
Direct Investment |
29.4 |
46.2 |
48.2 |
2. |
Portfolio Investment |
0.9 |
0.7 |
0.7 |
|
2.1 |
Equity Securities |
0.5 |
0.6 |
0.6 |
|
2.2 |
Debt Securities |
0.4 |
0.1 |
0.1 |
3. |
Other Investment |
16.5 |
24.8 |
16.6 |
|
3.1 |
Trade Credits |
0.6 |
0.9 |
2.0 |
|
3.2 |
Loans |
3.2 |
10.5 |
2.1 |
|
3.3 |
Currency and Deposits |
8.5 |
8.2 |
6.4 |
|
3.4 |
Other Assets |
4.2 |
5.2 |
6.2 |
4. |
Reserve Assets |
199.2 |
309.7 |
312.1 |
|
|
|
(20.9) |
(26.3) |
.. |
B. Liabilities |
308.0 |
434.0 |
426.8 |
|
|
|
(32.4) |
(36.8) |
.. |
1. |
Direct Investment |
76.3 |
115.5 |
119.5 |
|
|
|
(8.0) |
(9.8) |
.. |
2. |
Portfolio Investment |
79.5 |
119.4 |
108.0 |
|
|
|
(8.4) |
(10.1) |
.. |
|
2.1 |
Equity Securities |
63.3 |
98.3 |
87.4 |
|
2.2 |
Debt Securities |
16.2 |
21.2 |
20.5 |
3. |
Other Investment |
152.3 |
199.0 |
199.2 |
|
|
|
(16.0) |
(16.9) |
.. |
|
3.1 |
Trade Credits |
27.7 |
45.2 |
47.3 |
|
3.2 |
Loans |
80.9 |
106.4 |
106.5 |
|
3.3 |
Currency and Deposits |
42.3 |
44.8 |
43.6 |
|
3.4 |
Other Liabilities |
1.3 |
2.6 |
1.9 |
C. |
Net Position (A-B) |
-62.0 |
-52.5 |
-49.1 |
|
|
|
(-6.5) |
(-4.4) |
.. |
PR : Partially Revised.
P: Provisional.
Note: Figures in parentheses are percentages to GDP. |
|
 IST,
IST,


