III. The External Economy - RBI - Reserve Bank of India


III. The External Economy
The adverse impact of the global crisis operating through the trade channel continued to depress India’s trade transactions in 2009-10. In the first five months of 2009-10, merchandise exports and imports declined by 31.0 per cent and 33.4 per cent (year-on-year), respectively. In India’s balance of payments for the first quarter of 2009-10, while exports declined, imports increased over the preceding quarter, reflecting the increase in oil prices. As a result, the balance of payments witnessed a higher trade deficit over the preceding quarter. Surplus in net invisibles, led by buoyant remittances, financed about 78 per cent of the trade deficit. The current account, as a result, remained in deficit of US$ 5.8 billion. Return of capital inflows after the phase of net outflows experienced during the last two quarters of 2008-09, however, ensured the financing of the deficit without any loss of reserves. Including valuation gains and the SDRs allocated to India by the IMF, India’s foreign exchange reserves increased by US$ 32.8 billion during 2009-10 to US$ 284.8 billion as on October 16, 2009. III.1 The external economic environment improved in the recent months with emerging signs of recovery from the global recession, though recession like conditions still persist and the outlook for the global economy points to a slow paced recovery. The balance of payments transactions of the countries, which were severely disrupted by the crisis induced shocks to every important channel of globalisation, are yet to recover to normal levels. India’s balance of payments had exhibited resilience to the channels of contagion, which is evident from a current account deficit of 2.6 per cent of GDP and a reserve loss (net of valuation) of US$ 20.1 billion during 2008-09. In 2009-10, while the year-on-year decline in exports and imports continued, remittance related inflows remained buoyant and return of capital inflows has also reversed the pattern that was experienced in the capital account during the last two quarters of 2008-09. International Developments III.2 The global economy exhibited early signs of end of the recession with several advanced economies recording modest positive growth in the second quarter of 2008-09, while the pace of contraction in output declining significantly in others. The pace of global recovery, however, continues to be uncertain, given the fact that the recovery is still gaining support from the unprecedented stimulus measures amidst persisting stress in the financial systems of advanced economies. After successive rounds of downward revisions to the 2009 growth outlook from 3.9 per cent in July 2008 to -1.4 per cent in July 2009, the IMF for the first time, revised the growth outlook upwards to -1.1 per cent in October 2009. China and India are expected to lead the global recovery. III.3 Following a contraction in the last quarter of 2008 and the first quarter of 2009, global growth turned positive in the second quarter of 2009 bolstered by the strong performance of the Asian economies and stabilisation in other regions. Different economies are at differing points of the cycle. Although advanced economies continue to be in recession with a growth forecast of -3.4 per cent, the emerging and developing economies are forecast to grow by 1.7 per cent during 2009 (Table 3.1). Emerging Asia is leading the global rebound, with significant acceleration in growth in the second quarter in China, Hong Kong, Singapore and South Korea. In China, GDP growth is estimated to have further accelerated to 8.9 per cent in the third quarter, supported by the substantial fiscal stimulus and rapid increase in bank lending. GDP growth in other Asian emerging-market economies has also strongly recovered, partly in response to policy stimulus.
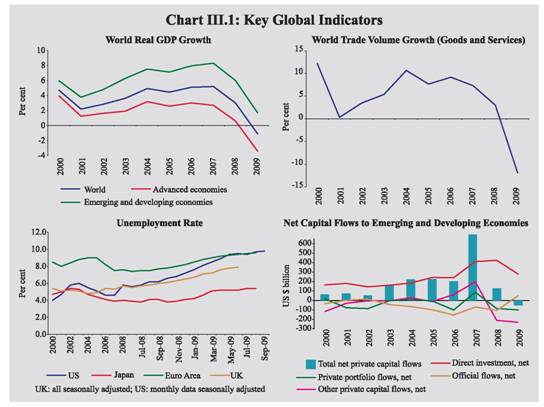
III.4 Going forward, the global economy is expected to make a modest recovery in 2010. In October 2009, the IMF revised its growth forecast for world output for 2010 upwards to 3.1 per cent from 2.9 per cent forecast in July 2009. The recovery is, however, expected to be slow and there are concerns about the prospect of long-term damage to the potential growth path of the world economy. III.5 Although global economic prospects continue to be uncertain, the risks to global activity are overall viewed to be broadly balanced. On the positive side, inventories appear to be leaner, world trade seems to be stabilising and capital flows are returning to the emerging world. There are, however, many challenges on the road to a sustained global recovery. An important concern is rising unemployment and associated sluggish consumer spending. III.6 A critical and complex issue that will have a bearing on the global recovery relates to appropriate timing and pace of exit from the current unprecedented levels of expansionary macroeconomic policies. While early reversal of easy monetary policy may thwart the incipient recovery, delaying the exit can potentially fuel inflation and inflationary expectations. That, in turn, would push up interest rates, which would militate against sustained growth. Different timings of the exit from accommodative monetary policy in different countries would result in interest rate differentials, with the resultant effects on capital flows and exchange rates, which may have to be managed prudently in emerging markets to contain the adverse implications for growth and inflation. III.7 The OECD Economic Outlook (September 2009) points to a recovery earlier than what was envisaged a few months ago. There has been a marked improvement in the overall financial conditions, though bank lending continues to decline and concerns about the health of the banking system remain. The inventory adjustment underway appears to have progressed and augurs well for the growth in the near-term. Similarly, decline in global trade appears to have reached a trough, with exports in the second quarter showing positive growth over the first quarter of 2009. The pace of the recovery, however, is likely to remain modest for some time to come as ample spare capacity, low levels of profitability, high and rising unemployment, anaemic growth in labour income and ongoing housing market corrections will dampen any upturn in private demand. III.8 The global financial crisis had affected the world economy through various channels. In addition to the growth slowdown and trade contraction worldwide, which was a common shock for all the countries, the advanced economies were affected by rising unemployment, which lowered the demand, while the emerging market economies (EMEs) experienced significant reversal in capital flows that affected their markets and the growth outlook. Unemployment rates in advanced economies continue to be high, even though EMEs have started to experience return of capital flows (Chart III.1). III.9 World merchandise exports started declining from November 2008 as a result of depressed world economic activity under the impact of global economic crisis. The decline in world exports accelerated over successive months during 2009. Subsequently, however, world exports came to show an improvement in June 2009, with the year-on-year decline being the smallest (26.9 per cent) in 2009 so far. According to the IMF’s International Financial Statistics, world merchandise exports (in dollar terms) showed a sharp decline of 29.5 per cent during January-June 2009, as against a growth of 25.9 per cent a year ago (Table 3.2). During the same period, exports of advanced economies witnessed an even sharper negative growth of 31.1 per cent in contrast with a growth of 21.6 per cent a year back. According to the WTO, world merchandise exports increased by about 8 per cent in the second quarter of 2009 over the preceding quarter, though year-on-year growth continued to decline by 33.0 per cent.
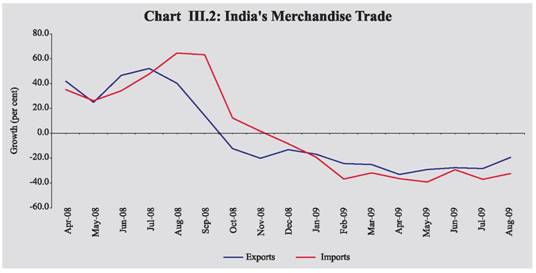
Merchandise Trade Exports III.10 In India, the decline in exports, which began in October 2008 as an impact of the global economic crisis through the trade channel, continued in 2009-10. The rate of decline in exports peaked in April 2009, before moderating somewhat during the subsequent months (Chart III.2). Overall, India’s merchandise exports during the first five months of 2009-10 (April-August 2009) posted a decline of 31.0 per cent, as against a high growth of 52.3 per cent during the same period last year. III.11 The composition of India’s export basket during 2008-09 suggests that the manufactured goods account for the largest share in total exports at 67.2 per cent, followed by petroleum and primary products. During 2008-09, the exports of major commodity groups slowed down, that of gems and jewellery exhibited substantial acceleration, while engineering goods displayed a marginal improvement in growth (Table 3.3). III.12 Destination-wise, developing and OECD countries were the major markets for India’s exports during 2008-09 with each group accounting for over 37.0 per cent of share in total exports followed by the OPEC (21.2 per cent). Country-wise, the UAE became the single largest export destination for India in 2008-09, replacing thereby the US, which had remained India’s largest export market for a number of years. Overall, the direction of India’s exports during 2008-09 indicated that the exports to Asian developing countries declined; exports growth to EU and North America decelerated, while exports to OPEC showed accelerated growth (Table 3.4).
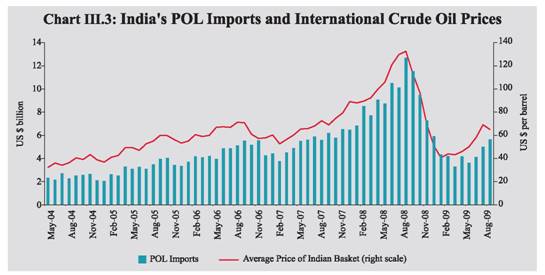
Imports III.13 The phase of deceleration in imports, which prevailed during October-November 2008, turned negative thereafter with the rate of fall in imports progressively increasing and reaching a peak in May 2009 (39.2 per cent). Although the rate of fall in imports moderated considerably during June 2009, it again accelerated in July 2009. The decline in imports, however, during August 2009 was lower than that in July 2009. During April-August 2009, imports registered a decline of 33.4 per cent in contrast with a growth of 52.1 per cent a year ago and the decline was seen in both POL and non-POL imports. The decline in imports witnessed in the last nine consecutive months was mainly an outcome of lower international crude oil prices and slowdown in domestic economic activity, apart from the high base effect. III.14 Commodity-wise imports indicated that growth of POL imports showed a deceleration (14.6 per cent) during 2008-09 from the level a year ago (39.9 per cent), mainly due to sharp reduction in international crude oil prices since August 2008, as also due to slowdown in the growth of volume of POL imports (Chart III.3). Growth in non-POL imports also witnessed moderation (16.5 per cent) from the previous year’s level (33.4 per cent), with deceleration mainly emanating from the imports of capital goods, gold and silver, and iron and steel. Imports of pearls, precious and semiprecious stones, however, grew considerably during the year (Table 3.5). III.15 Source-wise, developing countries occupied the highest share in India’s imports (32.9 per cent), followed by OPEC and OECD countries during 2008-09. This was in contrast with 2007-08 when OECD countries had the highest share in India’s imports. Country-wise, China continued to be the single largest source of imports followed by the UAE, Saudi Arabia, the US, Iran and Germany.
III.16 India’s merchandise trade deficit witnessed an increase from 7.5 per cent of GDP in 2007-08 to 9.4 per cent in 2008-09. During April-August 2009, merchandise trade deficit declined over the corresponding period of previous year, reflecting relatively larger decline in imports than exports (Table 3.6). Balance of Payments (BoP) Current Account III.17 The combined impact of synchronised global economic recession and deceleration in world trade witnessed since the second half of 2008-09 continued to affect the transactions in India’s current account during the first quarter of 2009-10. The decline in exports observed since October 2008 persisted during the first quarter of 2009-10. On a BoP basis, India’s merchandise exports recorded a decline of 21.0 per cent during April-June 2009 as against a high growth of 43.0 per cent during April-June 2008. Similarly, the trend of negative import growth that surfaced during the fourth quarter of 2008-09 after a gap of almost seven years, continued in the first quarter of 2009-10. Imports declined by 19.6 per cent during the first quarter of 2009-10 as against a positive growth of 42.9 per cent during the corresponding period a year ago – mainly due to lower oil import bill. However, as compared to the last quarter of 2008-09, exports during the first quarter of 2009-10 declined, while imports recorded an increase reflecting the increase in oil prices. As a result, there was a higher trade deficit (US$ 26.0 billion) during the first quarter of 2009-10 over the preceding quarter, although it was lower than the deficit observed during the first quarter of 2008-09 (Table 3.7).
Invisibles III.18 Manifesting the impact of continuing global recession, the gross invisibles receipts registered a marginal decline, while invisibles payments recorded a positive growth during the first quarter of 2009-10 (Table 3.8). The decline in invisibles receipts during the quarter was on account of a decline in almost all the categories of services except insurance and financial services, and a sharp decline in investment income receipts (20.3 per cent) mainly due to lower interest rates prevailing in other countries. Although exports of software services registered a decline during the first quarter, they are projected (by NASSCOM) to grow by 4 to 7 per cent during the financial year 2009-10. Private transfer receipts, comprising mainly remittances from Indians working overseas and local withdrawals from NRI Rupee deposits increased during the first quarter of 2009-10. A positive growth observed in invisibles payments during the quarter was mainly due to a higher growth in payments under non-software services such as business and financial services and the income account. Investment income payments increased marginally owing to increased reinvested earnings of FDI companies in India.
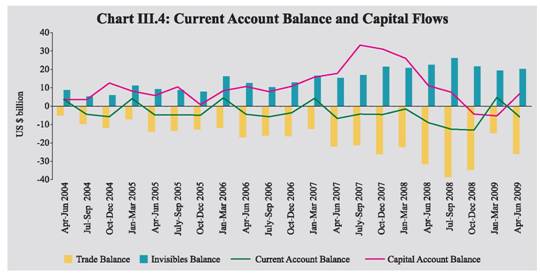
III.19 Although, net invisibles (invisibles receipts minus invisibles payments) were marginally lower during the first quarter of 2009-10 than that in the corresponding period of the previous year, the invisibles surplus financed about 77.7 per cent of the trade deficit during the first quarter of 2009-10 (71.3 per cent during the first quarter of 2008-09). Despite net invisibles surplus, the large trade deficit mainly on account of decline in exports and increase in imports over the preceding quarter led to a current account deficit of US$ 5.8 billion during the first quarter of 2009-10 as against US$ 9.0 billion during the first quarter of 2008-09. During 2008-09, current account deficit as a per cent of GDP stood at 2.6 per cent, higher than 1.5 per cent a year ago (Chart III.4). Capital Account III.20 During the first quarter of 2009-10, capital account witnessed a revival after undergoing a sustained pressure since the third quarter of 2008-09, on the back of massive deleveraging in the advanced financial markets. With the revival in capital inflows to India, particularly foreign investments, the capital account showed a turnaround from a negative balance in the last two quarters of 2008-09 to a positive balance of US$ 6.7 billion during the first quarter of 2009-10 (Table 3.9). III.21 Component-wise, net inward FDI into India remained buoyant during April-June of 2009-10, reflecting relatively better investment climate in India and the continuing liberalisation measures to attract FDI. During the first quarter of 2009-10, manufacturing sector continued to attract most part of FDI (19.2 per cent), followed by real estate activities (15.6 per cent) and financial services (15.4 per cent). III.22 Portfolio investment, primarily comprising foreign institutional investors’ (FIIs) investments and American Depository Receipts (ADRs)/Global Depository Receipts (GDRs) witnessed a sharp turnaround from net outflows in the fourth quarter of 2008-09 to net inflows during the first quarter of 2009-10. During 2009-10, the sharp increase in FII inflows could be attributed mainly to the recovery in domestic stock markets following the international trends and comparatively better growth prospects in India. Net inflows under ADRs/GDRs were significantly lower during the first quarter of 2009-10 as compared to the coresponding quarter of the previous year, reflecting continued tightness in liquidity in the overseas markets. The net ECBs recorded an outflow during the first quarter of 2009-10 as against net inflows during the first quarter of 2008-09. Banking capital mainly consists of foreign assets and liabilities of commercial banks. NRI deposits constitute major part of the foreign liabilities. Net Banking capital, including NRI deposits also were negative during the first quarter of 2009-10 as against a positive net inflow witnessed during the first quarter of 2008-09.
III.23 During April-June 2009, the disbursement under short-term trade credit continued to remain steady on the back of various policy measures undertaken such as hike in the all-in-cost ceilings for trade credit of various maturities that was necessary in the context of hardening of cost of funds in the international markets. The repayments were, however, somewhat higher than the comparable period of the previous year. It is expected that the current trend in disbursement of short-term trade credit will continue. III.24 The latest available information on certain indicators of the capital account indicates a revival in capital flows to India (Table 3.10). This could be attributed to relatively better macroeconomic performance of India during 2008-09 and positive sentiments of global investors about the growth potential of EMEs, including India.
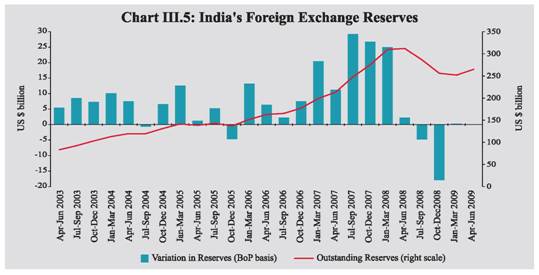
Foreign Exchange Reserves III.25 The foreign exchange reserves on BoP basis (i.e., excluding valuation) increased by US$ 0.1 billion during the first quarter of 2009-10 as compared with an increase of US$ 2.2 billion during the corresponding quarter of 2008-09. Taking into account the valuation gain due to depreciation of the US dollar against the major currencies, the foreign exchange reserves increased by US$ 13.2 billion during April-June 2009 as compared with an increase of US$ 2.4 billion during April-June 2008 (Chart III.5). III.26 As on October 16, 2009, India’s foreign exchange reserves stood at US$ 284.8 billion, which is higher by US$ 32.8 billion over end-March 2009 level (US$ 252.0 billion). The increase in foreign exchange reserves during this period also includes the SDRs allocation made by the IMF in two consecutive tranches on August 28, 2009 and September 9, 2009, respectively (Table 3.11). External Debt III.27 India’s external debt was placed at US$ 227.7 billion at the end of June 2009 as compared to US$ 224.0 billion as at the end of March 2009. The increase in the external debt by 1.7 per cent during this period was mainly due to the increase in long term external debt, particularly NonResident Indian (NRI) deposits (Table 3.12). Short-term debt, however, declined by US$ 3.0 billion during the same period mainly on account of decline in short-term trade credit (up to 6 months). Accordingly, the ratio of short-term to total debt declined to 17.8 per cent from 19.5 per cent during the same period. The ratio of external debt to GDP increased to 21.4 per cent as at end-March 2009 from 18.9 per cent as at end-March 2008. The debt service ratio declined steadily during the last three years and stood at 4.6 per cent as at end-March 2009. The debt service ratio for April-June 2009 worked out to 5.5 per cent.
III.28 Based on the measure of residual maturity of the outstanding debt - an indicator for assessing the debt service liability in the short-run - the revised short-term debt (below one year) as at end-March 2009 was estimated at around US$ 87.5 billion, which would become due for repayment during 2009-10. This includes short-term debt based on original maturity at US$ 43.6 billion and long term external debt due for payments within one year of US$ 43.9 billion. Out of these US$ 43.9 billion, the NRI deposits constitute US$ 32.1 billion. The bulk of NRI deposits (around 70 per cent) are in rupee-terms and there have been net accretions of around US$ 2.7 billion during 2009-10 so far (up to September 30, 2009).
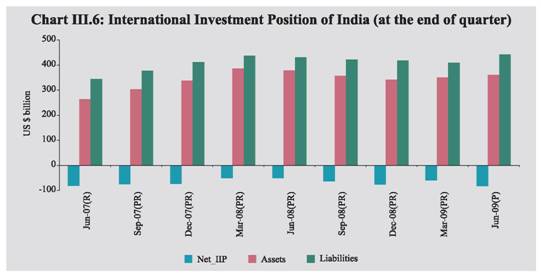
International Investment Position III.29 India’s net international liabilities were placed at US$ 82.5 billion as at end-June 2009 as compared to US$ 59.4 billion as at end-March 2009. The international assets increased from US$ 350.0 billion at end-March 2009 to US$ 360.2 billion at end-June 2009 mainly on account of increase in reserve assets during the quarter. The increase in international liabilities from US$ 409.4 billion to US$ 442.7 billion during the same period was on account of an increase in inward direct investment and portfolio equity investment in India (Chart III.6). III.30 During the first quarter of 2009-10 (April-June), exports declined and imports increased over the preceding quarter, while private transfer receipts remained buoyant. Notwithstanding net invisibles surplus, higher trade deficit on account of decline in exports and increase in imports resulted in a current account deficit during the first quarter of 2009-10. Nevertheless, the renewed confidence of international investors in India has led to the revival in capital inflows, turning the capital account from a deficit in the last two quarters of 2008-09 into a surplus in the first quarter of 2009-10. Accordingly, there was a marginal increase in foreign exchange reserves on BoP basis (i.e., excluding valuation). Including valuation effects, reserves showed a larger increase during the first quarter of 2009-10 and reserve accretion continued in the second quarter of 2009-10. Thus, the balance of payments developments indicate that concerns relating to the external sector have receded with the revival in capital flows and modest level of current account deficit. The Indian rupee has exhibited some appreciation in the recent period while the country’s reserve levels have increased. |
|||||||||||||||||||||||||||||||||||||||||||||||||||||||||||||||||||||||||||||||||||||||||||||||||||||||||||||||||||||||||||||||||||||||||||||||||||||||||||||||||||||||||||||||||||||||||||||||||||||||||||||||||||||||||||||||||||||||||||||||||||||||||||||||||||||||||||||||||||||||||||||||||||||||||||||||||||||||||||||||||||||||||||||||||||||||||||||||||||||||||||||||||||||||||||||||||||||||||||||||||||||||||||||||||||||||||||||||||||||||||||||||||||||||||||||||||||||||||||||||||||||||||||||||||||||||||||||||||||||||||||||||||||||||||||||||||||||||||||||||||||||||||||||||||||||||||||||||||||||||||||||||||||||||||||||||||||||||||||||||||||||||||||||||||||||||||||||||||||||||||||||||||||||||||||||||||||||||||||||||||||||||||||||||||||||||||||||||||||||||||||||||||||||||||||||||||||||||||||||||||||||||||||||||||||||||||||||||||||||||||||||||||||||||||||||||||||||||||||||||||||||||||||||||||||||||||||||||||||||||||||||||||||||||||||||||||||||||||||||||||||||||||||||||||||||||||||||||||||||||

Share this page:


Install the RBI mobile application and get quick access to the latest news!


