The overall improvement in the global macroeconomic conditions have started shaping the performance of the external sector in India. While merchandise exports have witnessed a turnaround after thirteen consecutive months of decline, the pace of contraction in imports has also moderated significantly. In the balance of payments for the second quarter of 2009-10, net capital inflows and accretion to reserves have been significant. In the subsequent period, capital flows have remained buoyant and foreign exchange reserves have increased further to US $ 285.2 billion as on January 15, 2010. The expected surge in capital inflows to EMEs will have significant varied implications for macroeconomic management.
III.1 The external environment improved further with major advanced economies exhibiting stronger recovery in the third quarter of 2009, world merchandise exports showing some turnaround and capital flows to EMEs showing a sustained resumption. In India, while merchandise exports witnessed an end of thirteen consecutive months of decline, the pace of contraction in imports also eased significantly. In the balance of payments (BoP), net capital inflows and accretion to foreign exchange reserves have been buoyant. The momentum in capital inflows and the increase in reserves has continued in the third quarter. In view of allocation of SDRs by the IMF and India’s purchase of gold from the IMF, the level and composition of India’s foreign exchange reserves have changed in the recent period.
International Developments
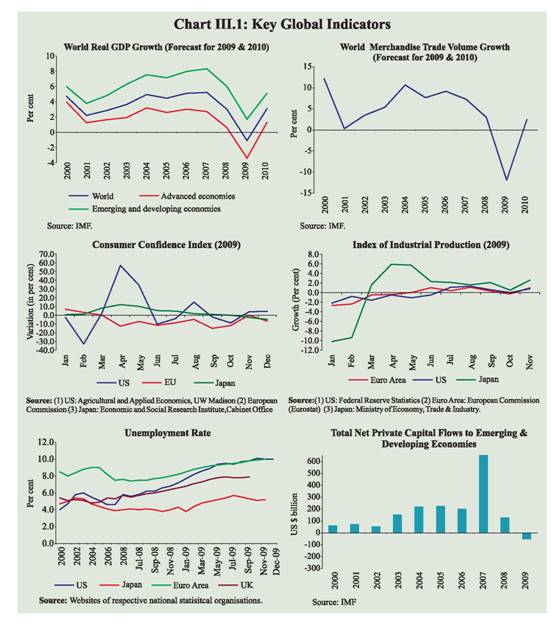
III.2 The global economy is recovering,albeit slowly, with the G-20 countries (excluding the UK) exhibiting sequential positive growth during the third quarter of 2009. The US recorded a growth of 2.2 per cent during the third quarter of 2009 as compared with a contraction of 0.7 per cent in the second quarter of 2009. After contracting over five consecutive quarters, growth in the Euro Area returned to positive territory (0.4 per cent) during the third quarter of 2009. Asia continues to lead the global recovery. The steady upturn of the Chinese economy further strengthened with a growth of 10.7 per cent during the fourth quarter of 2009 (year-on-year) from 8.9 per cent in the third quarter. Japan also grew in the third quarter at an annualised rate of 1.3 per cent.
III.3 The unemployment rate for the OECD area was 8.8 per cent in November 2009, same as in the previous month and 2.1 percentage points higher than a year earlier. For the US, the unemployment rate for December 2009 was 10.0 per cent, same as in the previous month and 2.6 percentage points higher than a year ago.
III.4 Going forward, the global economy is projected to return to positive growth territory in 2010 after recording a decline of 1.1 per cent in 2009 (IMF World Economic Outlook, October 2009). The advanced economies are projected to post a positive growth in 2010 after being in recession during 2009. The emerging and developing economies are projected to exhibit a strong recovery from 1.7 per cent in 2009 to 5.1 per cent in 2010, with India and China leading the momentum (Table 3.1). The OECD economic outlook released on November 19, 2009 projected real GDP of the OECD area to decline by 3.5 per cent in 2009 and recover thereafter to a positive growth of 1.9 per cent in 2010.
III.5 There is return of consumer confidence and revival in industrial production in the case of advanced economies, which were adversely impacted by the crisis, even though the unemployment rates continue to be high (Chart III.1).
III.6 The sharp recovery in financial markets worldwide ahead of recovery in growth during 2009 has been accompanied by a return of private cross-border capital inflows to many countries. A combination of better growth prospects, near zero policy rates in the major centres and low long-term interest rates provide the pull and push for resurgence in capital inflows, particularly to emerging market countries and commodity exporters.
Table 3.1: Select Economic Indicators - World |
Item |
2007 |
2008 |
2009P |
2010P |
1 |
2 |
3 |
4 |
5 |
I. |
World Output (Per cent change) # |
5.2 |
3.0 |
-1.1 |
3.1 |
| |
|
(3.8) |
(1.8) |
(-2.3) |
(2.3) |
| |
i) |
Advanced Economies |
2.7 |
0.6 |
-3.4 |
1.3 |
| |
ii) |
Other Emerging Market and Developing Countries |
8.3 |
6.0 |
1.7 |
5.1 |
| |
|
of which: Developing Asia |
10.6 |
7.6 |
6.2 |
7.3 |
| |
|
India |
9.4 |
7.3 |
5.4 |
6.4 |
II. |
Consumer Price Inflation (Per cent) |
|
|
|
|
| |
i) |
Advanced Economies |
2.2 |
3.4 |
0.1 |
1.1 |
| |
ii) |
Other Emerging Market and Developing Countries |
6.4 |
9.3 |
5.5 |
4.9 |
| |
|
of which: Developing Asia |
5.4 |
7.5 |
3.0 |
3.4 |
III. |
Net Capital Flows* (US$ billion) |
|
|
|
|
| |
i) |
Net Private Capital Flows (a+b+c)** |
696.5 |
129.5 |
-52.5 |
28.3 |
| |
|
a) |
Net Private Direct Investment |
411.2 |
425.0 |
279.0 |
269.5 |
| |
|
b) |
Net Private Portfolio Investment |
88.1 |
-85.4 |
-99.8 |
-110.4 |
| |
|
c) |
Net Other Private Capital Flows |
197.1 |
-210.1 |
-231.6 |
-130.8 |
| |
ii) |
Net Official Flows |
-69.5 |
-105.7 |
50.3 |
-14.2 |
IV. |
World Trade @ |
|
|
|
|
| |
i) |
Trade Volume |
7.3 |
3.0 |
-11.9 |
2.5 |
| |
ii) |
Export Volume |
7.4 |
2.8 |
-11.4 |
2.6 |
| |
iii) |
Trade Price Deflator |
8.1 |
11.2 |
-12.2 |
5.4 |
V. |
Current Account Balance (Per cent to GDP) |
|
|
|
|
| |
i) |
US |
-5.2 |
-4.9 |
-2.6 |
-2.2 |
| |
ii) |
China |
11.0 |
9.8 |
7.8 |
8.6 |
| |
iii) |
India |
-1.0 |
-2.2 |
-2.2 |
-2.5 |
| |
iv) |
Middle East |
18.1 |
18.3 |
2.6 |
7.9 |
P : IMF Projections.
# : Growth rates are based on exchange rates at purchasing power parities. Figures in parentheses are growth rates at market
exchange rates.
* : Net capital flows to emerging market and developing countries.
** : On account of data limitations, flows listed under ‘Net private capital flows’ may include some official flows.
@ : Average of annual percentage change for world exports and imports of goods and services.
Source : World Economic Outlook, October 2009, International Monetary Fund. |
III.7 The policy responses of EMEs to the growing capital inflows include three components, viz., monetary and exchange rate policy, capital account policy and prudential policy. First, several countries have allowed their exchange rates to appreciate, while some countries, concerned about the competitiveness of their exports, have not done so. Second, capital controls are being viewed as an additional policy instrument to deal with macroeconomic challenges associated with capital inflows. The use of prudential tools, which have been a common process, primarily aim at containing financial stability concerns. The market focus on assessment of sovereign risk has increased after the Dubai World incident.
Furthermore, the fiscal risks associated with large deficits and debt of countries will assume prominence over time.
III.8 The world merchandise exports had started declining since November 2008, with rate of decline accelerating over the successive months under the impact of the synchronised global economic slowdown. According to the International Monetary Fund’s (IMF) International Financial Statistics (IFS), in September 2009, the year-on-year decline in world exports at 16.6 per cent was the lowest since January 2009, suggesting improvement in terms of decline in the pace of contraction. Cumulatively, world merchandise exports (in dollar terms) during January-September 2009, showed a decline of 27.1 per cent as against a growth of 24.2 per cent a year ago (Table 3.2). According to the WTO data, while world merchandise exports increased by 10 per cent (sequential quarter-on-quarter) in the third quarter of 2009, on year-on-year basis, the decline was 26 per cent.
Table 3.2: Growth in Exports -Global Scenario |
(Per cent) |
Region/Country |
2007 |
2008 |
2008 |
2009 |
| |
January-December |
January-September |
1 |
2 |
3 |
4 |
5 |
World |
14.1 |
15.8 |
24.2 |
-27.1 |
Advanced Economies |
13.5 |
11.0 |
19.5 |
-28.1 |
US |
12.0 |
11.9 |
17.8 |
-23.0 |
France |
12.3 |
10.1 |
19.4 |
-28.5 |
Germany |
18.0 |
10.8 |
18.9 |
-29.5 |
Japan |
7.8 |
12.3 |
18.6 |
-33.4 |
Emerging and |
|
|
|
|
Developing Economies |
15.3 |
24.6 |
33.1 |
-25.7 |
Singapore |
10.1 |
13.0 |
22.9 |
-28.5 |
China |
25.6 |
17.3 |
22.3 |
-21.2 |
India |
23.3 |
29.7 |
33.9* |
-22.8* |
Indonesia |
14.7 |
24.4 |
27.6 |
-23.4 |
Korea |
14.1 |
13.6 |
22.6 |
-20.9 |
Malaysia |
9.6 |
19.1 |
23.3 |
-29.5 |
Thailand |
17.1 |
12.9 |
24.7 |
-21.0 |
* January-November over corresponding period of previous year. Source: 1. IMF (www.imfstatistics.org).
2. DGCI&S for India. |
Merchandise Trade
Exports
III.9 The declining trend in India’s merchandise exports, which began in October 2008, continued for thirteen consecutive months up to October 2009. The rates of decline in exports, however, showed persistent moderation starting from June 2009. During November 2009, there was reversal in the trend, with exports turning around sharply by exhibiting a growth of 18.2 per cent as compared with a decline of 13.5 per cent in November 2008 (Chart III.2). This recovery has to be seen in relation to the low base a year ago. On a cumulative basis, India’s merchandise exports during April-November 2009 registered a decline of 22.4 per cent as against a growth of 32.7 per cent during the corresponding period of the previous year.
III.10 The composition of India’s exports basket during 2009-10 (April-June) reveals that manufactured goods occupied the largest share at 70.9 per cent, followed by primary products (14.4 per cent) and petroleum products (12.1 per cent). Moreover, the share of manufactured goods has increased over time, along with decrease in the share of petroleum products. During April-June 2009, the exports of all major commodity groups declined (Table 3.3).
III.11 In terms of destination, developing countries and OECD countries were the major markets for India’s exports with these groups accounting for 37.7 per cent and 36.9 per cent shares, respectively. Country-wise, the UAE was the largest destination for India during April-June 2009, with a share of 14.0 per cent in India’s total exports, followed by the US, China, Singapore, Hong Kong and the UK. Exports to major export destinations, such as the EU, OPEC and developing countries declined during April-June 2009 (Table 3.4).
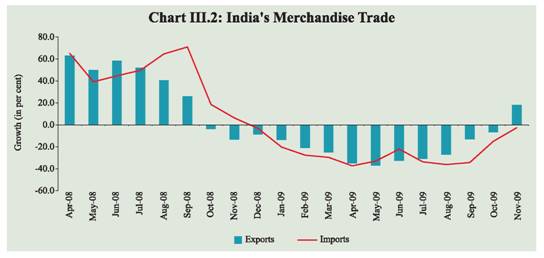
Table 3.3: Exports of Principal Commodities |
Commodity/Group |
US $ billion |
Variation (Per cent) |
2008-09 |
2008-09R |
2009-10P |
2008-09 |
2008-09R |
2009-10P |
April-March |
April-June |
April-March |
April-June |
1 |
2 |
3 |
4 |
5 |
6 |
7 |
1. |
Primary Products |
25.3 |
8.2 |
5.2 |
-8.0 |
72.3 |
-36.8 |
| |
of which: |
|
|
|
|
|
|
| |
a) |
Agriculture and Allied Products |
17.5 |
5.7 |
3.7 |
-4.9 |
95.4 |
-34.7 |
| |
b) |
Ores and Minerals |
7.8 |
2.5 |
1.4 |
-14.5 |
34.9 |
-41.5 |
2. |
Manufactured Goods |
123.1 |
36.0 |
25.6 |
19.6 |
58.8 |
-29.0 |
| |
of which: |
|
|
|
|
|
|
| |
a) |
Chemicals and Related Products |
22.7 |
6.1 |
4.7 |
7.1 |
33.6 |
-23.9 |
| |
b) |
Engineering Goods |
47.3 |
13.8 |
9.4 |
26.5 |
71.6 |
-31.7 |
| |
c) |
Textiles and Textile Products |
20.0 |
5.6 |
4.3 |
3.0 |
28.2 |
-22.5 |
| |
d) |
Gems and Jewellery |
28.0 |
9.1 |
6.1 |
42.1 |
102.4 |
-32.7 |
3. |
Petroleum Products |
26.8 |
9.2 |
4.4 |
-5.4 |
42.8 |
-52.4 |
4. |
Total Exports |
185.3 |
56.4 |
36.1 |
13.7 |
57.0 |
-36.0 |
Memo: |
|
|
|
|
|
|
Non-oil Exports |
158.5 |
47.2 |
31.7 |
17.8 |
60.1 |
-32.8 |
R: Revised. P: Provisional. Source : DGCI&S. |
Imports
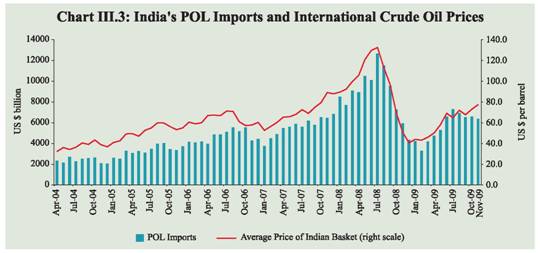
III.12 After a spell of deceleration in growth during October-November 2008, India’s imports started declining thereafter with the rate of decline accentuating over successive months. Since August 2009, however, the rate of fall in imports has showed considerable moderation, with the year-on-year decline in imports in November 2009 turning out to be 2.6 per cent, which is the lowest rate of decline so far. Overall, imports during April-November 2009 registered a decline of 27.4 per cent in contrast with a growth of 43.6 per cent a year ago. The decline in imports reflected the combined effects of both lower international crude oil prices and slowdown in domestic economic activity (Table 3.5 and Chart III.3).
Table 3.4: Direction of India's Exports |
Group/Country |
US $ billion |
Variation (Per cent) |
2008-09 April-March |
2008-09R |
2009-10P |
2008-09 April-March |
2008-09R |
2009-10P |
April-June |
April-June |
1 |
2 |
3 |
4 |
5 |
6 |
7 |
1. |
OECD Countries |
68.5 |
19.6 |
13.3 |
6.5 |
41.1 |
-32.0 |
| |
of which: |
|
|
|
|
|
|
| |
EU |
39.0 |
11.5 |
7.4 |
13.0 |
57.2 |
-36.1 |
| |
North America |
22.3 |
5.9 |
4.4 |
1.6 |
20.0 |
-26.6 |
| |
US |
21.0 |
5.6 |
4.1 |
1.3 |
19.4 |
-26.6 |
2. |
OPEC |
38.9 |
12.4 |
8.7 |
44.0 |
90.7 |
-29.7 |
| |
of which: |
|
|
|
|
|
|
| |
UAE |
24.0 |
8.1 |
5.1 |
53.4 |
112.9 |
-37.6 |
3. |
Developing Countries |
68.5 |
21.8 |
13.6 |
-0.9 |
53.4 |
-37.5 |
| |
of which: |
|
|
|
|
|
|
| |
Asia |
51.3 |
16.3 |
10.4 |
-0.4 |
59.2 |
-36.2 |
| |
People’s Republic of China |
9.3 |
2.9 |
2.0 |
-14.3 |
49.1 |
-29.7 |
| |
Singapore |
8.2 |
3.5 |
1.9 |
11.4 |
116.8 |
-44.7 |
4. |
Total Exports |
185.3 |
56.4 |
36.1 |
13.7 |
57.0 |
-36.0 |
R: Revised. P: Provisional. Source : DGCI&S. |
Table 3.5: Trends in Imports (Growth) |
(Per cent) |
| |
April-November |
2008-09R |
2009-10P |
POL Imports |
60.8 |
(-) 34.5 |
Non-POL Imports |
36.5 |
(-) 23.9 |
Total Imports |
43.6 |
(-) 27.4 |
R: Revised. P: Provisional. Source: DGCI&S. |
III.13 The commodity-wise imports during 2009-10 (April-June) indicate that POL imports showed a sharp decline. Non-POL imports during this period also witnessed a decline of 24.5 per cent, mainly due to sharp decline in imports of iron and steel, capital goods, gold and silver, pearls, precious and semi-precious stones, chemicals and coal. The imports of edible oil, however, witnessed considerable growth (Table 3.6).
III.14 Source-wise, OECD countries had the highest share in India’s imports (34.1 per cent), followed by developing countries (34.0 per cent) and OPEC (28.8 per cent) during April-June 2009. The shares of developing countries and OECD countries have increased, while that of OPEC declined during the period. Country-wise, China continued to be the single largest source of imports with a share of 12.1 per cent in total imports, followed by the US, the UAE, Saudi Arabia, Australia and Iran.
 III.15 India’s merchandise trade deficit registered an increase from 7.5 per cent of GDP in 2007-08 to 10.0 per cent in 2008-09. During April-November 2009, however, merchandise trade deficit declined over the corresponding period of the previous year, reflecting relatively larger decline in imports than exports (Table 3.7).
Table 3.6: Imports of Principal Commodities |
Commodity/Group |
US $ billion |
Variation (Per cent) |
2008-09 |
2008-09R |
2009-10P |
2008-09 |
2008-09R |
2009-10P |
April-March |
April-June |
April-March |
April-June |
1 |
2 |
3 |
4 |
5 |
6 |
7 |
Petroleum, Petroleum Products |
|
|
|
|
|
|
& Related Material |
91.3 |
29.6 |
16.6 |
14.6 |
74.1 |
-43.9 |
Edible Oil |
3.4 |
0.6 |
1.2 |
34.4 |
-10.3 |
99.6 |
Iron and Steel |
9.5 |
2.4 |
1.8 |
8.9 |
5.2 |
-25.5 |
Capital Goods |
71.6 |
19.8 |
15.0 |
2.2 |
60.0 |
-24.4 |
Pearls, Precious and Semi-Precious Stones |
16.6 |
5.7 |
2.9 |
107.6 |
145.6 |
-49.2 |
Chemicals |
12.2 |
3.6 |
3.0 |
23.1 |
50.8 |
-17.2 |
Gold and Silver |
21.8 |
6.5 |
5.6 |
22.3 |
-9.1 |
-14.5 |
Total Imports |
303.7 |
88.7 |
61.2 |
20.8 |
49.0 |
-31.0 |
Memo: |
|
Non-oil Imports |
212.4 |
59.1 |
44.6 |
23.6 |
39.0 |
-24.5 |
Non-oil Imports excluding Gold and Silver |
190.5 |
52.5 |
39.0 |
23.8 |
48.8 |
-25.7 |
Mainly Industrial Inputs* |
169.3 |
48.2 |
34.9 |
20.2 |
45.9 |
-27.6 |
R: Revised. P: Provisional.
*: Non-oil imports net of gold and silver, bulk consumption goods, manufactured fertilisers and professional
instruments.
Source : DGCI&S. |
Table 3.7: India's Merchandise Trade |
(US $ billion) |
Item |
2008-09R |
2008-09R |
2009-10P |
(April-March) |
April-November |
1 |
2 |
3 |
4 |
Exports |
185.3 |
134.2 |
104.2 |
Oil |
26.8 |
21.7 |
.. |
Non-oil |
158.5 |
112.5 |
.. |
Imports |
303.7 |
234.4 |
170.2 |
Oil |
91.3 |
76.5 |
50.1 |
Non-oil |
212.4 |
157.8 |
120.1 |
Trade Balance |
-118.4 |
-100.2 |
-66.1 |
Non-Oil Trade |
|
|
|
Balance |
-53.9 |
-45.3 |
.. |
Variation (per cent) |
Exports |
13.7 |
32.7 |
-22.4 |
Oil |
-5.4 |
25.7 |
.. |
Non-oil |
17.8 |
34.1 |
.. |
Imports |
20.8 |
43.6 |
-27.4 |
Oil |
14.6 |
60.8 |
-34.5 |
Non-oil |
23.6 |
36.5 |
-23.9 |
R: Revised. P: Provisional. .. Not Available
Source: DGCI&S. |
Balance of Payments (BoP)
Current Account
III.16 Notwithstanding the sequential quarterly recovery in the world output and world merchandise exports in the third quarter of 2009, the persistence of depressed global demand continued to impinge on the current account position of India. The decline in the growth of exports and imports persisted even during the second quarter of 2009-10. India’s merchandise exports (on BoP basis), recorded a decline of 21.0 per cent in July-September 2009 as against a strong growth of 39.6 per cent during the corresponding period of the previous year. The contraction in imports that began in the fourth quarter of 2008-09- after a gap of almost seven years- continued through the second quarter of 2009-10. Imports (on BoP basis), registered a decline of 19.6 per cent in the second quarter of 2009-10 as compared to robust growth of 54.8 per cent in the corresponding period of the previous year. The decline in imports resulted from contraction in both oil and non-oil imports. Trade deficit, however, was lower (US$ 32.2 billion) during the second quarter of 2009-10 as compared with the corresponding quarter of the previous year (US$ 39.1 billion), reflecting larger fall in imports, especially oil imports, on account of lower oil prices. For the first half of 2009-10 (April-September) also, trade deficit remained lower (US $ 58.2 billion) as compared with the corresponding period of the preceding year (US $ 64.4 billion), mainly on account of decline in oil imports. Exports and imports during the second quarter were, however, higher than in the first quarter. As the absolute increase in imports was higher than the increase in exports, the trade deficit in the second quarter of 2009-10 was higher than that of the first quarter (Table 3.8).
Invisibles
III.17 Mirroring the adverse impact of the global financial crisis, invisibles receipts, comprising services, current transfers and income, registered a decline of 15.1 per cent in the second quarter of 2009-10 as against a growth of 33.1 per cent in the corresponding period of the previous year (Table 3.9). Major components of services exports, including software services exports, registered a decline during the quarter. Private transfer receipts, comprising mainly remittances from Indians working overseas and local withdrawals from NRI Rupee deposits,however, were sustained during the quarter. Invisibles payments, in turn, recorded a marginal increase during the quarter, mainly on account of payments under business and financial services. Overall, the net invisibles (i.e., invisibles receipts minus invisibles payments) were lower during the quarter as compared with the corresponding period of the previous year, mainly due to the decline in services exports, particularly non-software services receipts.
Table 3.8: India's Balance of Payments |
(US $ billion) |
|
|
2007-08 April-March
|
2008-09 PR April-March
|
2008-09 |
2009-10 |
Q1 |
Q2 |
Q3 |
Q4 |
Q1 |
Q2 |
PR |
PR |
PR |
PR |
PR |
P |
1 |
2 |
3 |
4 |
5 |
6 |
7 |
8 |
9 |
1. |
Exports |
166.2 |
189.0 |
57.5 |
53.6 |
39.4 |
38.5 |
38.8 |
42.4 |
2. |
Imports |
257.6 |
307.7 |
82.7 |
92.8 |
73.5 |
58.7 |
64.8 |
74.6 |
3. |
Trade Balance (1-2) |
-91.5 |
-118.7 |
-25.3 |
-39.1 |
-34.0 |
-20.2 |
-26.0 |
-32.2 |
4. |
Net Invisibles |
75.7 |
89.9 |
22.0 |
26.5 |
22.4 |
19.0 |
20.0 |
19.6 |
5. |
Current Account Balance (3+4) |
-15.7 |
-28.7 |
-3.3 |
-12.6 |
-11.7 |
-1.2 |
-6.0 |
-12.6 |
6. |
Gross Capital Inflows |
438.4 |
312.4 |
94.4 |
90.0 |
68.7 |
59.4 |
77.2 |
98.1 |
7. |
Gross Capital Outflows |
331.8 |
305.2 |
89.5 |
82.9 |
74.8 |
58.0 |
71.3 |
74.5 |
8. |
Net Capital Account (6-7) |
106.6 |
7.2 |
4.9 |
7.1 |
-6.1 |
1.4 |
6.0 |
23.6 |
9. |
Overall Balance (5+8)# |
92.2 |
-20.1 |
2.2 |
-4.7 |
-17.9 |
0.3 |
0.1 |
9.4 |
Memo: |
i. |
Export growth (%) |
28.9 |
13.7 |
57.0 |
39.6 |
-8.4 |
-20.0 |
-32.5 |
-21.0 |
ii. |
Import growth (%) |
35.1 |
19.4 |
46.8 |
54.8 |
9.2 |
-20.8 |
-21.7 |
-19.6 |
iii. |
Trade balance (as a % of GDP) |
-7.8 |
-10.3 |
|
|
|
|
|
|
iv. |
Invisible receipts growth (%) |
30.0 |
9.8 |
31.8 |
33.1 |
5.4 |
-18.3 |
-7.5 |
-15.1 |
v. |
Invisibles payments growth (%) |
17.3 |
0.6 |
18.5 |
12.0 |
2.4 |
-20.8 |
-5.6 |
0.2 |
vi. |
Net invisibles growth (%) |
45.0 |
18.7 |
44.6 |
54.2 |
8.0 |
-15.8 |
-9.0 |
-26.3 |
vii. |
CAD as a % of GDP |
-1.3 |
-2.5 |
|
|
|
|
|
|
viii. |
Net capital flows as a % of GDP |
9.1 |
0.6 |
|
|
|
|
|
|
ix. |
Foreign Exchange Reserves
(as at end period) |
309.7 |
252.0 |
312.1 |
286.3 |
256.0 |
252.0 |
265.1 |
281.3 |
# Overall balance also includes errors and omissions apart from items 5 and 8. PR: Partially Revised. P: Preliminary. |
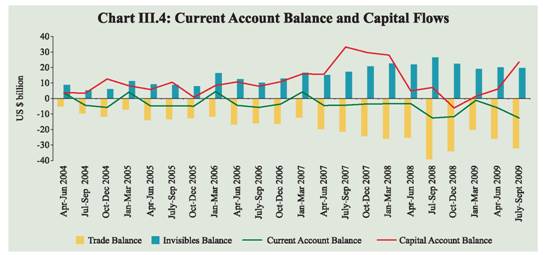
III.18 During the first half of 2009-10 both invisibles receipts (except private transfer receipts) and payments also registered a decline as compared with the corresponding period of the previous year.The decline in invisibles receipts was mainly attributed to the lower receipts under almost all the components of services. Invisibles payments declined, mainly due to lower payments towards travel, transportation, non-software services and private transfers. Consequently, net invisibles stood lower during the first half of 2009-10 as compared with the corresponding period of the previous year. At this level, the invisibles surplus financed about 68.0 per cent of trade deficit during April-September 2009 as against 75.4 per cent during April-September 2008. The current account deficit during the second quarter of 2009-10 remained almost at the same level (US$ 12.6 billion) as during the second quarter of 2008-09, though it represented significant increase over the level in the first quarter of 2009-10. However, despite lower trade deficit, the current account deficit increased to US $ 18.6 billion during April-September 2009 from US $ 15.8 billion in April-September 2008, mainly due to lower net invisibles surplus. During 2008-09, the current account deficit as a per cent of GDP stood higher at 2.5 per cent as compared to 1.3 per cent a year ago (Chart III.4).
Table 3.9: Invisibles Gross Receipts and Payments |
(US $ billion) |
Item |
Invisibles Receipts |
Invisibles Payments |
April-March |
April-September |
July-September |
April-March |
April-September |
July-September |
2008-09 |
2008-09 |
2009-10 |
2008-09 |
2009-10 |
2008-09 |
2008-09 |
2009-10 |
2008-09 |
2009-10 |
PR |
PR |
P |
PR |
P |
PR |
PR |
P |
PR |
P |
1 |
2 |
3 |
4 |
5 |
6 |
7 |
8 |
9 |
10 |
11 |
1. |
Travel |
10.9 |
5.3 |
4.8 |
2.8 |
2.5 |
9.4 |
4.9 |
4.4 |
2.7 |
2.4 |
2. |
Transportation |
11.3 |
5.7 |
5.1 |
3.0 |
2.6 |
12.8 |
7.1 |
5.0 |
3.8 |
2.2 |
3. |
Insurance |
1.4 |
0.7 |
0.8 |
0.4 |
0.4 |
1.1 |
0.5 |
0.7 |
0.3 |
0.3 |
4. |
Govt. not included elsewhere |
0.4 |
0.2 |
0.2 |
0.08 |
0.1 |
0.8 |
0.2 |
0.2 |
0.1 |
0.1 |
5. |
Miscellaneous |
77.7 |
39.1 |
29.2 |
21.6 |
14.3 |
27.9 |
13.2 |
14.4 |
6.7 |
8.5 |
| |
Of which:Software |
46.3 |
24.2 |
21.4 |
12.1 |
10.6 |
2.8 |
1.8 |
0.8 |
0.9 |
0.4 |
| |
Non-Software |
31.4 |
14.9 |
7.8 |
9.5 |
3.7 |
25.1 |
11.4 |
13.6 |
5.8 |
8.1 |
6. |
Transfers |
47.5 |
26.6 |
27.6 |
13.8 |
14.3 |
2.7 |
1.5 |
1.0 |
0.8 |
0.6 |
| |
Of which:Private Transfers |
46.9 |
26.4 |
27.5 |
13.7 |
14.2 |
2.3 |
1.3 |
0.8 |
0.7 |
0.5 |
7. |
Income |
14.3 |
7.7 |
7.7 |
4.1 |
4.7 |
18.8 |
9.4 |
10.1 |
4.9 |
5.1 |
| |
Investment Income |
13.5 |
7.3 |
7.3 |
3.9 |
4.5 |
17.5 |
8.7 |
9.4 |
4.6 |
4.8 |
| |
Compensation of Employees |
0.8 |
0.4 |
0.4 |
0.3 |
0.2 |
1.3 |
0.7 |
0.7 |
0.3 |
0.4 |
Total (1 to 7) |
163.5 |
85.3 |
75.4 |
45.8 |
38.9 |
73.6 |
36.7 |
35.8 |
19.3 |
19.3 |
PR: Partially Revised. P: Preliminary. |
 Capital Account
III.19 The revival in capital flows witnessed during the first quarter of 2009-10 gathered momentum during the second and third quarters. Both gross capital inflows and outflows rose during the period (see Chart III. 4 and Table 3.10).
III.20 Component-wise, net inward FDI continued to remain upbeat during the second quarter of 2009-10, reflecting relatively better growth prospects of the Indian economy. Portfolio investments continued their upward trend, mainly due to the revival in FII inflows since the first quarter of 2009-10. Inflows under portfolio investment were led by large purchases of equities by FIIs in the Indian stock market and revival in net inflows under American Depository Receipts (ADRs)/ Global Depository Receipts (GDRs) due to resurgence in stock prices of Indian companies.
Table 3.10: Net Capital Flows |
(US $ billion) |
Item |
2007-08 April-March
|
2008-09 April-March PR
|
2008-09 |
2009-10 |
Q1 PR |
Q2 PR |
Q3 PR |
Q4 PR |
Q1 PR |
Q2 P |
1 |
2 |
3 |
4 |
5 |
6 |
7 |
8 |
9 |
1. |
Foreign Direct Investment (FDI) |
15.9 |
17.5 |
9.0 |
4.9 |
0.5 |
3.2 |
7.0 |
7.1 |
| |
Inward FDI |
34.7 |
35.0 |
11.9 |
8.8 |
6.3 |
8.0 |
9.7 |
11.3 |
| |
Outward FDI |
18.8 |
17.5 |
2.9 |
3.9 |
5.9 |
4.8 |
2.6 |
4.2 |
2. |
Portfolio Investment |
27.4 |
-14.0 |
-4.2 |
-1.3 |
-5.8 |
-2.7 |
8.3 |
9.7 |
| |
Of which: |
|
|
|
|
|
|
|
|
| |
FIIs |
20.3 |
-15.0 |
-5.2 |
-1.4 |
-5.8 |
-2.6 |
8.2 |
7.0 |
| |
ADR/GDRs |
6.6 |
1.2 |
1.0 |
0.1 |
0.00 |
0.02 |
0.04 |
2.7 |
3. |
External Assistance |
2.1 |
2.6 |
0.4 |
0.5 |
1.0 |
0.8 |
0.08 |
0.5 |
4. |
External Commercial Borrowings |
22.6 |
7.9 |
1.5 |
1.7 |
3.8 |
1.0 |
-0.4 |
1.2 |
5. |
NRI Deposits |
0.2 |
4.3 |
0.8 |
0.3 |
1.0 |
2.2 |
1.8 |
1.0 |
6. |
Banking Capital excluding |
|
|
|
|
|
|
|
|
| |
NRI Deposits |
11.6 |
-7.5 |
1.9 |
2.0 |
-6.0 |
-5.4 |
-5.2 |
3.4 |
7. |
Short-term Trade Credits |
15.9 |
-1.9 |
4.5 |
0.4 |
-4.2 |
-2.6 |
-1.5 |
0.8 |
8. |
Rupee Debt Service |
-0.1 |
-0.1 |
-0.03 |
-0.03 |
- |
-0.07 |
-0.02 |
-0.01 |
9. |
Other Capital |
11.0 |
-1.5 |
-8.9 |
-1.4 |
3.7 |
5.1 |
-4.1 |
-0.1 |
Total (1 to 9) |
106.6 |
7.2 |
4.9 |
7.1 |
-6.1 |
1.4 |
6.0 |
23.6 |
PR: Partially Revised. P: Preliminary. |
III.21 During the first half of 2009-10 also, net capital flows were higher, mainly driven by foreign investment inflows, particularly reflecting the turnaround in FII inflows. In banking capital, net inflows under NRI deposits remained higher. Net inward FDI into India remained buoyant during April-September 2009 as compared to the level in April-September 2008. During this period, FDI was channelled mainly into the manufacturing sector, followed by communication services and real estate sector. Inflows under net external commercial borrowings (ECBs), however, remained lower during the period. Short term trade credit recorded a net outflow during April-September 2009 as against a net inflow during the corresponding period of the previous year.
III.22 The latest available information on
certain indicators of the capital account
indicates that the revival in capital flows,
which started at the beginning of 2009-10
and gathered momentum in the second
quarter, have remained buoyant even in the
third quarter (Table 3.11). The better than
expected macroeconomic performance of
India during 2009-10 and positive
sentiments of global investors about India’s
growth prospects are the factors primarily
responsible for sustained capital inflows
during the year so far.
Foreign Exchange Reserves
III.23 On BoP basis (i.e., excluding
valuation effects), the foreign exchange
reserves increased by US$ 9.5 billion
during April-September 2009 as against a
decline of US$ 2.5 billion during April-
September 2008. The valuation gain,
reflecting the depreciation of the US dollar
against the major currencies, was US$ 19.8
billion during April-September 2009 as compared with a valuation loss of US$ 20.9 billion during April-September 2008. Accordingly, valuation gain during April-September 2009 accounted for 67.5 per cent of the total increase in foreign exchange reserves (Chart III.5).
Table 3.11: Capital Flows in 2009-10 so far |
(US $ billion) |
Component |
Period |
2008-09 |
2009-10 |
1 |
2 |
3 |
4 |
FDI to India |
April-Nov. |
23.3 |
25.0 |
FIIs (net) |
April-Jan.* |
-12.1 |
24.7 |
ADRs/GDRs |
April-Nov. |
1.1 |
3.1 |
ECB Approvals |
April-Nov. |
13.0 |
12.3 |
NRI Deposits (net) |
April-Dec. |
2.1 |
3.2 |
* : Up to January 15, 2010.
FDI: Foreign Direct Investment.
FIIs: Foreign Institutional Investors’ Investment.
ECB: External Commercial Borrowings.
NRI: Non Resident Indians.
ADR: American Depository Receipts
GDR: Global Depository Receipts. |
 III.24 The IMF made allocations of SDRs to India in two tranches, viz., general allocation of SDR 3,082 million (equivalent to US$ 4.82 billion) on August 28, 2009 and a special allocation of SDR 214.6 million (equivalent to US$ 0.34 billion) on September 9, 2009, resulting in an increase in India’s foreign exchange reserves by US$ 5.16 billion during the second quarter of 2009-10 (July-September).
III.25 India’s foreign exchange reserves increased by US $ 33.2 billion during 2009-10 so far (up to January 15, 2010) to US $ 285.2 billion (Table 3.12). The increase in reserves during the period reflects valuation gains and also the net surplus in the overall balance portion in the balance of payments. Furthermore, the Reserve Bank purchased 200 metric tonnes of gold from the IMF on November 3, 2009 as part of its foreign exchange reserves management operations. The foreign exchange reserves, however, remain unaffected by the gold transaction, since the gold purchase reflects only a substitution of foreign currency assets.
External Debt
III.26 India’s external debt of US$ 242.8 billion as at end-September 2009 represents an increase of US$ 18.2 billion (8.1 per cent) over its end-March 2009 level, mainly on account of increase in long term debt (Table 3.13). As at end-September 2009, the long-term debt increased by 10.6 per cent over its end-March 2009 level, while the short-term debt registered a decline of 2.3 per cent. Of the total increase (US$ 18.2 billion) in India’s external debt, the valuation effect on account of depreciation of US dollar against major international currencies accounted for US$ 8.3 billion (45.6 per cent). The increase in total external debt also reflected the impact of inclusion of cumulative SDR allocations to India by the IMF as a long-term liability in the external debt statistics.
Table 3.12: Foreign Exchange Reserves |
(US $ million) |
End of Month |
Gold |
SDR@ |
Foreign
Currency
Assets* |
Reserve
Position
in the IMF |
Total (2+3+4+5) |
Memo:
Outstanding Net Forward Sales (-) /Purchases (+) of
US dollar by the Reserve Bank at the end of the month |
1 |
2 |
3 |
4 |
5 |
6 |
7 |
March 2000 |
2,974 |
4 |
35,058 |
658 |
38,694 |
(-) 675 |
March 2005 |
4,500 |
5 |
135,571 |
1,438 |
141,514 |
- |
March 2006 |
5,755 |
3 |
145,108 |
756 |
151,622 |
- |
March 2007 |
6,784 |
2 |
191,924 |
469 |
199,179 |
- |
March 2008 |
10,039 |
18 |
299,230 |
436 |
309,723 |
(+) 14,735 |
March 2009 |
9,577 |
1 |
241,426 |
981 |
251,985 |
(-) 2,042 |
April 2009 |
9,231 |
1 |
241,487 |
983 |
251,702 |
(-) 1,071 |
May 2009 |
9,604 |
1 |
251,456 |
1,245 |
262,306 |
(+) 131 |
June 2009 |
9,800 |
1 |
254,093 |
1,248 |
265,142 |
(+) 745 |
July 2009 |
9,671 |
1 |
260,631 |
1,338 |
271,641 |
(+) 800 |
August 2009 |
9,828 |
4,828 |
261,247 |
1,349 |
277,252 |
(+) 619 |
September 2009 |
10,316 |
5,224 |
264,373 |
1,365 |
281,278 |
(+) 539 |
October 2009 |
10,800 |
5,242 |
266,678 |
1,581 |
284,391 |
(+) 435 |
November 2009 |
18,182# |
5,309 |
263,191 |
1,464 |
288,146 |
(+) 500 |
December 2009 |
18,292 |
5,169 |
258,583 |
1,425 |
283,469 |
- |
January 2010## |
18,292 |
5,181 |
260,259 |
1,429 |
285,161 |
- |
@ : Include SDRs 3,082.5 million allocated under general allocation and SDRs 214.6 million allocated under special allocation by the IMF done on August 28, 2009 and September 9, 2009, respectively.
* : Excludes US$ 250 million invested in foreign currency denominated bonds issued by IIFC(UK) since March
20, 2009
# : Includes US$ 6,699 million reflecting the purchase of 200 metric tonnes of gold from IMF on November 3, 2009.
## : As on January 15, 2010. – : Not available. |
Table 3.13: India's External Debt |
(US $ billion) |
Item |
End-March 2008 PR |
End-March 2009 PR |
End-June 2009 PR |
End-September 2009 P |
Variation
(September 2009 over March 2009) |
Amount |
Per cent |
1 |
2 |
3 |
4 |
5 |
6 |
7 |
1. |
Multilateral |
39.5 |
39.5 |
41.2 |
42.4 |
2.8 |
7.1 |
2. |
Bilateral |
19.7 |
20.6 |
21.4 |
22.1 |
1.5 |
7.1 |
3. |
International Monetary Fund |
1.1 |
1.0 |
1.1 |
6.3 |
5.3 |
519.4 |
4. |
Trade Credit (above 1 year) |
10.4 |
14.6 |
14.9 |
15.4 |
0.8 |
5.5 |
5. |
External Commercial Borrowings |
62.3 |
62.4 |
63.0 |
66.8 |
4.4 |
7.0 |
6. |
NRI Deposits |
43.7 |
41.6 |
44.6 |
46.0 |
4.4 |
10.6 |
7. |
Rupee Debt |
2.0 |
1.5 |
1.6 |
1.6 |
0.07 |
4.8 |
8. |
Long-term (1 to 7) |
178.7 |
181.2 |
187.8 |
200.4 |
19.2 |
10.6 |
9. |
Short-term |
45.7 |
43.4 |
42.0 |
42.4 |
-1.0 |
-2.3 |
Total (8+9) |
224.4 |
224.6 |
229.8 |
242.8 |
18.2 |
8.1 |
Memo: |
(per cent) |
Total Debt /GDP |
19.0 |
21.5 |
- |
|
|
|
Short-term Debt/Total Debt |
20.4 |
19.3 |
18.3 |
17.5 |
|
|
Short-term Debt/Reserves |
14.8 |
17.2 |
15.9 |
15.1 |
|
|
Concessional Debt/Total Debt |
19.7 |
18.7 |
18.9 |
18.4 |
|
|
Reserves/Total Debt |
138.0 |
112.1 |
115.4 |
115.8 |
|
|
Debt Service Ratio |
4.7 |
4.4 |
5.6 |
4.9 |
|
|
P: Provisional. PR: Partially Revised. |
III.27 The ratio of short-term to total debt declined to 17.5 per cent at end-September 2009 from 19.3 per cent at end-March 2009. The ratio of short term debt to foreign exchange reserves moderated to 15.1 per cent as at end-September 2009 from 17.2 per cent as at end-March 2009. In terms of currency composition, US dollar denominated debt accounted for 51.4 per cent of the total external debt at end-September 2009. India’s debt service ratio, i.e., debt servicing as a percentage of current receipts, remained low but rose to 4.9 per cent during April-September 2009 from 3.7 per cent a year ago.
III.28 As per residual maturity of the debt stock, an indicator for assessing the potential debt service liability in the short-run, the short-term debt (below one year) as at end-September 2009 stood at US$ 93.2 billion. This includes short-term debt based on original maturity at US$ 42.4 billion and long- term external debt due for payments within one year of US$ 50.8 billion. The share of NRI deposits in the total long term debt due for repayment within one year worked out to 79.8 per cent (US$ 36.7 billion) as at end-September 2009.
International Investment Position
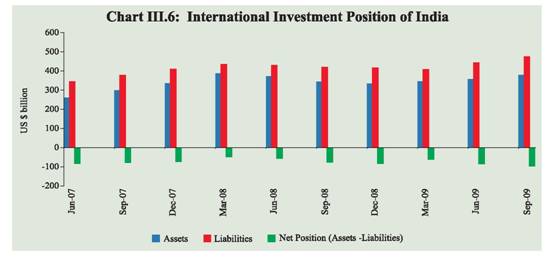
III.29 As at end-September 2009, India’s net international liabilities were placed at US$ 97.8 billion, which was higher than US$ 86.1 billion as at end-June 2009. The international assets increased from US$ 357.6 billion at end-June 2009 to US$ 378.6 billion at end-September 2009, mainly on account of increase in reserve assets during the quarter. The increase in international liabilities from US$ 443.7 billion to US$ 476.4 billion during the same period was on account of an increase in inward direct investment, portfolio equity investment, loans to India and allocations of SDRs by the IMF to India (Chart III.6).
III.30 Thus, the balance of payments position of India remained comfortable with modest current account deficit, buoyant capital inflows and net accretion to foreign exchange reserves in the second quarter of 2009-10. During the third quarter also, the trend continued. More importantly, merchandise exports have turned around in November 2009, after thirteen consecutive months of decline and the pace of decline in imports has also significantly moderated, suggesting the impact of strong recovery in economic growth on import demand.
 |
 IST,
IST,