 IST,
IST,
III. The External Economy
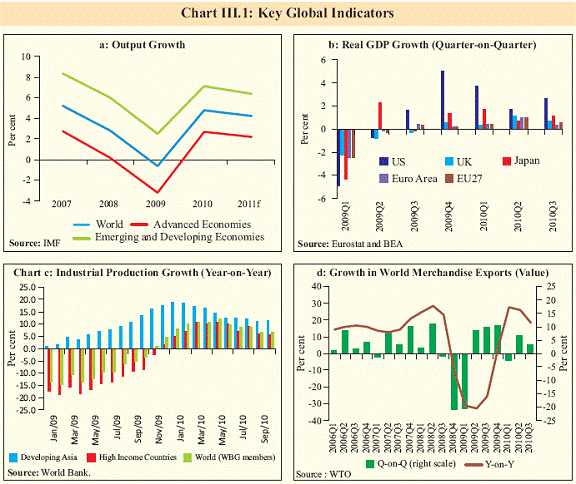
India’s external sector situation was characterised by a higher level of current account deficit and dominance of portfolio flows in Q2 of 2010-11. This may pose policy concerns going forward. Higher trade deficit and lower support from net invisibles led to a higher current account deficit. Even though export growth remained reasonably strong, robust import demand resulting from high domestic growth led to a large expansion in the size of the trade deficit. Higher net capital flows were better absorbed by the widening current account deficit, leading to a moderate accretion to reserves. External liabilities, however, increased at a faster pace than external assets. The composition of capital flows also changed considerably, with large increase in portfolio flows and lower FDI inflows. India’s export growth remained strong in Q3 of 2010-11 notwithstanding persisting positive inflation differential. Ongoing developments such as volatility in the exchange rate of key currencies and pressure on commodity prices could have implications for India. Uneven pace of growth across regions continues, though the recent performance of advanced economies has been better than earlier expected III.1 The multi-speed recovery in the global economy that was observed in the first half of 2010 became more entrenched in the second half, as the advanced economies faced greater uncertainty while the emerging market economies (EMEs) experienced consolidation of growth around trend. The advanced economies which faced the prospect of doubledip recession, have in fact outperformed GDP growth forecasts made a year ago. The sovereign debt crises of Greece in May 2010 and Ireland in November 2010 and the evolving fiscal situation in Portugal, Italy and Spain added to the uncertainty regarding global recovery. EMEs, led by China and India, continue to grow at a faster rate compared to the advanced economies. In December 2010, OECD projected world real GDP growth at 4.6 per cent. In October 2010, IMF had projected world real GDP growth at 4.8 per cent (Chart III.Ia). Among advanced economies, there was a divergent trend in growth during the third quarter vis-a-vis the previous quarter (Chart III.1b). Apart from the possibility of sovereign debt crisis spreading to other advanced economies, the downside risks to growth projections for advanced economies could stem from the vulnerabilities related to continued weakness in financial systems, ongoing household balance sheet deleveraging and tensions that may arise from country specific response to global imbalances. The ILO expects the employment situation in advanced economies to reach the pre-crisis level only by 2015. Persistent high unemployment and uncertain growth outlook have complicated decisions on policy exit. World trade recovery continues, though industrial output growth decelerates III.2 Growth in world industrial production exhibited signs of deceleration after attaining a peak in May 2010, partly reflecting the base effect (Chart III.1c). Trade activities, however, have sustained the momentum of a strong recovery, prompting the WTO in December 2010 to retain its September 2010 estimates for growth in merchandise trade volume at 13.5 per cent for 2010 (Chart III.1d). This high growth, however, needs to be seen against the low base that resulted from the sharp 12.2 per cent contraction experienced in 2009. In value terms, even after expanding by 23 per cent during the first three quarters of 2010, world merchandise trade remained below the peak level attained before the financial crisis. At 30 per cent, Asian exports increased at a significantly faster rate during the third quarter of 2010 on a year-onyear basis than the 18 per cent growth for world merchandise trade. With deficient domestic demand and high unemployment rate in advanced economies, protectionism remains a possible response, which could hinder overall global recovery.
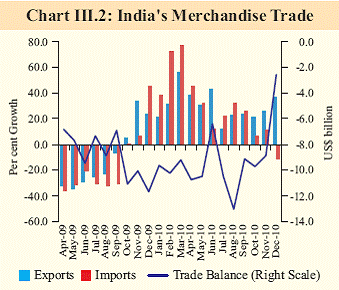
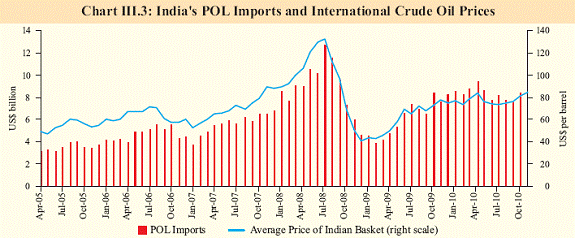
Emerging Asia exhibits robust growth but rising inflation and larger capital flows pose policy dilemma for central banks III.3 In December 2010, the ADB revised upward its assessment of growth of developing Asia to 8.5 per cent for 2010 from 8.2 per cent made in September, to reflect the robust expansion of the third quarter, mainly in Eastern and Central Asian countries. Recent data, however, point to some deceleration in economic activity and accordingly, real GDP growth for the region is projected at 7.3 per cent for 2011. IMF projections made in January 2011 also suggest real GDP growth of 7 per cent for 2011 for Asia, down from 8 per cent in 2010. Going forward, emerging inflationary pressures reflecting the shrinking output gap and firming global commodity prices could prompt monetary tightening. Sensitivity of capital inflows to such actions and policy options to deal with larger inflows that, at times, could be distortive, will complicate policy decisions. India’s export growth has remained strong but trade deficit for the year so far has widened III.4 After witnessing a turnaround in October 2009, India’s export growth maintained the momentum despite the fading out of the base effect (Chart III.2). India’s export growth has also been better than the global recovery in exports, reflecting the diversification of the export basket as well as the export destinations. Since October 2009, imports have also registered strong growth. During October and November 2010, however, there was a slowdown followed by a decline during December. The growth in imports has primarily been led by oil, pearls and semi precious stones. Rising crude oil prices along with growth in quantity of oil imports has led to the higher oil import bill (Chart III.3). Though the growth of exports has outpaced imports growth during April-December 2010, the trade deficit has widened in absolute terms (Table III.1). In Q3 of 2010-11, with export growth significantly exceeding the import growth, the trade balance improved relative to the first two quarters.
Current account deficit widened significantly reflecting larger trade deficit and subdued net invisibles surplus III.5 The rise in trade deficit (on BoP basis) led to a further widening of the current account deficit during the second quarter of 2010-11, on the back of stagnation in net invisibles surplus, partly due to the continuing growth imbalance between India and the rest of the world (Table III.2). III.6 The moderation in net invisibles surplus during the quarter relative to the corresponding quarter of the previous year was mainly on account of decline in net investment income and private transfers, which offset the increase in net services (Table III.3). The decline in net income was mainly on account of decline in investment income receipts by 62.0 per cent during the quarter (as against an increase of 17.9 per cent a year ago), reflecting the persistence of lower interest rates abroad. Within services, software exports continued to be robust reflecting geographical diversification as well as enhanced operational efficiencies. Business services (mainly covering trade related, business & management consultancy, architectural & engineering services as well as maintenance of offices abroad) recorded lower net outflows mainly on account of robust recovery in receipts.
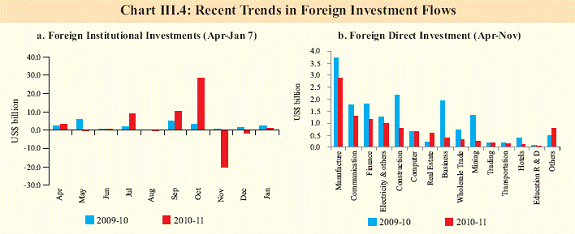
Larger net capital inflows were absorbed in financing the higher current account deficit, but the composition of capital flows poses sustainability risks III.7 The buoyancy in capital inflows continued during the second quarter of 2010- 11 driven by large inflows under FII investments along with steady inflows under short-term trade credits and external commercial borrowings (ECBs) (Table III.4). FDI, however, moderated mainly on account of lower FDI inflows under construction, real estate, business and financial services. Equity flows accounted for about 79 per cent of net capital flows during the first half of 2010-11, of which the share of FII investment was 77 per cent. Net inflows under ECBs and shortterm trade credits reflected improved access to global financial markets and the need for financing higher demand for imports. Nonresident Indian (NRI) deposits continued to be steady, largely reflecting the interest rate differentials.
III.8 Latest available information on certain
lead indicators of capital flows suggests
continued buoyancy (Table III.5). However, FII
Moderation in FDI flows needs policy attention III.9 The recent moderation in FDI flows to India has to be seen in the context of overall global trends, particularly, flows to other EMEs. During 2009-10, the decline in net FDI flows to India was relatively moderate (12 per cent) compared to EMEs (estimated to be 33 per cent in 2009), which partly reflected subdued crossborder merger and acquisition (M&A) activities and weaker return prospects for foreign affiliates. Subsequently, FDI flows to EMEs recovered modestly on the back of improved corporate profitability and some improvement in M&A activities. However, net FDI flows to India declined by almost 36 per cent, year-onyear, during April-September 2010. According to the latest estimates of UNCTAD (January 2011), FDI flows to major EMEs like China, Brazil, Mexico and Thailand recorded increases in the range of 6-53 per cent in 2010. Notably, Indonesia recorded about a three-fold rise in FDI inflows. III.10 The moderation in FDI inflows to India during April-November 2010 has been driven by sectors such as construction, mining and business services. A major reason for the decline in inward FDI is reported to have been the environment sensitive policies pursued, as manifested in the recent episodes in the mining sector, integrated township projects and construction of ports, which appear to have affected the investors’ sentiments. Added to this are the persistent procedural delays, land acquisition issues and availability of quality infrastructure, which remain at the centre of the Government’s policy focus. These factors, which are more structural in nature, if addressed expeditiously, could raise the share of India in the projected FDI flows to EMEs in the near future. According to the IIF, net FDI flows to EMEs are forecast to increase by 11 per cent in 2011.
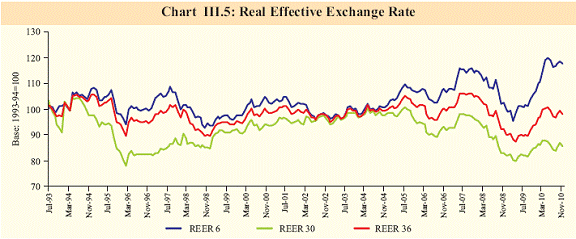
Reserve accretion during the year so far has been moderate as, despite higher net capital inflows, the financing need in the current account increased III.11 As the surplus in the capital account exceeded the financing gap in the current account, India’s foreign exchange reserves (excluding valuation effects) increased by US$ 7.0 billion during the first half of 2010-11. Inclusive of valuation effects, the foreign exchange reserves increased by US$ 13.8 billion. Foreign exchange reserves as on January 14, 2011 stood at US$ 297.4 billion. Indicators of Real Effective Exchange Rate (REER) showed a divergence reflecting inflation differential III.12 There has been a distinct divergence between the movements of 6-currency and 36- currency REER indices during the year so far. While the 6-currency REER remained above the base level by 16 to 20 per cent, signifying higher inflation differentials with these economies, the 36 country REER largely remained below or around the base level, implying that inflation in India has been comparable or below the level prevailing in its trading partners in the developing world. The magnitude of nominal exchange rate appreciation/depreciation of the currencies of these countries also differed. This is reflected in the 30-currency REER (which is derived after the exclusion of 6-currency index from the 36- currency index) (Chart III.5). Some external debt parameters have deteriorated
III.13 External debt stock as at end-September 2010 increased by 12.8 per cent to US$ 295.8 billion from US$ 262.3 billion at end-March 2010, with ECBs and short-term debt contributing around 71 per cent of the total increase (Table III.6). Valuation effects due to depreciation of the US dollar against other major currencies accounted for nearly 19 per cent of the rise in external debt during this period. With higher private debt flows, there has been some worsening of debt parameters during the first half of 2010-11, though still very much within the comfort zone.
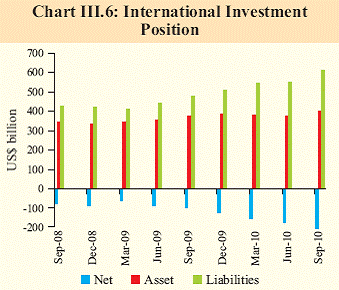
International Investment Position (IIP) shows deterioration III.14 Incremental liabilities outpaced incremental assets in the IIP in the second quarter of 2010-11. Net international liabilities increased by US$ 33.2 billion during the second quarter to US$ 211.1 billion at end-September 2010 (Chart III.6). Significant widening of current account deficit would necessitate larger and stable long-term capital flows to limit risks to medium-term sustainability III.15 Recent trends in export growth suggest the possibility of exports surpassing the annual target for the current year. It is, however, imperative to diversify the exports further in terms of commodities and destinations, given the weak and uncertain demand conditions in advanced economies. Higher global crude oil prices and non-oil commodity prices accompanied by stronger domestic economic activity could raise India’s import growth trajectory. If the improvement in the trade deficit witnessed in Q3 of 2010-11 continues, there may be some moderation in CAD from the high levels seen during the first two quarters. The upbeat growth outlook of India and rising interest rate differentials could be expected to attract even larger net capital inflows. A higher level of CAD along with the dominance of volatile and short-term debt creating flows could, however, pose some sustainability risks. A low inflation regime is also necessary so that any real appreciation of the exchange rate does not erode the competiveness of Indian exports. It is important to monitor the magnitude and composition of capital flows in the near term, given its potential implications for asset prices, exchange rate and the overall sustainability of the external sector.
Changing dynamics of BoP suggests the need to guard against vulnerabilities III.16 The dynamics of the balance of payments altered significantly in 2010-11. A higher current account deficit, compositional shifts in capital flows in favour of short-term debt and portfolio flows, lower order of reserve accretion and faster increase in external liabilities of the country relative to external assets are some key areas of concerns surfacing in the external sector. The BoP data released by the Reserve Bank report a CAD of 3.7 per cent of GDP during April-September 2010, which is higher than the sustainable level of around 3 per cent in the medium-term. Although financing of such a deficit has not been a problem so far, the changing composition of capital flows for financing the deficit calls for an assessment of the external sector vulnerability indicators. III.17 Reflecting the dominance of debt creating flows during April-September 2010 (almost 50 per cent compared to the average share of about 44 per cent during the last one decade), debt sustainability indicators witnessed some deterioration at end-September 2010 (Table III.7). The debt service ratio, however, remained at a comfortable level. Given the dominance of debt creating flows and volatile FII flows, any unforeseen adverse global developments may pose risks and this warrants close monitoring of the evolving situation.
III.18 Widening of CAD and deterioration in vulnerability indicators are a result of several factors: First, lower growth in services receipts relative to payments reflecting the uneven pace of global recovery. Second, significant increase in imports relative to exports reflecting the steep rise in international crude oil prices, though in recent months trade balance has improved. Third, moderation in FDI inflows that was reported to have occurred on account of environment sensitive policies, land acquisition issues and availability of quality infrastructure. While the subdued growth of services receipts is cyclical in nature and can be expected to resolve with the global recovery becoming more broad-based and robust, the rise in crude oil prices and reasons for moderation in FDI are more structural in nature. Since supply of crude oil is relatively inelastic, the economy needs to adjust itself in the medium-term by investing in the use of non-conventional sources of energy. As regards FDI flows, the reform process needs to be expedited to address the impediments. III.19 The above assessment suggests that going forward, the external sector needs to be monitored closely. The economy is very well poised to absorb a higher current account deficit for a couple of years but this cannot remain a persisting trend. The challenge in this regard is to reduce the current account deficit in the medium-term and readjust its financing in the short term. The prospects for the medium-term adjustment will improve with the global recovery consolidating, FDI flows to India strengthening on the promise of growth prospects and the reform process being accelerated. |
||||||||||||||||||||||||||||||||||||||||||||||||||||||||||||||||||||||||||||||||||||||||||||||||||||||||||||||||||||||||||||||||||||||||||||||||||||||||||||||||||||||||||||||||||||||||||||||||||||||||||||||||||||||||||||||||||||||||||||||||||||||||||||||||||||||||||||||||||||||||||||||||||||||||||||||||||||||||||||||||||||||||||||||||||||||||||||||||||||||||||||||||||||||||||||||||||||||||||||||||||||||||||||||||||||||||||||||||||||||||||||||||||||||||||||||||||||||||||||||||||||||||||||||||||||||||||||||||||||||||||||||||||||||||||||||||||||||||||||||||||||||||||||||||||||||||||||||||||||||||||||||||||||||||||||||||||||||||
Page Last Updated on:


