 IST,
IST,
III. The External Sector
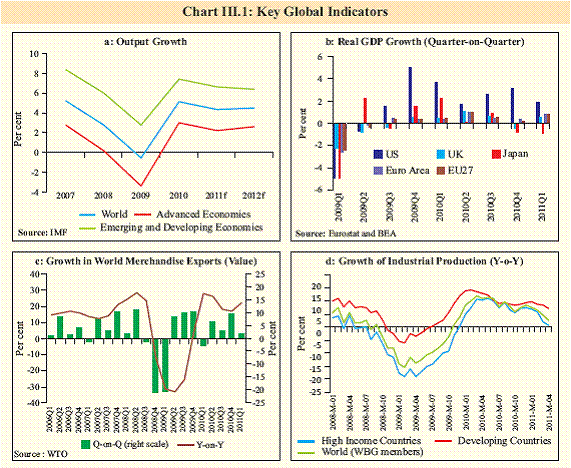
Better than expected performance of exports and invisibles receipts in Q4 of 2010-11 led to a considerable moderation in the current account deficit (CAD). With strong momentum in exports continuing during the first quarter, the current account is expected to remain manageable during 2011-12. Nevertheless, the size of current and capital accounts remains somewhat clouded in view of uncertain and uneven recovery in advanced economies (AEs), sovereign debt problems in the Euro zone periphery and volatile movements in global oil prices. While an improvement in FDI flows during the initial two months of 2011-12 augurs well for the economy, the volatility of flows, particularly with regard to portfolio investments as also the evolving composition of flows in favour of debt, remains a concern necessitating constant vigil. CAD moderated in 2010-11 III.1 The CAD moderated significantly during Q4 of 2010-11 with moderation in trade deficit coupled with an upturn in net invisibles surplus. Merchandise exports expanded at a faster pace than imports and the trade deficit shrank in absolute terms. The turnaround in invisibles was supported by higher earnings from software exports. Accordingly, CAD at 2.6 per cent of GDP during 2010-11 turned out to be lower than 2.8 per cent in 2009-10. Capital flows remained moderate and were substantially absorbed by the CAD. Going forward, the external account is expected to remain manageable. Risks to trade as global growth enters a soft patch III.2 There are risks to current account arising from global growth entering a soft patch (Chart III.1a). If growth in advanced economies (AEs) weakens further and the soft patch turns into a more prolonged downturn, exports could face a distinctly tougher climate. III.3 Global economic activity exhibited signs of slowing down in Q2 of 2011 as downside risks increased again. High commodity prices, political strife in the Middle East, the earthquake in Japan, sovereign debt problems in the Euro zone and rising fiscal and debt problems in the US took a toll on the levels of economic activity and business and consumer confidence. Private consumption is expected to be subdued as oil price hikes in the previous quarters cut into households’ real incomes. After GDP growth for US and Japan decelerated markedly in Q1 of 2011(Chart III.1b), PMIs for US and Euro zone and leading indicators for OECD evidenced a dip. Divergence between global economic activity of AEs and EMEs likely to remain in 2011 III.4 IMF has assessed that growth in most emerging and developing economies (EMDEs) would continue to be strong in 2011. Accordingly, the global economic recovery remains multi-paced with a further divergence in their growth rates. Moderation in commodity prices, especially oil, and government bond yields do offer hope for an economic turnaround during the second half of 2011. III.5 The termination of QE2 by the US in June, tightening of monetary policy in the Euro Area and most of the EMEs, and fiscal consolidation initiatives/austerity measures and deepening of debt crises in the Euro periphery could, however, depress global demand. Nonetheless, there remains a possibility of QE3 if the US economy fails to regain momentum in the second half of 2011. In the US, fiscal and sovereign debt risks are rising because of the absence of credible consolidation and reform plans, while in Japan, the fiscal response to the earthquake has raised challenges to mediumterm fiscal sustainability. Risks to capital flows as global fiscal and sovereign debt risks come to the fore III.6 There are risks to capital flows to EMEs arising from the global fiscal and sovereign debt risks. These risks have been evident in the Euro zone, where stress has come time and again, compelling multilateral action to bailout private investors by incurring higher sovereign debt. However, the approach has its limits. It can precipitate a sovereign debt crisis at some stage. While simmering fiscal risks and sovereign debt problems in AEs encourage capital inflows into EMEs, a full-blown crisis has a contagion risk that can adversely impact risk appetite and moderate capital flows all around. While we are currently seeing a surge in capital flows to India, net outflows were seen in March 2011, associated with elevated global risk aversion and increased concerns about inflation.
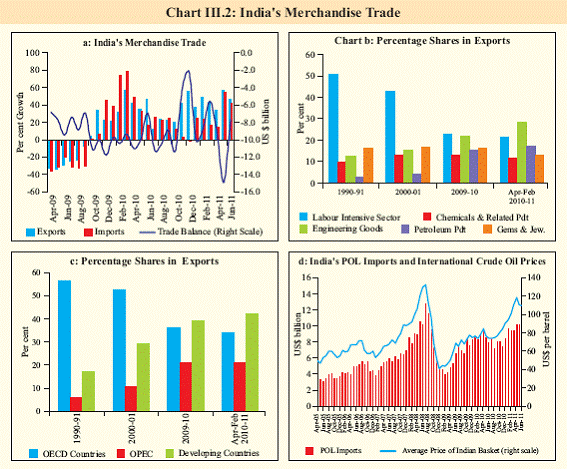
World trade recovers to exceed the pre-crisis high, but may moderate ahead III.7 Global trade is recovering with the value of world merchandise trade exceeding the pre-crisis high of July 2008 for the first time in March 2011. In value terms, the world trade was 22.3 per cent higher in the first quarter of 2011 compared to the same period of 2010 (Chart III.1c). On account of downside risks to growth, world trade growth, in volume terms, is expected to moderate in 2011. World industrial activity is progressing at a moderate pace III.8 Industrial output growth once again decelerated in the first quarter of 2011, after expanding toward the end of 2010, reflecting the decline in the Japanese production in March 2011 and similar declines in some of the North African countries (Chart III.1d). Excluding these countries, growth momentum in the rest of the world has been well above the longerterm trend growth rate. Exports continue to grow aided by trade diversification III.9 India’s merchandise exports during 2011- 12 so far (up to June) continued to register strong growth primarily led by engineering, gems and jewellery and petroleum products. The resilience in export performance appeared to have resulted from the supportive government policy, focussing on the diversification in terms of higher value-added products in engineering and petroleum sectors and destinations across developing economies. Trade policy is supporting exports through schemes like focus market scheme (FMS), focus product scheme (FPS) and duty entitlement passbook scheme (DEPB). This trend seems to have continued in the current year as well. III.10 Disaggregated data that are available up to February 2011 show that the share of developing economies in total exports improved, while the share of OECD countries declined. Countries like China and South Africa accounted for nearly 32 per cent of the increase in share of exports to developing countries. In terms of products, the share of engineering and petroleum products increased, while the share of labour intensive products declined (Chart III.2 a, b & c). Within engineering goods, transport equipment, metals and iron and steel were the major contributors to the rise in exports during the year. Trade deficit increases marginally, reflecting large non-oil imports III.11 During Q1 of 2011-12, though export growth continued to outstrip import growth, the trade deficit increased marginally in absolute terms. Import growth was primarily led by a spurt in gold and silver (a rise of 200 per cent) and machinery (49 per cent). However, growth in oil imports at 18 per cent has been lower than that during the corresponding period of the previous year, reflecting some moderation in demand (Chart III.2d and Table III.1).
Invisibles remain the mainstay of current account III.12 During Q4 of 2010-11, the current account balance improved further over the corresponding period of the previous year as well as the preceding quarter as a result of continued good performance of both merchandise and invisibles exports (Table III.2). Interestingly, the increase in oil exports offset the increase in oil imports implying that oil trade balance did not deteriorate further during 2010-11. III.13 Among invisibles receipts, services exports showed higher growth primarily due to software services, travel, transportation and business services. Private transfers remained buoyant despite uncertainties in MENA countries (Table III.3). III.14 A noteworthy aspect in respect of services data was the release by the Reserve Bank of provisional aggregate data on international trade in services for the first time for the month of April 2011 as a follow up of the implementation of the recommendations of the Working Group on Balance of Payments Manual for India (Chairman: Shri Deepak Mohanty). Henceforth, the aggregate data on trade in services will be released on a monthly basis after a gap of about 45 days.
Capital flows remain buoyant so far III.15 As per the latest available information for the period April-May 2011, FDI inflows increased significantly. The increase in FDI was largely led by power, healthcare and pharmaceutical sectors. Net FII flows exhibited a considerable volatility during 2011-12 so far (Please see Chapter IV for details). ECB approvals, however, continued to increase on the back of strong domestic demand and interest rate differentials (Table III.4). The volatility in FII flows warrants a continuous monitoring of the evolving situation.
III.16 Net capital flows during Q4 of 2010-11 were lower than those during the corresponding period of the previous year primarily due to a reversal in FII flows and lower net FDI flows (Table III.5). The moderation in inflows under FDI and short-term trade credits continued during the quarter. FDI moderated mainly on account of lower FDI inflows under services and ‘construction, real estate and mining’. Broad-based REER indices depreciate moderately during Q1 of 2011-12 III.17 In nominal as well as real terms, broadbased 30 and 36-currency indicators of effective exchange rate for rupee depreciated during Q1 of 2011-12 (Table III.6). The real effective exchange rate (REER) indices for 6-currency, however, showed a moderate appreciation, partly reflecting the higher inflation differential with the countries covered under the basket.
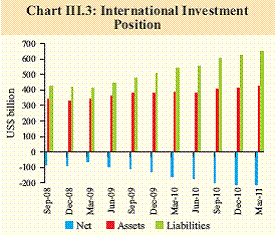
External debt indicators mixed, reserve accretion modest III.18 India’s external debt stock as at end-March 2011 showed an increase of 17.2 per cent over the level as at end-March 2010 reflecting increase in ECBs, bilateral and multilateral borrowings and short-term trade credit (Table III.7). III.19 Key debt sustainability indicators such as debt to GDP ratio and debt service ratio improved while other indicators showed some deterioration during 2010-11 on account of the continued dominance of debt creating flows (Table III.7 and Table III.8). Debt creating flows could increase further going forward reflecting the interest rate differentials in a liquidity surfeit global economy characterised by multi-paced recovery as also the recent policy measures aimed at raising the limit on investments by FIIs in debt markets. The debt creating flows and the volatile FII flows need to be monitored closely to avoid risks emanating from unforeseen adverse global developments. International Investment Position deteriorates III.20 India’s net international liabilities increased moderately despite the decline in the CAD during Q4 over the preceding quarter. The increase primarily reflected the valuation effects due to the depreciation of the US dollar against major international currencies (Chart III.3).
Oil prices and the pattern of capital flows likely to determine external balance III.21 India’s external debt and CAD are likely to remain manageable over the medium-term. However, some pressures could emerge with event risks. The continued diversification in terms of products and destinations with supportive policies of the government, however, augur well for realising India’s export growth potential over the medium-term. This is also reflected in the robust performance of exports during 2011-12 so far. Services exports are also likely to remain buoyant. III.22 Elevated oil prices may have adverse implications for the import bill necessitating adoption of energy efficient technology, stepup in exploration of oil and research on developing oil substitutes. In an uncertain global financial and macroeconomic environment, capital flows can turn more volatile. A favourable investment climate would be necessary to further boost FDI inflows which have recovered in the early months of 2011-12. Overall, the BoP outlook for 2011-12 remains stable though it necessitates a constant monitoring due to global uncertainties.
|
||||||||||||||||||||||||||||||||||||||||||||||||||||||||||||||||||||||||||||||||||||||||||||||||||||||||||||||||||||||||||||||||||||||||||||||||||||||||||||||||||||||||||||||||||||||||||||||||||||||||||||||||||||||||||||||||||||||||||||||||||||||||||||||||||||||||||||||||||||||||||||||||||||||||||||||||||||||||||||||||||||||||||||||||||||||||||||||||||||||||||||||||||||||||||||||||||||||||||||||||||||||||||||||||||||||||||||||||||||||||||||||||||||||||||||||||||||||||||||||||||||||||||||||||||||||||||||||||||||||||||||||||||||||||||||||||||||||||||||||||||||||||||||||||||||||||||||||||||||||||||||||||||||||||||||||||||||||||||||||||||||||||||||||||||||||||||||||||||
Page Last Updated on:


