 IST,
IST,


III. The External Sector
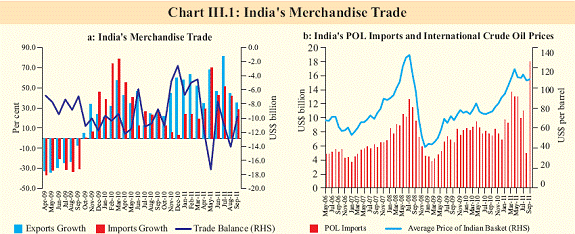
Despite a surge in exports and higher net invisibles receipts, the current account deficit (CAD) increased during Q1 of 2011-12 reflecting strong import growth on account of higher oil prices and sharp increase in imports of gold & silver, machinery and electronics. The composition of capital inflows shifted with a sharp fall in FII inflows and rise in FDI. The uncertainties associated with the sovereign debt problem in the euro area and the slowdown in the US could pose challenges for India’s external sector. The external sector outlook, though stable in the baseline scenario, will require close monitoring with a greater emphasis on encouraging FDI inflows. Widening CAD poses risks amidst uncertain global conditions III.1 Although merchandise export growth outpaced import growth, CAD surged during Q1 of 2011-12 in absolute terms, reflecting sharp increase in imports of oil, gold, silver, machinery and electronics. The wider CAD was financed comfortably with an improvement in capital flows, particularly on account of a marked increase in FDI inflows. Going forward, the external sector is expected to remain manageable although the upside risks to CAD have increased arising from slowing global economy and debt-related stress in euro area, in particular. Trade deficit widened in spite of high export growth III.2 Merchandise exports grew at a higher than anticipated rate during April-September 2011 reflecting continued diversification in terms of commodities as well as export destinations. The rise in exports was particularly on account of engineering goods (103 per cent) and petroleum & oil products (53 per cent). However, during this period, there was a sharp rise in imports as well, which led to the widening of the trade deficit. The high growth in imports stemmed from an increase in oil imports (42 per cent) and non-oil import items, viz., gold and silver (80 per cent), machinery (34 per cent), electronics (33 per cent) and organic and inorganic chemicals (26 per cent). Notably, nonoil trade deficit remained unchanged in nominal terms (Table III.1 and Chart III.1). Exports may slowdown ahead in a tougher climate III.3 India’s export growth has shown unexpected buoyancy in recent months, despite the slowdown in advanced economies (AEs) and rising global uncertainty (Table III.2). This, among others, was a reflection of the continued diversification of India’s exports to other emerging and developing economies (EDEs) where growth buoyancy was still intact as also the domestic trade policies intended to support exports. However, the slowing of AEs, with some weakening of growth prospects of EDEs, may weigh on India’s exports in subsequent months.
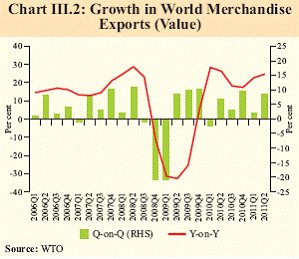
Global trade may decelerate on weakening global demand and rising risk aversion III.4 The growth in global trade has remained volatile reflecting the uncertain global environment (Chart III.2). Both the IMF and the WTO have projected a lower growth in world trade volume reflecting weakening global demand. The IMF has reduced its earlier forecast for world goods and services trade from 8.2 per cent to 7.5 per cent for 2011 and further to 5.8 per cent for 2012. The WTO has lowered its forecast for merchandise trade volume growth to 5.8 per cent in 2011 from its previous estimate of 6.5 per cent. Growth in services exports may also decelerate III.5 The surplus on account of invisibles continued to finance around 60 per cent of the merchandise trade deficit in Q1 of 2011-12. Within services, export of software services continued to grow in Q1, though at a lower rate than during the previous quarter. Private transfers, representing workers’ remittances from abroad, remained marginally higher in Q1 than in the corresponding quarter of the previous year despite uncertainties in source countries. The decline in investment income, reflecting lower interest rates abroad, also impacted the overall net receipts on account of invisibles (Table III.3). In the coming quarters, a slowdown in the US and the euro area may have some impact for exports of invisibles, particularly software services, as was evident during Q4 of 2008-09 to Q2 of 2009-10.
Sharp decline in FII flows largely offset by strong FDI flows in Q2 of 2011-12 III.6 So far in 2011-12, capital inflows have exhibited an uptrend, mainly on account of robust FDI inflows and rise in external commercial borrowings (ECBs) and trade credit. FDI inflows were almost double the level recorded during the corresponding period of 2010-11 while ECBs also registered healthy growth (Table III.4). However, net FII inflows have not only been volatile but also significantly low up to October 14, 2011. Volatility in FII inflows witnessed in Q2 mainly reflected concerns of a double-dip recession in the US and a worsening debt crisis in the euro area. During Q1 of 2011-12, the surplus on capital account at US$ 20.9 billion was more than adequate for financing the higher CAD at US$ 14.5 billion (Table III.5).
Overall capital flows to emerging markets entering an uncertain phase III.7 EDEs are facing a general rise in volatility of capital flows with resurfacing of global downside risks and even the possibility of a reversal of such flows under extreme circumstances cannot be ruled out. The possibility of contagion from the euro area banking system to the EDEs remains high. This can operate through adverse impact on the balance sheets of the subsidiaries of European banks operating in the EDEs and due to investment funds liquidating their positions because of any losses on assets in AEs. Going forward, in context of India, buoyancy in FDI inflows may continue during the second half of 2011-12, as projects attracting significant FDI are already in the pipeline. Uncertainty remains, however, regarding portfolio flows, which are by nature volatile. Debt creating capital flows also uncertain in spite of widening interest rate differential III.8 During 2011-12 so far, ECBs registered healthy growth and NRI deposits also showed marginal increase. The ECB policy was further rationalised and liberalised in September 2011. The increase in the annual limit for eligible borrowers under the automatic route may help in sustaining the uptrend in ECBs in the coming quarters of 2011-12. However, euro imbroglio, if continues, may affect the availability and cost of debt creating flows.
Rupee sees significant nominal and real depreciation in Q2 of 2011-12 III.9 Based on narrow as well as broad currency baskets (i.e., 6, 30 and 36 currency baskets), the Indian rupee depreciated sharply over end-March 2011 both in nominal and real terms (Table III.6). External vulnerability indicators portray a mixed picture III.10 India’s external debt stock as at end-June 2011 showed an increase of US$10.4 billion over the level as at end-March 2011 mainly on account of ECBs reflecting interest rate differential and short-term trade credit reflecting surge in imports (Table III.7). III.11 The key debt sustainability indicators, such as ratio of short-term debt to total external debt, ratio of short-term debt to reserves, and debt service ratio marginally worsened due to the continued dominance of debt creating flows. However, other indicators, viz., reserves cover for imports and debt service payments improved during Q1 of 2011-12 (Table III.8). Going forward, debt flows may increase further due to persistence of interest rate differentials, higher annual ceiling for ECBs under the automatic route for corporates in specified sectors and liberalisation of investment by FIIs in corporate bonds for the infrastructure sector.
External sector outlook, although stable, warrants close monitoring III.12 With progressive diversification both in terms of commodities as well as destinations, exports during the year so far (up to September 2011) have grown faster than imports and net services also continue to grow albeit at moderate pace. However, owing to increasing uncertainty in growth prospects of US and European economies, the growth momentum in exports seen so far may not be sustained and growth in services exports may also remain moderate in the coming months. While uncertain global economic and financial prospects underpinned volatile international price of crude oil, some moderation in prices due to downward revision in global oil demand in coming period may provide some relief. III.13Trends in capital inflows so far suggest that the economy has received sufficient flows to finance CAD during the first half of 2011- 12. Although there has been a marked decline in net FII flows, a significant pick up in FDI inflows augurs well from the sustainability point of view. Going forward, capital flows into India will depend on how the economic and financial conditions in AEs, particularly the US and the euro area, evolve during the second half and whether relative growth and interest rate differential would suffice to outweigh the general risk perception among foreign investors. It is, therefore, important to encourage FDI inflows to impart stability to India’s capital account. Overall, the balance of payments outlook for 2011-12, although stable, warrants close monitoring.
|
||||||||||||||||||||||||||||||||||||||||||||||||||||||||||||||||||||||||||||||||||||||||||||||||||||||||||||||||||||||||||||||||||||||||||||||||||||||||||||||||||||||||||||||||||||||||||||||||||||||||||||||||||||||||||||||||||||||||||||||||||||||||||||||||||||||||||||||||||||||||||||||||||||||||||||||||||||||||||||||||||||||||||||||||||||||||||||||||||||||||||||||||||||||||||||||||||||||||||||||||||||||||||||||||||||||||||||||||||||||||||||||||||||||||||||||||||||||||||||||||||||||||||||||||||||||||||||||||||||||||||||||||||||||||||||||||||||||||||||||||||||||||||||||||||||||||||||||||||||||||||||||||||||||||||||||||||||||||||||||||||

Share this page:


Install the RBI mobile application and get quick access to the latest news!
Scan the QR code to install our app


Page Last Updated on:


