 IST,
IST,
III. The External Sector
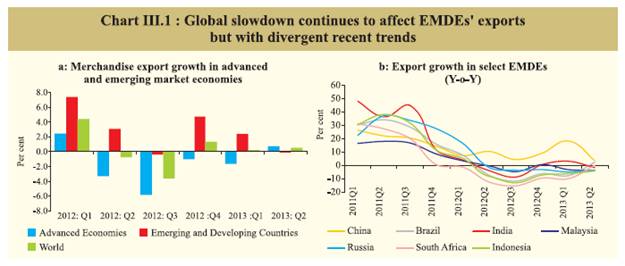
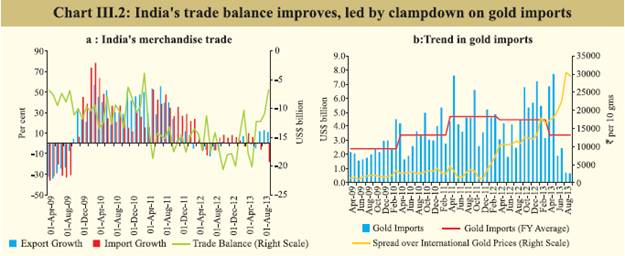
Though the CAD widened again in Q1 of 2013-14, it is likely to moderate in Q2, broadly in line with the narrowing trade deficit. While re-pricing of risk and anticipated dollar liquidity shortage in view of the Fed’s May 2013 statement on asset purchase tapering led to the depreciation of the rupee and capital outflows from India in line with other EMDEs, this trend reversed in early September following additional policy measures and improvements in global sentiments. Consequently, external sector risks have somewhat receded. However, the window of opportunity so created needs to be used to bring about further durable adjustment to lower CAD and encourage its financing through long-term capital inflows, so as to impart greater resilience to large shocks. World trade prospects remain weak III.1 India’s export performance over the last two years has been affected by continued sluggishness in global trade and an overvalued exchange rate for a prolonged period. Judging by the trends so far, global trade volumes in 2013 are expected to expand at roughly the same rate as last year, which was the slowest pace in the last 12 years, except for the contraction in 2009 in the wake of the global financial crisis. A slowdown in growth in key emerging markets and developing economies (EMDEs) has further affected exports from these countries, which turned negative in Q2 of 2013 (Chart III.1a). However, there have been divergent trends in these countries in the recent period (Chart III.1b), including pick-up in India’s exports in Q2 of 2013-14 (July-September). The depreciation in the exchange rate, both in nominal and real terms, appears to have helped improve India’s export competitiveness in recent months. Trade deficit narrowed with pick-up in exports and fall in imports in Q2 of 2013-14 III.2 Amidst an adverse external environment, policy interventions helped India to reduce its trade deficit by about 38.7 per cent in Q2 of 2013-14 (y-o-y basis) (Chart III.2a). This was on account of both a sharp pick-up in exports and some moderation in imports. III.3 Export recoveries were evident in sectors, such as petroleum products, rice, readymade garments, marine products and other chemicals. Moderation in imports was largely led by a sharp decline in gold and silver import and a slowdown in imports of machinery, fertiliser, project goods, coal, vegetable oil and iron and steel. Subsequent to various measures undertaken by the Reserve Bank and the government to curb gold imports and a sharp depreciation in the rupee, gold imports declined by about 65 per cent in Q2 of 2013-14 (y-o-y) compared to an increase of 80.5 per cent in Q1 (Chart III.2b and Table III.1). During Q2, decline in value of gold imports was on account of both softening of international gold price and moderation in quantum of gold imports (by about 55 per cent). Accordingly, the merchandise trade deficit in Q2 of 2013-14 was significantly lower than that in the corresponding period in the previous year. Sustained improvements in the trade balance will, however, require a gradual recovery in trade partner economies and lower international prices of key import items (e.g. crude oil) as well as greater domestic production of commodities such as coal and iron ore. CAD, though widened in Q1 is likely to moderate in Q2 III.4 India’s current account deficit (CAD) widened from 3.6 per cent of GDP in Q4 of 2012-13 to 4.9 per cent of GDP in Q1 of 2013- 14 (Table III.2). With some visible improvement in the trade balance in Q2 of 2013-14, CAD is likely to show a significant correction in Q2. FII flows, which had turned negative since end-May 2013, reversed in September III.5 Notwithstanding a higher CAD in Q1 of 2013-14, capital inflows were broadly adequate to finance the current account gap, requiring only a marginal drawdown of foreign exchange reserves (Table III.3). While the net inflows under foreign direct investment (FDI) increased marginally, a significant rise was evident in NRI deposits over the previous quarter. Besides, there was a significant drawdown of assets held by banks under Nostro balances. Net foreign institutional investment (FII) flows remained buoyant in the first two months of Q1. However, amid concerns about the gradual withdrawal of the quantitative easing (QE) programme, as indicated by the US Fed on May 22, 2013, there was re-pricing of risk and concomitant capital outflows from EMDEs, including India. Since then, there has been a net outflow of FII investments of US$ 16.6 billion up to September 6, 2013 before resumption of inflows in subsequent weeks. On average, there was a net FII outflow of US$ 2.2 billion in each month of Q2 (Table III.4). III.6 Recognising the risks to capital flows emanating from global financial conditions, the government and the Reserve Bank undertook various measures to facilitate capital inflows in the recent period, including (i) liberalised FDI norms through review of limits and (or) routes for select sectors viz., telecom, asset reconstruction companies, credit information companies, petroleum and natural gas, courier services, commodity exchanges, infrastructure companies in the securities market and power exchanges, (ii) offering a window for the banks to swap the fresh FCNR(B) dollar funds with the Reserve Bank, (iii) increase in the overseas borrowing limit from 50 to 100 per cent of the unimpaired Tier I capital of banks (with the option of swap with the Reserve Bank, and (iv) permission to avail of ECB under the approval route from their foreign equity holder company for general corporate purposes. Since the introduction on September 10, 2013 of swap facility for FCNR(B) deposits and bank overseas borrowings, US$ 6.9 billion and US$ 4.4 billion had been received under the respective schemes until October 25, 2013.
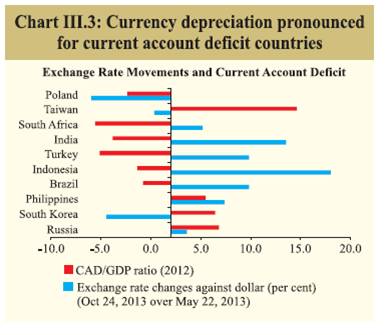
Exchange rate pressures abate after a spell of sharp depreciation III.7 Amid heightened volatility in global and Indian currency markets, the Indian rupee depreciated speedily by 17.7 per cent against the US dollar during mid-May to end-August 2013. However, the rupee reversed the trend in September 2013 and appreciated by 6.0 per cent and further by 1.9 per cent up to October 25, 2013 as market sentiments improved on the back of various policy measures announced by the Reserve Bank and the government and the Fed’s decision later in the month to maintain the pace of its QE. The opening of a forex swap window for the public sector oil marketing companies played an important role in stabilising rupee. Earlier, exchange rate pressures were evident in most EMDEs, particularly for current account deficit countries like India, where portfolio flows were severely affected due to the anticipation of a rollback of the bond purchase programme by the US Fed (Chart III.3). III.8 In terms of the real exchange rate, as on October 18, 2013, the 6-currency and 36-currency REER showed a depreciation of 13.0 and 9.8 per cent respectively, over March 2013 (Table III.5). Net international investment position improves III.9 Notwithstanding a decline in absolute terms, India’s external debt as a ratio to GDP increased in Q1 of 2013-14. Decline in the level of external debt was mainly attributed to a fall in rupee denominated debt led by depreciation in the rupee and outflows from the debt segment of FIIs. While reserve adequacy indicators deteriorated further in Q1, India’s reserves remained adequate to meet exigencies. India’s net international investment position (IIP) as a ratio to GDP, improved from (-) 16.8 per cent at end-March 2013 to (-) 15.9 per cent at end- June 2013 (Tables III.6 and III.7).
External risks somewhat declined, but need to build upon recent gains III.10 Since 2008-09, in the wake of the global financial crisis, India’s external sector’s weakness has come to the fore in several dimensions. First, CAD widened as a result of cyclical and structural factors. The CAD/GDP ratio averaged 3.4 per cent during the five-year period 2008-09 to 2012-13 after having averaged just 0.6 per cent in the preceding 16 years after the 1991-92 balance of payment crisis. Second, there has been a surge in imports over the last nine years, as a result of which imports as a ratio of GDP almost doubled to 22.3 per cent from 11.8 per cent during the preceding 12-year period of 1992-93 to 2003- 04. The exports to GDP ratio also improved, but roughly at half the pace at which the imports increased. Improved foreign investment inflows helped finance the growing trade imbalance, but capital flow reversals post-Lehman crisis and again after the tapering indication this year exposed the growing imbalance making financing of CAD difficult. Consequently, the rupee came under pressure. III.11 In face of these pressures, the Reserve Bank and the government adopted a judicious approach that encompassed trade, monetary, fiscal and exchange rate policies to bring about a macroeconomic adjustment. Consequently, external sector risks have receded somewhat. However, uncertainties about future event shocks remain. It is, therefore, important to build on the recent gains by aiming at structural adjustments to further reduce CAD over the medium-term and encourage its financing through stable capital inflows. |
||||||||||||||||||||||||||||||||||||||||||||||||||||||||||||||||||||||||||||||||||||||||||||||||||||||||||||||||||||||||||||||||||||||||||||||||||||||||||||||||||
Page Last Updated on:


